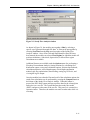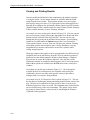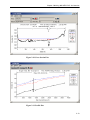
1
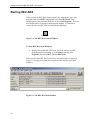
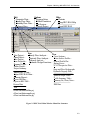
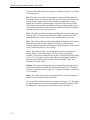
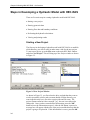
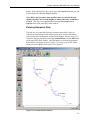
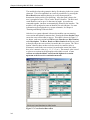
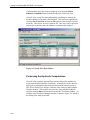
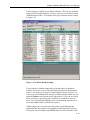
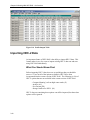
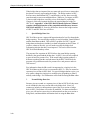
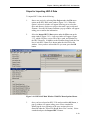
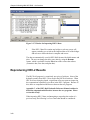
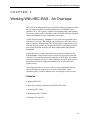
Chapter 3 Working With HEC-RAS - An Overview
CHAPTER 3
Working With HEC-RAS - An Overview
HEC-RAS is an integrated package of hydraulic analysis programs, in which
the user interacts with the system through the use of a Graphical User
Interface (GUI). The system is capable of performing Steady and Unsteady
Flow water surface profile calculations, and will include Sediment Transport
and several hydraulic design computations in the future.
In HEC-RAS terminology, a Project is a set of data files associated with a
particular river system. The modeler can perform any or all of the various
types of analyses, included in the HEC-RAS package, as part of the project.
The data files for a project are categorized as follows: plan data, geometric
data, steady flow data, unsteady flow data, sediment data, and hydraulic
design data.
During the course of a study the modeler may want to formulate several
different Plans. Each plan represents a specific set of geometric data and
flow data. Once the basic data are entered into the HEC-RAS, the modeler
can easily formulate new plans. After simulations are made for the various
plans, the results can be compared simultaneously in both tabular and
graphical form.
This chapter provides an overview of how a study is performed with the
HEC-RAS software. Special topics on how to import HEC-2 data,
reproducing HEC-2 results, and how to use on-line help are also covered.
Contents
Starting HEC-RAS
Steps in Developing a Hydraulic Model With HEC-RAS
Importing HEC-2 Data
Reproducing HEC-2 Results
Getting and Using Help
3-1
Chapter 3 Working With HEC-RAS - An Overview
Starting HEC-RAS
When you run the HEC-RAS Setup program, you automatically get a new
program group called HEC and program icon called HEC-RAS. They
should appear in the start menu under the section called Programs. The user
also has the option of creating a shortcut on the desktop. If a shortcut is
created, the icon for HEC-RAS will look like the following:
HEC-RAS 3.1
Figure 3.1 The HEC-RAS Icon in Windows
To Start HEC-RAS from Windows:
Double-click on the HEC-RAS Icon. If you do not have an HECRAS shortcut on the desktop, go to the Start menu and select
Programs, then select HEC, and then HEC-RAS.
When you first start HEC-RAS, you will see the main window as shown in
Figure 3.2 (except you will not have any project files listed on your main
window).
Figure 3.2 The HEC-RAS Main Window
3-2
Chapter 3 Working With HEC-RAS - An Overview
Edit
Options
Geometric Data...
Program Setup
Steady Flow Data...
Default Parameters
Unsteady Flow Data… Unit System...
Sediment Data...
Convert Project
Help
Contents
Using HEC-RAS Help
About HEC-RAS
File
Run
View
New Project...
Steady Flow Analysis...
Cross Sections...
Open Project...
Unsteady Flow Analysis...
Surface Profiles...
Water
Save Project
Sediment Analysis...
Save ProjectAs... Hydraulic Design Functions... General Profile Plot
Rating Curves
Rename Project...
X-Y-Z Perspective Plots...
Delete Project...
Project Summary
Import HEC-2 Data...
Import HEC-RAS Data...
Generate Report...
Export GIS Data…
Export to HEC-DSS…
Restore Data
Stage and Flow Hydrographs
Hydraulic Property Plots
Detailed Output Tables
Profile Summary Table...
Summary Err, Warn, Notes...
DSS Data
Exit
d:\hec\ras\data\buffalo.prj
d:\hec\ras\data\example.prj
d:\hec\ras\data\onebox.prj
Figure 3.3 HEC-RAS Main Window Menu Bar Structure
3-3
Chapter 3 Working With HEC-RAS - An Overview
At the top of the HEC-RAS main window is a Menu bar (Figure 3.3) with the
following options:
File: This option is used for file management. Options available under the
File menu include: New Project; Open Project; Save Project; Save Project As;
Rename Project: Delete Project; Project Summary; Import HEC-2 Data;
Import HEC-RAS data; Generate Report; Export GIS Data; Export to HECDSS; Restore Data; and Exit. In addition, the most recently opened projects
will be listed at the bottom of the File menu, which allows the user to quickly
open a project that was recently worked on.
Edit: This option is used for entering and editing data. Data are categorized
into four types: Geometric Data; Steady Flow Data; Unsteady Flow Data;
and Sediment Data. In the current version, Sediment Data is not active.
Run: This option is used to perform the hydraulic calculations. The options
under this menu item include: Steady Flow Analysis; Unsteady Flow
Analysis; Sediment Analysis; and Hydraulic Design Functions. In the current
version, Sediment Analysis is not available.
View: This option contains a set of tools that provide for graphical and
tabular displays of the model output. The View menu item currently
includes: Cross Sections; Water Surface Profiles; General Profile Plot; Rating
Curves; X-Y-Z Perspective Plots; Stage and Flow Hydrographs; Hydraulic
Properties Plots; Detailed Output Tables; Profile Summary Tables; and
Summary Err, Warn, Notes.
Options: This menu item allows the user to change Program Setup options;
set Default Parameters; establish the Default Units System (U.S. Customary
or Metric); and Convert Project Units (U.S. Customary to Metric, or Metric to
U.S. Customary).
Help: This option allows the user to get on-line help, as well as display the
current version information about HEC-RAS.
Also on the HEC-RAS main window is a Button bar (Figure 3.4). The Button
bar provides quick access to the most frequently used options under the HECRAS menu bar. A description of each button is shown in Figure 3.4.
3-4
Chapter 3 Working With HEC-RAS - An Overview
Unsteady Flow Data: Unsteady Flow Analysis:
Perform an unsteady flow
Edit and/or enter
simulation
unsteady flow data
Geometric Data:
Edit and/or enter
geometric Data
Cross Sections:
View cross
section plots
XYZ Perspective Plot:
View 3D multiple cross
section plot
Hydraulic Properties:
Plots and tables of
hydraulic properties
Profile Summary Table:
View summary output at
multiple locations by profile
General Profile Plot:
View computed
variables along the
channel
Open Project:
Open an existing
project
View DSS: View
Data stored in DSS
Rating Curve:
View computed
rating curves
Save Project:
Save an existing
project
Profile Plot:
View water surface
profile plots
Steady Flow Data:
Edit and/or enter
steady flow data
Hydraulic Design Functions:
Perform hydraulic design
computations
Sum Errs, Warn, Notes:
Summary of Errors,
Warnings, and Notes
Detailed Output Table:
View detailed output at crosssections, bridges, culverts, etc…
Stage and Flow Hydrographs:
Plot stage and flow hydrographs
Steady Flow Analysis:
Perform a steady flow
simulation
Figure 3.4 HEC-RAS Main Window Button Bar
3-5
Chapter 3 Working With HEC-RAS - An Overview
Steps in Developing a Hydraulic Model with HEC-RAS
There are five main steps in creating a hydraulic model with HEC-RAS:
Starting a new project
Entering geometric data
Entering flow data and boundary conditions
Performing the hydraulic calculations
Viewing and printing results
Starting a New Project
The first step in developing a hydraulic model with HEC-RAS is to establish
which directory you wish to work in and to enter a title for the new project.
To start a new project, go to the File menu on the main HEC-RAS window
and select New Project. This will bring up a New Project window as shown
in Figure 3.5.
Figure 3.5 New Project Window
As shown in Figure 3.5, you first select the drive and path that they want to
work in (to actually select a path you must double click the directory you
want in the directory box), next enter a project title and file name. The
project filename must have the extension ".prj", the user is not allowed to
change this. Once you have entered all the information, press the "OK"
button to have the information accepted. After the OK button is pressed, a
message box will appear with the title of the project and the directory that the
project is going to be placed in. If this information is correct, press the OK
3-6
Chapter 3 Working With HEC-RAS - An Overview
button. If the information is not correct, press the Cancel button and you will
be placed back into the New Project window.
Note: Before any Geometric data and Flow data are entered, the user
should select the Units System (English or Metric) that they would like to
work in. This step is accomplished by selecting Unit System from the
Options menu of the main HEC-RAS window.
Entering Geometric Data
The next step is to enter the necessary geometric data, which consist of
connectivity information for the stream system (River System Schematic),
cross-section data, and hydraulic structure data (bridges, culverts, weirs, etc.).
Geometric data are entered by selecting Geometric Data from the Edit menu
on the main HEC-RAS window. Once this option is selected, the geometric
data window will appear as show in Figure 3.6 (except yours will be blank
when you first bring this screen up for a new project).
Figure 3.6 Geometric Data Window
3-7
Chapter 3 Working With HEC-RAS - An Overview
The modeler develops the geometric data by first drawing in the river system
schematic. This is accomplished, on a reach-by-reach basis, by pressing the
River Reach button and then drawing in a reach from upstream to
downstream (in the positive flow direction). After the reach is drawn, the
user is prompted to enter a "River" and a "Reach" identifier. The River and
reach identifiers can be up to 16 characters in length. As reaches are
connected together, junctions are automatically formed by the interface. The
modeler is also prompted to enter an identifier for each junction. For more
information on developing the river system schematic, see Chapter 6
"Entering and Editing Geometric Data."
After the river system schematic is drawn, the modeler can start entering
cross-section and hydraulic structure data. Pressing the Cross Section button
causes the cross section editor to pop up. This editor is shown in Figure 3.7.
As shown, each cross section has a River name, Reach name, River Station,
and a Description. The River, Reach and River Station identifiers are used
to describe where the cross section is located in the river system. The "River
Station" identifier does not have to be the actual river station (miles or
kilometers) at which the cross section is located on the stream, but it does
have to be a numeric value (e.g., 1.1, 2, 3.5, etc.). The numeric value is used
to place cross sections in the appropriate order within a reach. Cross
sections are ordered within a reach from the highest river station
upstream to the lowest river station downstream.
Figure 3.7 Cross Section Data editor
3-8
Chapter 3 Working With HEC-RAS - An Overview
The basic data required for each cross section are shown on the Cross Section
Data editor in Figure 3.7. Additional cross section features are available
under Options from the menu bar. These options include: adding, copying,
renaming and deleting cross sections; adjusting cross section elevations,
stations, and n or k-values; skew cross section; ineffective flow areas; levees;
blocked obstructions; adding a lid to a cross section; add ice cover; add a
rating curve; horizontal variation of n or k-values; and vertical variation of n
values.
Also, available from the Cross Section Data editor is the ability to plot any
cross section or reach profile. Edit features are available to cut, copy, paste,
insert, and delete data from the Cross Section X-Y Coordinates grid.
Once the cross-section data are entered, the modeler can then add any
hydraulic structures such as bridges, culverts, weirs and spillways. Data
editors, similar to the cross section data editor, are available for the various
types of hydraulic structures. If there are any stream junctions in the river
system, additional data are required for each junction. The Junction data
editor is available from the Geometric Data window.
Once geometric data are entered, the data should be saved to a file on the hard
disk. This is accomplished by selecting the Save Geometric Data As option
from the File menu on the Geometric Data editor. This option allows the user
to enter a title for the geometric data. A filename is automatically established
for the geometric data, and then saved to the disk. Once a title is established,
geometric data can be saved periodically by selecting Save Geometric Data
from the File menu of the Geometric Data editor.
Entering Flow Data and Boundary Conditions
Once the geometric data are entered, the modeler can then enter either steady
flow or unsteady flow data. The type of flow data entered depends upon the
type of analyses to be performed. For the discussion in this chapter, it is
assumed that a steady flow analysis will be performed. The data entry form
for steady flow data is available under the Edit menu bar option on the HECRAS main window.
An example of the steady flow data entry form is shown in Figure 3.8, which
is the Steady Flow Data Editor. As shown in Figure 3.8, steady flow data
consist of: the number of profiles to be computed; the flow data; and the river
system boundary conditions. At least one flow must be entered for every
reach within the system. Additionally, flow can be changed at any location
within the river system. Flow values must be entered for all profiles.
Boundary conditions are required in order to perform the calculations. If a
subcritical flow analysis is going to be performed, then only the downstream
boundary conditions are required. If a supercritical flow analysis is going to
be performed, then only the upstream boundary conditions are required. If
the modeler is going to perform a mixed flow regime calculation, then both
upstream and downstream boundary conditions are required. The Boundary
3-9
Chapter 3 Working With HEC-RAS - An Overview
Conditions data entry form can be brought up by pressing the Reach
Boundary Conditions button from the Steady Flow Data entry form.
Once all of the steady flow data and boundary conditions are entered, the
modeler should save the data to the hard disk. This can be accomplished by
selecting Save Flow Data As from the File option on the Steady Flow Data
menu bar. Flow data is saved in a separate file. The user is only required to
enter a title for the flow data, the filename is automatically assigned.
Figure 3.8 Steady Flow Data window
Performing the Hydraulic Computations
Once all of the geometric data and flow data are entered, the modeler can
begin to perform the hydraulic calculations. As stated previously, there are
three types of calculations that can be performed in the current version of
HEC-RAS: Steady Flow Analysis, Unsteady Flow Analysis, and Hydraulic
Design Functions. The modeler can select any of the available hydraulic
analyses from the Run menu bar option on the HEC-RAS main window. An
example of the Simulation Manager window is shown in Figure 3.9, which is
the Steady Flow Analysis window.
3-10
Chapter 3 Working With HEC-RAS - An Overview
Figure 3.9 Steady Flow Analysis window
As shown in Figure 3.9, the modeler puts together a Plan by selecting a
specific set of geometric data and flow data. A Plan can be put together by
selecting New Plan from the File menu bar option of the Steady Flow
Analysis window. Once a Plan Title and Short Identifier (Short ID) have
been entered, the modeler can select a Flow Regime for which the model will
perform calculations. Subcritical, Supercritical, or Mixed flow regime
calculations are available.
Additional features are available under the Options menu for: performing a
Floodway Encroachment Analysis; Setting locations for calculating flow
distribution output; conveyance calculation options; friction slope methods;
calculation tolerances; critical depth output; critical depth computation
method; split flow optimization; data checking; setting log file levels; and
viewing the log file output.
Once the modeler has selected a Plan and set all of the calculation options, the
steady flow calculations can be performed by pressing the Compute button at
the bottom of the Steady Flow Analysis window. When this button is
pressed, the HEC-RAS system packages up all the data for the selected plan
and writes it to a run file. The system then runs the steady flow model
(SNET) and passes it the name of the run file. This process is executed in a
separate window. Therefore, the modeler can work on other tasks while it is
executing.
3-11
Chapter 3 Working With HEC-RAS - An Overview
Viewing and Printing Results
Once the model has finished all of the computations, the modeler can begin
viewing the results. Several output features are available under the View
option from the main window. These options include: cross section plots;
profile plots; rating curve plots; X-Y-Z perspective plots; hydrograph plot (if
unsteady flow simulation was performed); tabular output at specific locations
(Detailed Output Tables); tabular output for many locations (Profile Summary
Tables); and the summary of errors, warnings, and notes.
An example of a cross section plot is shown in Figure 3.10. The user can plot
any cross section by simply selecting the appropriate River, Reach and River
Station from the list boxes at the top of the plot. The user can also step
through the plots by using the up and down arrow buttons. Several plotting
features are available under the Options menu of the Cross Section plot.
These options include: zoom in; zoom out; full plot; pan; animate; selecting
which plans, profiles and variables to plot; velocity distribution; viewing
interpolated cross-sections; and control over the lines, symbols, labels,
scaling, and grid options.
Hard copy outputs of the graphics can be accomplished in two different ways.
Graphical plots can be sent directly from HEC-RAS to whichever printer or
plotter the user has defined under the Windows Print Manager. Graphical
plots can also be sent to the Windows clipboard. Once the plot is in the
clipboard it can then be pasted into other programs, such as a word processor.
Both of these options are available from the File menu on the various plot
windows.
An example of a profile plot is shown in Figure 3.11. All of the options
available in the cross section plot are also available in the profile plot.
Additionally, the user can select which specific reaches to plot when a
multiple-reach river system is being modeled.
An example of an X-Y-Z Perspective Plot is shown in Figure 3.12. The user
has the option of defining the starting and ending location for the extent of the
plot. The plot can be rotated left or right, and up or down, in order to get
different perspectives of the river reach. The computed water surface profiles
can be overlaid on top of the cross section data. The graphic can be sent to
the printer or plotter directly, or the plot can be sent through the Windows
Clipboard to other programs.
3-12
Chapter 3 Working With HEC-RAS - An Overview
Figure 3.10 Cross Section Plot
Figure 3.11 Profile Plot
3-13
Chapter 3 Working With HEC-RAS - An Overview
Figure 3.12 X-Y-Z Perspective Plot of River Reach with a Bridge
3-14
Chapter 3 Working With HEC-RAS - An Overview
Tabular output is available in two different formats. The first type of tabular
output provides detailed hydraulic results at a specific cross section location
(Detailed Output Table). An example of this type of tabular output is shown
in Figure 3.13.
Figure 3.13 Tabular Detailed Output
The second type of tabular output shows a limited number of hydraulic
variables for several cross sections and multiple profiles (Profile Summary
Tables). An example of this type of tabular output is shown in Figure 3.14.
There are several standard tables that are predefined and provided to the user
under the Tables menu from the profile output tables. Users can also define
their own tables by specifying what variables they would like to have in a
table. User specified table headings can be saved and then selected later as
one of the standard tables available to the project.
Tabular output can be sent directly to the printer or passed through the
clipboard in the same manner as the graphical output described previously.
This option is also available under the File menu on each of the table forms.
3-15
Chapter 3 Working With HEC-RAS - An Overview
Figure 3.14 Profile Output Table
Importing HEC-2 Data
An important feature of HEC-RAS is the ability to import HEC-2 data. This
feature makes it easy for a user to import existing HEC-2 data sets and start
using HEC-RAS immediately.
What You Should Know First
Before importing HEC-2 data, there are several things that you should be
aware of. First, not all of the options available in HEC-2 have been
incorporated into the current version of HEC-RAS. The following is a list of
HEC-2 options that are not available in the current version of HEC-RAS:
- Compute Manning’s n from high water marks (J1)
- Archive (AC)
- Free Format (FR)
- Storage Outflow for HEC-1 (J4)
HEC-2 data sets containing these options can still be imported, but these data
options will be ignored.
3-16
Chapter 3 Working With HEC-RAS - An Overview
Another important issue to be aware of is how the cross sections are
identified. In HEC-RAS, each cross section is identified with a River name,
Reach name, and a River Station. The river stationing must be in order from
highest river stationing upstream to lowest river stationing downstream.
When the user goes to import HEC-2 data, a pop up window will appear
(Figure 3.15), asking the user to select a method for identifying the river
stationing of the cross sections. If you select "Use HEC-2 Section ID's," the
program will use the first field of the X1 record for the river stationing of the
cross section. If you choose this method, you must be sure that the cross
sections in the HEC-2 file are numbered with highest river stationing
upstream, and that no two cross sections have the same river station identifier.
If these two requirements are not met, the program will not import the data
correctly. An alternative is to select "Use Sequential Counter." This method
simply assigns river stations as 1, 2, 3, etc. in the order in which the cross
sections are found in the HEC-2 file (still maintaining highest numbers
upstream and lowest numbers downstream.
Figure 3.15 Method for Identifying River Stations from HEC-2 Data
After the HEC-2 data is imported into HEC-RAS, you may need to make
some modifications to the data. HEC-RAS is a completely new program. As
HEC-RAS was being developed, we tried to improve the hydraulic
computations in every way we could. Some of these improvements have
made it necessary to get more information and/or different information from
the user for a specific type of computation. The following is a list of features
in which the data requirements for HEC-2 and HEC-RAS have changed, and
it may be necessary for the user to modify the data after it is imported:
- Special Bridge (SB)
- Special Culvert (SC)
- Normal Bridge (X2, BT)
- Encroachments and Floodway Determination (X3, ET)
- Ineffective Flow Areas (X3)
3-17
Chapter 3 Working With HEC-RAS - An Overview
When bridge data are imported, the user must take special care to ensure that
the data are correctly representing the bridge. The bridge routines in HECRAS are more detailed than HEC-2, and therefore you may have to modify
some data and/or enter some additional data. Whenever you import an HEC2 data set with bridge data, carefully review all the data for each bridge.
Chapter 6 of this user's manual describes the required data for bridges in
HEC-RAS. Appendix C of the HEC-RAS Hydraulic Reference Manual
contains a detailed discussion of the computational differences between
HEC-RAS and HEC-2. Some key differences between the bridge routines
of HEC-2 and HEC-RAS are as follows:
1.
Special Bridge Data Sets
HEC-RAS does not use a trapezoidal approximation for low flow through the
bridge opening. The actual bridge opening is used in both the Yarnell method
and the momentum method. This could be a problem for HEC-2 special
bridge data sets that do not include low chord information on the BT data. If
you have a data set like this, you will need to modify the bridge deck
information after the data have been imported. This can be done from the
HEC-RAS Deck/Roadway editor.
The pressure flow equations in HEC-RAS use the actual bridge opening,
defined by the ground and the bridge data. In HEC-2, the user was required
to enter an area for pressure flow. If the actual bridge opening produces a
different area than what the user had entered in the HEC-2 data deck, the
program will get different results for pressure flow, and pressure and weir
flow answers.
Pier information from the SB record is incorporated as a single pier in the
HEC-RAS data set (this is how it was treated in HEC-2). Piers are treated as
separate pieces of data in HEC-RAS. For special bridges that have piers, you
may want to change the single pier to multiple piers, depending on what is
actually at the bridge. Pier information can be modified using the Pier editor.
2.
Normal Bridge Data Sets
Because piers are treated as a separate piece of data in HEC-RAS, they must
not be included in the cross section data or the bridge deck. Since it is
common to include pier information as part of the cross section or bridge
deck in HEC-2, these data will need to be modified. For data sets that have
piers, you will need to remove the pier information from the cross section or
bridge deck, and then add the information back in using the Pier editor.
3-18
Chapter 3 Working With HEC-RAS - An Overview
Steps for Importing HEC-2 Data
To import HEC-2 data, do the following:
1.
Start a new project by selecting New Project under the File menu
option on the HEC-RAS main window (Figure 3.16). When this
option is selected a window will appear allowing you to select the
drive and directory for the new project, then enter a project title and
filename. Press the OK button, and then a pop up window will appear
asking you to confirm the information.
2.
Select the Import HEC-2 Data option under the File menu on the
main window (Figure 3.16). A pop up window will appear (Figure
3.17), which will allow you to select a drive, path, and filename for
the HEC-2 data file. In addition to the filenames being listed, the first
line of each HEC-2 data file is shown under the title field on the
window. Once you have selected the file you want, press the OK
button.
Figure 3.16 HEC-RAS Main Window With File Menu Options Shown
3.
Once you have selected an HEC-2 file and pressed the OK button, a
pop up window will appear asking you to select a method for
identifying the river stationing of the cross sections (this was
discussed under the "What You Should Know First" section). Select
a method and press the Import HEC-2 button.
3-19
Chapter 3 Working With HEC-RAS - An Overview
Figure 3.17 Window for Importing HEC-2 Data
4.
If the HEC-2 data file contains any bridges or culverts, a note will
appear reminding you to look at the imported data of all of the bridges
and culverts to ensure the data is complete and correct.
The data are automatically saved in HEC-RAS format with default names and
titles. The user can change the titles at any time by using the Rename
feature, which is available from the File menu of the various data editors
(Geometric data, flow data, and plan data).
Reproducing HEC-2 Results
The HEC-RAS program is a completely new piece of software. None of the
hydraulic routines from HEC-2 were used in the HEC-RAS software. When
HEC-RAS was being developed, a significant effort was spent on improving
the computational capabilities over those in the HEC-2 program. Because of
this, there are computational differences between the two programs.
Appendix C, of the HEC-RAS Hydraulic Reference Manual, outlines in
detail the computational differences between the two programs. Please
review this closely!
When importing HEC-2 data, and attempting to reproduce the results of a
previous study, the following is a list of items that should be considered:
3-20
Chapter 3 Working With HEC-RAS - An Overview
1.
First, is the data that you have imported good data? In other words,
did it come from a working HEC-2 model, and was that model
considered as being hydraulically sound. Are there an adequate
number of cross sections? And are there any mistakes in the cross
section data? Review the data closely, before you assume that it is
good!
2.
The default method for calculating conveyance in HEC-RAS is
different from HEC-2. However, HEC-RAS has the ability to
compute conveyance with the HEC-2 methodology. If you are trying
to reproduce HEC-2 results, you may want to switch HEC-RAS to the
HEC-2 method of computing conveyance. To do this, from the
Steady Flow Analysis window select Options from the menu bar then
select Conveyance Calculations. When this is selected, a pop up
window will appear as shown in Figure 3.18. There are two options
available, the HEC-RAS default method (break in n-value method)
and the HEC-2 style method. Select the HEC-2 style method if you
are trying to reproduce HEC-2 results. For more information on the
differences in conveyance calculations, see Appendix C of the HECRAS Hydraulic Reference manual.
Figure 3.18 HEC-RAS Conveyance Calculation Methods
3.
The HEC-RAS bridge routines are more comprehensive than the
HEC-2 bridge routines, and therefore differences can occur at bridge
locations. First, review the bridge data closely and make sure it
accurately represents the bridge you are trying to model. If you feel it
is necessary to match the results of a previous study at the bridge,
then your only alternative is to adjust the coefficients that are being
used in the bridge modeling approach (i.e., pressure and weir flow
coefficients, low flow coefficients, contraction and expansion
coefficients, etc...). For detailed information on the differences
between the HEC-RAS and HEC-2 bridge routines, please review
Appendix C of the Hydraulic Reference manual.
3-21
Chapter 3 Working With HEC-RAS - An Overview
4.
Sometimes differences can occur at locations where the programs
have defaulted to a critical depth solution. First you should ask
yourself if critical depth is an appropriate solution for this location. It
is a common problem for both programs to default to critical depth
when the cross sections are spaced too far apart. If you feel critical
depth is an appropriate solution, then in general the HEC-RAS answer
will be better than HEC-2. The critical depth routines in HEC-RAS
are much more comprehensive than HEC-2. HEC-RAS has tighter
error limits for locating critical depth, as well as the ability to find
multiple critical depths and detect which is the most appropriate.
5.
Differences can also occur at locations where floodway
encroachments are being computed. The HEC-RAS floodway
encroachment routines have been improved over those available in
HEC-2. Also, the default at bridges in HEC-RAS is to perform the
encroachment analysis, while the default in HEC-2 was to not
encroach at bridges. For more details on differences between
encroachment routines, please review Appendix C of the HEC-RAS
Hydraulic Reference Manual.
6.
After carefully reviewing items one through five above, if you still
have computational differences in the computed profiles, you may
need to modify Manning’s n values in order to reproduce the previous
study results. In general, this is not suggested. If you do decide to
modify the n values, try to keep them within a realistic range of what
is appropriate for the stream you are working on.
Getting and Using Help
On-line help is available from within the HEC-RAS software. Help can be
accessed by selecting the Help menu option at the top of each window, or by
pressing the F1 function key.
3-22