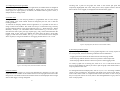
1
Appendix D : Compatible Hardware
1) The following EasyLog modules are compatible with EL-WIN V4.00
EL-LITE
EL-1
EL-2
EL-2-IR
EL-1-12BIT
EL-2-12BIT
EL-3-12BIT
EL-IP67-12
Single channel, temperature-only data logger, cased
Single channel, 8-bit, multi-parameter data logger, panel mounted
Single channel, 8-bit, multi-parameter data logger, cased
Single channel, 8-bit, multi-parameter data logger, InfraRed interface, cased
Single channel, 12-bit, multi-parameter data logger, panel mounted
Single channel, 12-bit, multi-parameter data logger, cased
Dual channel, 12-bit, multi-parameter data logger, panel mounted
Single channel, 12-bit, multi-parameter data logger, IP67 / NEMA 4X rated
2) The following sensor probes are compatible with EasyLog modules
Part Number
K-TYPE PROBE
K-TYPE PROBE-P
Compatibility
EL-1
EL-2, EL-2-IR
PT-TYPE PROBE
PT-TYP PROBE-D
EL-1-12BIT, EL-3-12BIT
EL-2-12BIT
RH PROBE
RH PROBE-D
EL-1-12BIT, EL-3-12BIT
EL-2-12BIT
PH PROBE
PH PROBE-P
BUFFER-04PH
BUFFER-10PH
EL-1
EL-2, EL-2-IR
EL-1, EL-2
EL-1, EL-2
EL-WIN
Version 4.02
SOFTWARE MANUAL
3) The following hardware is compatible with EasyLog modules
EL-HL and EL-HL-2
Handheld configuration and data retrieval tool
EL-LITE, EL-1, EL-2, EL-2-IR, EL-1-12BIT, EL-2-12BIT, EL-IP67-12
EL-LINK-IR
InfraRed to RS232 converter module, PC COM port compatible
EL-2-IR, EL-IP67-12
EL-1 and EL-1-12BIT via PANEL-IR
PANEL-IR
InfraRed to RS232 converter module, panel mounted
EL-1, EL-1-12BIT
Contact Lascar Electronics or an appointed agent or visit http://www.lascarelectronics.com for further details
on the latest EasyLog hardware, software and accessories.
Version 4
28
MC
September 1999.
1
Appendix C : The Daisychain Cable
Contents
I) EL-WIN Software Installation
6
II) Configuring the EasyLog Module
Multiple EasyLog modules may be connected together to operate as a multi-channel data logging network. It is
possible to mix single and dual channel modules on a network. All modules must be set up with identical Baud
rates (typically 9600) and each module must be configured with its own unique address, set between 0 and 7
(factory default address is 0). No two modules must share the same address. Jumper link Lk1 must be removed
from all but one module.
Switch Smartsearch on to increase the likelihood that all data loggers are detected by EL-WIN during a
Search, especially when one or more modules are logging.
1) Choosing and connecting an appropriate sensor
7
2) Connecting the EasyLog module to a computer : Communications
a) Hardware Link
b) Software Link : COM port, Baud rate, Address
c) Options: Smart search, Address Limit
7
7
7
9
Ready-made cables are available from Lascar Electronics and its appointed agents, quoting part number
EasyLink. To make your own, proceed as follows.
(DV\ /RJ
(DV\ /RJ
0RGXOH 0RGXOH 3) Configuring the EasyLog module
a) Module name
b) Select channel
c) Sensor type
d) Display symbols : Units, Scaler
e) Sample rate
f) Storage modes : Normal, Rolling, Histogram, One-shot
g) Set alarms
h) Calibrating the EasyLog module
Default calibration
User calibration
i) Comms: Address, Baud rate
j) Clear/stop log
k) Reset
l) Multi-mimic
10
10
10
11
11
11
12
13
13
14
14
14
15
15
15
16
2) Push to start
16
3) Show active
16
4) Delayed start
16
5) Time and date
17
2
(DV\ /RJ
0RGXOH 56
,%0 &203$7,%/(
&20387(5
(DV\ /RJV DUH VXSSOLHG ZLWK WKH LU DGGUHVV VHW WR 'DLV\FKDLQ FDEOH OLQN LQ J X S WR (D V\/RJ PRGXOHV
:KHQ DGGLQJ ORJJHUV W R D V\VWHP JLYH HDFK RQH D GLII HUH QW DGGUH VV LQ
WKH VRI WZD UH D QG ZUL WH WKL V LQ WKH VSDFH SURYL GHG RQ W KH PRGXOH V 3&%
III) Start logging
1) Immediate start
27
/N VKRXOG WKH Q EH UHPRYHG I URP DOO EX W OR JJHU
Appendix B : File Header Description (Dual Channel Modules only)
Documented below is a typical File Header (plus brief explanatory comments) for a Normal EL-WIN datalogger file. For compressed data files, the file header is similar, but the data format is different. Lascar recommends that compressed files are expanded within EL-WIN and re-saved in uncompressed (Tab, Space or
Comma Delimited) format, before attempting to manipulate them.
EASYDATA
6
EasyLog
10
0076832041
Channel A Channel B
Name A
Name B
1
1
2
0
2
0
0
0
20.00
30.00
-10.00
-15
0
0
0
145042030896
20.000
24.000
20.000
20.000
24.000
20.000
23.000
19.000
24.000
18.000
23.000
20.000
24.000
21.000
23.000
25.000
24.000
21.000
23.000
19.000
Generic File Name
(Data) File Type
EasyLog Module’s Logger Name *
Number of Samples in this Data File : $$
EasyLog Module’s Serial No
Channel Headers
Channel Names
Units Annunciator (0=none, 1=°C, 2=V, 3=Hz, 4=°F, 5=A,
6=%RH, 7=pH, 8=Ohm)
Scaler Annunciator (0=µ, 1=m, 2=none, 3=k, 4=M)
Sensor Type (16=Temp -200 to 200°C, 17=Temp -200 to 800°C,
18=Temp -200 to 200°F, 19=Temp -328 to 1562°F,
20=Voltage -200 to 200mV, 21=Voltage -2 to 2V,
22=Voltage -20 to 20V, 23=4-20mA Indication,
24=Disabled)
Sample Rate (0=5s, 1=10s, 2=20s, 3=1m, 4=5m, 5=10m,
6=20m, 7=1Hr, 8=4Hr, 9= 12Hr)
Storage mode (0=Normal, 2=Rolling, 3=One-Shot)
High Alarm Level
Low Alarm Level
Alarm Mode (0=Off, 1=On)
Sample No of 1st Low Battery Warning ***
Sample No of 1st Power Fail Warning ***
Start Time and Date ****
First Reading Value
-- |
Next Reading Value
|
.
|
.
|
.
|
$$ Total No of samples =10
.
|
.
|
.
|
.
|
Last Reading Value
-- |
* The Logger Name supports upper and lower case characters. As the first 8 characters are later used as a DOS
file name, it is recommended that, where possible, these 8 characters form a unique name. This will minimise
the risk of accidentally overwriting an existing file.
*** If not zero (0=No Error), then this is the Sample Number of the first sample where the specified error occurred, if no roll-over has occurred when logging in rolling mode. Data from this Sample Number onwards
should be treated as suspect.
**** EasyLog stores the date in the UK convention (ddmmyy) with one important exception. The value shown
for the month is referenced from zero, i.e.: Jan=00 . . . Dec=11. If you are manipulating an EasyLog Data File
directly, then True Month = EasyLog Month +1.
If one channel was disabled during a logging exercise, then the file will contain only one column of data, together with that channel’s header and name.
26
IV) Stop logging
17
V) Downloading data from EasyLog module to computer
17
VI) Graphing
18
1) Graphing with EL-WIN
a) Viewing graphs
b) Overlaying multiple graphs
2) Customising graphs
a) Fonts
b) Adding detail to the graph
Append info
Mark points
Alarm levels
Show warnings
Zooming in & out
Graph axes
c) Filtering data
d) Histograms
18
18
19
20
20
20
20
20
20
21
21
21
22
22
VII) Exporting data
23
1) EasyLog datafile formats
23
2) Exporting data
23
Appendix A : File Header Description (Single Channel Modules Only) 25
Appendix B : File Header Description (Dual Channel Modules Only)
26
Appendix C : The Daisychain Cable
27
Appendix D : Compatible Hardware
28
3
Appendix A : File Header Description (Single Channel Modules Only)
Documented below is a typical File Header (plus brief explanatory comments) for a Normal EL-WIN
datalogger file. For compressed data files, the file header is similar, but the data format is different. Lascar
recommends that compressed files are expanded within EL-WIN and re-saved in uncompressed (Tab, Space or
Comma Delimited) format, before attempting to manipulate them.
EASYDATA
3
EasyLog
10
0076832041
1
2
0
0
0
1.00
-40.00
20.00
10.00
0
0
0
145042030896
20.000
20.000
24.000
23.000
24.000
23.000
24.000
23.000
24.000
23.000
Generic File Name
(Data) File Type
EasyLog Module’s Logger Name *
Number of Samples in this Data File : $$
EasyLog Module’s Serial No
Units Annunciator (0=none, 1=°C, 2=V, 3=Hz, 4=°F, 5=A, 6=%RH, 7=pH, 8=Ohm,
16=Temp -200 to 200°C, 17=Temp -200 to 800°C,18=Temp -200 to 200°F,
19=Temp -328 to 1562°F, 20=Voltage -200 to 200mV, 21=Voltage -2 to 2V,
22=Voltage -20 to 20V, 23=4-20mA Indication)
Scaler Annunciator (0=µ, 1=m, 2=none, 3=k, 4=M)
Sensor Type (0=T°C, 1=T°F, 2=RH, 3=pH, 4=Freq,
5=Count, 6=2V, 7=20V )
Sample Rate (0=5s, 1=10s, 2=20s, 3=1m, 4=5m,
5=10m, 6=20m, 7=1Hr, 8=4Hr, 9= 12Hr)
Storage mode (0=Normal, 1= Histogram, 2=Rolling, 3=One-Shot)
Calibration Multiplier **
Calibration Offset **
High Alarm Level
Low Alarm Level
Alarm Mode (0=Off, 1=On)
Sample No of 1st Low Battery Warning ***
Sample No of 1st Power Fail Warning ***
Start Time and Date ****
First Reading Value -- |
Next Reading Value
|
.
|
.
|
.
|
$$ Total No of samples =10
.
|
.
|
.
|
.
|
Last Reading Value -- |
* The Logger Name supports upper and lower case characters. As the first 8 characters are later used as a DOS
file name, it is recommended that, where possible, these 8 characters form a unique name. This will minimise
the risk of accidentally overwriting an existing file.
** These parameters are completely omitted from Type 3 data files, unless Storage Mode=1. For Type 4 data
files, these values are always present.
*** If not zero (0=No Error), then this is the Sample Number of the first sample where the specified error
occurred, if no roll-over has occurred when logging in rolling mode. Data from this Sample Number onwards
should be treated as suspect.
**** EasyLog stores the date in the UK convention (ddmmyy) with one important exception. The value shown
for the month is referenced from zero, i.e.: Jan=00 . . . Dec=11. If you are manipulating an EasyLog Data File
directly, then True Month = EasyLog Month +1.
4
25
One-shot mode
Data accumulated in One-shot mode cannot be exported to another application using
EL-WIN. Instead, proceed as follows.
- Download the data from the EasyLog module to computer using EL-WIN by
clicking on Save data.
- Open the file containing the saved data in a spreadsheet.
- Analyse the data, using the data in Appendix A or Appendix B.
- The file now contains the logged data in tabular format, ready for use in your
target application. The three columns in the table show Date, Time and Reading
value.
Preface :
The EL-WIN software package has been developed by Lascar Electronics to config®
ure EasyLog datalogging display modules and to produce on-screen graphical
representations of logged data.
EL-WIN is designed to be installed on, and run from, IBM compatible Personal
Computers running Windows 3.1, 95 and 98. Although EL-WIN has been known to
work successfully under other operating systems, this operation is not implied,
guaranteed or supported by Lascar Electronics.
The EL-WIN software package and this software manual were designed to configure
and support many members of the EasyLog module family, e.g.: EL-LITE, EL-1,
EL-2, EL-2-IR, EL-1-12BIT, EL-2-12BIT, EL-3-12BIT and EL-IP67-12. This means
that the availability of certain EL-WIN features is dictated not by the software, but by
the type of EasyLog module being used.
This software manual was designed in two parts. The centre card is the Easy Guide
and is intended for first time users. This card can be removed from the manual and
used on its own. The manual itself is intended as a point of reference where you can
find detailed information about EL-WIN’s many features. The Easy Guide and this
software manual should be read in conjunction with the EasyLog module’s datasheet.
We hope that most questions are answered by this manual and the EasyLog module’s
datasheet. Lascar Electronics will be pleased to offer customers and potential
EasyLog users technical assistance where required.
New data logging products are constantly being developed and datasheets are
available free-of-charge from Lascar Electronics and its appointed agents or on the
internet via http://www.lascarelectronics.com .
For further information about other standard EasyLog products, such as EasyLog
control software for the PSION workabout, or the EL-HL handheld configuration
tool, contact Lascar Electronics or one of its appointed agents.
24
5
I) EL-WIN Software Installation
VII) Exporting data
The following procedure details the installation of the EL-WIN control software onto
your computer’s hard disk.
Data, stored inside an EasyLog module, can be downloaded via EL-WIN and
exported to other software applications for further processing. This may be necessary
when EL-WIN’s graphing features, though extensive, are not sufficient for the
intended purpose.
a)
b)
c)
d)
e)
f)
Start Windows and insert the EL-WIN floppy disk into drive A or B.
Choose the Run command from the File menu in File Manager.
Type a:setup (or b:setup if your disk is in drive B) in the Run dialogue box
and click OK.
The installation program automatically creates an easylog directory on your
computer’s hard drive, drive C, and all EL-WIN files are copied to that
directory.
The installation program automatically creates a new EasyLog program
group. Within this program group an EasyLog program icon is created.
Double-click on the EasyLog program icon to start the program.
1) EasyLog datafile formats
To convert data into a format that is acceptable by another application, there are
different procedures to follow, depending on the storage mode initially chosen for the
data (Normal mode, Rolling mode, Histogram mode, One-shot mode). Choose one of three
different formats (tab, space and comma delimited).
2) Exporting data
EL-WIN displays the Connecting EasyLog dialogue box and is now ready for use. If this
is your first encounter with EL-WIN, then follow the instructions on the tear-out
Easy Guide card in the centre of this manual.
Normal and Rolling mode
Data accumulated in Normal mode and Rolling mode can be exported into a format that is
acceptable by most third party applications by using EL-WIN as the translating
medium.
- Download the data from the EasyLog module to the computer using EL-WIN by
clicking on Save data.
- Enter the graphing module by clicking on Graph data. Select the file that you want
to export and click on OK. The data in that file will be graphed.
- Select Options, Export data.
- Select the desired file formats from Tab delimited, Space delimited and Comma delimited.
- Enter a new filename for the exported data. To ensure integrity of the original
datafile, do not use the same filename as that of the original datafile.
- The new file now contains the logged data in tabular format, ready for use in your
target application. The columns in the table show Reading number, Date, Time and
one or more (multi-channel data logger) columns of Reading values.
Figure 1: The Startup screen
Histogram mode
Data accumulated in Histogram mode cannot be exported to another application using
EL-WIN. Instead, proceed as follows.
- Download the data from the EasyLog module to computer using EL-WIN by
clicking on Save data.
- Open the file containing the saved data in a spreadsheet.
- Analyse the data, using the data in Appendix A.
6
23
X axis (not available in Histogram mode)
When ticked, the X axis displays accumulative time and date,
Elapsed time :
starting from zero time and zero date.
:
When ticked, the X axis displays the time and date at which the
Clock Time
readings were taken.
c) Filtering data
In certain applications, the actual value of a reading at a given time and date is less
important than the underlying trend that is hidden in the graph. To bring out this
underlying trend and, in the process, reduce the amount of ‘noise’ on a graph, click
Options, Show the mean of and select 3, 5 or 10. A new graph is displayed, showing far
fewer fluctuations. To revert back to a normal graph, de-select the current selection.
To differentiate between true readings and filtered readings (Options, Show the mean of)
on a graph, whether on screen or on a print-out, the text “Filtered data” is added
below the graph title.
d) Histograms
Data accumulated in Histogram mode is not related to time or date. In a histogram, it is
the frequency of occurrence of a particular reading that is of importance.
A histogram is a graphical representation of grouped data. The X axis is divided into
segments with lengths proportional to each sample group interval. On these segments, rectangles are drawn with areas proportional to the numbers in the sample
group intervals. As all sample group intervals are of equal size, the heights of the
rectangles (Y-axis) are proportional to the number of occurrences.
II) Configuring the EasyLog Module
1) Choosing and connecting an appropriate sensor
Choose an appropriate sensor (dual channel EL-3-12BIT requires up to 2 sensors) for
your measurement application. If you are in doubt about the required technical
specifications for your sensor then consult the datasheet that was supplied with your
EasyLog module. If doubt persists, then contact Lascar Electronics for further
technical assistance.
Insert the 3.6V Lithium battery into the EasyLog module or connect an external
power supply. At this stage, do NOT connect a voltage across the EasyLog module’s
inputs, as the module has not yet been correctly configured to accept an input signal.
2) Connecting the EasyLog module to a computer : Communications
a) Hardware Link
Connect the EL-WIN communications cable, supplied with your EL-WIN control
software, between your computer’s 9-way COM port (RS 232 serial port at the rear of
your computer) and your EasyLog module. If your only free COM port is a 25-way
one, then you will require a 9-way to 25-way converter, available from most major
electronics distributors. If COM 1 and COM 2 are occupied on your computer (e.g.
by a mouse and an external modem), then it may be necessary to fit an I/O card
(typically featuring COM3 and COM 4 and a parallel port) to the computer. In this
case, connect your EasyLog module to COM 3.
If you are in doubt about the types of port present at the rear of your computer, then
consult your computer’s user manual.
By clicking Options, Histogram style, the following settings become available.
b) Software Link : COM port, Baud rate, Address
Y axis
Count total
Accumulated hours
% of total time
:
:
:
Sample group interval :
Displays the total amount of occurrences in a class.
Displays the total time of the occurrences in a class.
Displays the total amount of occurrences in a class as a
percentage of the total amount of occurrences of all
readings.
Choose the width of class interval (sample group
interval). (similar effect to Options, Show the mean of in
Normal mode and Rolling mode.)
22
COM port
Once you have connected your EasyLog module to your computer via the communications cable, you will be prompted by EL-WIN to select the COM port you are using.
COM 1 is the default setting in the EL-WIN software. The computer will now scan
the selected COM port for attached EasyLog modules. Any modules found on that
port will be listed in the EasyLogs connected box. For additional information on a
module, click on its entry in the EasyLogs connected box and click on Further info.
If a search fails, you will receive the General Communications Failure message. If
you get this message, then check your EasyLog system and click on Search to try
again.
7
Show warnings
Some EasyLog modules will memorise certain error conditions, encountered during
the logging process. These can later be displayed on the graph, by selecting Options,
Show warnings.
Figure 2: The General Communications Failure message
Baud rate
The Baud rate specifies the speed at which communication occurs between the
computer running EL-WIN and the attached EasyLog module(s).
In an EasyLog system, individual Baud rate settings are specified for the computer
running EL-WIN and for the EasyLog module. The factory default setting is 9600
Baud for both the EL-WIN software and the EasyLog module. In an EasyLog system,
Baud rate settings are governed by three simple rules :
- All EasyLog modules, linked together in a system, must feature the same Baud
rate setting.
- The Baud rate setting for the computer must always be identical to the Baud rate
setting of the attached EasyLog module(s).
- Always change the Baud rate of the module (Click on Setup, Comms) before
changing the Baud rate of the EL-WIN software in Connection. Changing the
module’s Baud rate will automatically change EL-WIN’s Baud rate.
In most applications, a setting of 9600 Baud works reliably. However, in applications
where long communication cables are used, or where there is a lot of electromagnetic
interference, communication errors may occur. The occurrence of these errors can be
reduced as follows :
- Remove or attenuate the source of electromagnetic interference.
- Make cable runs as short as possible.
- Use high quality, low capacitance, shielded cable.
- Lower the Baud rate settings of the EasyLog module and of the EL-WIN software.
- The first occurrence of a low battery voltage condition is indicated as a vertical line
on the graph and the letters LB. The value of any readings towards the right of this
line may be incorrect.
- The first occurrence of an interruption of the module’s power supply is indicated as
a vertical line on the graph and the letters PF. The time and date of any readings
towards the right of this line may be incorrect.
Zooming in & out
When a graph contains many readings, it becomes cluttered. In order to view the
detail in a graph, it is possible to zoom in. The factor by which you can zoom in will
depend on the amount of readings on the graph. Horizontal and vertical zooming are
possible.
To increase the zoom factor on the x-axis, click on Options, Zoom in and select a zoom
factor from the list or type in your own value between 100 and 750. An horizontal
scroll bar allows you to view different parts of the expanded graph.
To increase the zoom factor on the y-axis, drag the top y-axis label down with the left
mouse button held down. Alternatively, drag the bottom y-axis graph label up with
the right mouse button held down.
To view all the readings in a single window again, zoom out again by clicking on
Alternatively, right-double-click on the graph.
Options, Zoom out.
Graph axes
To add more meaning to a graph’s axes, they can be customised as follows.
Labels
Graph title
X-axis label
:
:
Y-axis label - A :
Y-axis label - B :
8
A name, up to 30 characters long, to appear above the graph.
A name, up to 30 characters long, to appear below the X axis.
(only available in Histogram mode)
A name, up to 30 characters long, to appear above the Y axis for
channel A. (defaults to range and annunciators)
A name, up to 30 characters long, to appear above the Y axis for
channel B. (defaults to range and annunciators)
21
2) Customising graphs
Graphs can be customised to add detail and meaning to the plotted data. To ensure
the integrity of EasyLog datafiles, the files cannot be re-saved with customised graph
settings.
a) Fonts
When incorporating EasyLog graphs into reports, it is sometimes desirable to copy
the style of that report. In EL-WIN, it is possible to customise the font, font style and
font size on your EasyLog graphs. Click on Options, Fonts and make your selections for
Graph Title, Axis Titles/Legend and Axis Labels.
Address
Each EasyLog module should be given its own unique address in the range 0 to 7.
Using unique addresses ensures that, when multiple modules are daisychained, no
two modules will respond simultaneously to an EL-WIN command and cause a
communication error to occur. To change a module’s address, click on Setup and
Comms, and select a new address in the range 0 to 7.
To check the availability of free addresses, click on Search (ensure Address Limit in
Options is set to 7). Any modules found will be listed together with their address in the
‘EasyLogs Connected’ box.
b) Adding detail to the graph
c) Options: Smart search, Search limit
Append info
Clicking on Options, Append info displays information about the downloaded data from
an EasyLog module in the bottom left hand corner of the screen.
Readings
:
:
Every
:
Sensor
The sensor type or input type used.
The amount of readings that were accumulated and which are
represented on this graph.
The sample rate.
Mark points
A graph consists of individual plot points that represent actual readings, connected
by mathematically calculated straight lines. It is important to remember that these
straight lines do not represent actual readings. In order to distinguish between actual
readings and mathematically calculated ones, click on Options, Mark points. This adds a
set of small circles to the graph, each circle indicating an actual reading. To toggle
Mark points on and off, click on Options, Mark points.
When a value in Options: Show the mean of has been enabled, the small circles indicate
the calculated means, and again it is important to remember that these do not
represent actual readings.
Alarm levels
Alarm levels are indicated on a graph by a thick line for each alarm level of each
channel. To toggle the display of the alarm levels on and off, click on Options, Alarm
levels.
20
Smart search
If, at the moment of pressing Search, the EasyLog module being addressed is taking a
reading, then it is possible that the search will fail. You will receive a communication
failure message. This is because, in general, the action of taking a reading and
logging it is more important than allowing you to interrupt what is potentially an
important logging exercise. To reduce the occurrence of search failures, select
Smartsearch in Options in the menu. This has the result of scanning twice in succession
for each module address, thus increasing the chance that a given module is free to
respond.
When searching for multiple EasyLog modules, it is possible that some of the
modules will not respond if they are currently logging. In this case, you will NOT
receive a General Communications Failure message (See Figure 4) if at least one
module was found. Selecting Smart search reduces the risk of one or more modules
not responding.
Address Limit
The EL-WIN software normally scans a COM port with a view to locating modules
with addresses between 0 and 7. If you are confident that all module addresses are at
the lower end of the scale (e.g.: addresses 0, 1, 2, 3) then you can substantially
increase the search speed by selecting Address limit in Options and typing the highest
module address that you expect to find.
Note : - Address Limit does NOT allow you to specify the amount of modules to
search for.
- Setting the Address Limit too low with high-address EasyLog modules
attached will result in no modules being found and a communications
failure message to appear.
9
3) Configuring the EasyLog module
Before using an EasyLog module in your application, the module must be configured
in software and in hardware (via solderable or jumper links) to accept the correct
sensor type(s) or input signal(s). In addition, the module must be given a name, a
sample rate and a storage mode.
Clicking near a point on the graph will result in the nearest plot point being
temporarily highlighted with a dot. That point’s value, together with the time and
date at which it was logged, are displayed at the bottom of the graph.
a) Module name
During manufacture, each EasyLog module is programmed with its own unique
serial number. This serial number cannot be changed by the user, but is ideal for
tracking modules.
To associate an EasyLog module with an application, it is possible for the user to
assign a name to the module. This name can be up to 14 characters long, and may
consist of most characters, using upper and lower case, e.g.: ‘Water Pressure’, ‘Room
Humidity’, ‘Pump-1’, etc. The chosen name is entered in the Logger name box in Setup.
Note however that a space, plus sign, equals sign, [ and ] will be truncated when the
module name is later used as the default file name when the data is saved after
logging. Unlike the serial number, the Logger name is not fixed and can be changed
when required, as long as the module is not logging and has been Reset or Cleared.
Figure 6: Graphing Data (data file from a dual channel module)
b) Overlaying multiple graphs
Up to four single channel graphs can be graphed together as an overlay of plots. For
this to be possible, the three following conditions must be adhered to.
- Logging must have started at the same time for each EasyLog module.
- Each EasyLog module must have been set up with the same sample rate.
- Each EasyLog module must have been set up for the same logging mode.
Figure 3: The Setup screen (dual channel module connected)
To overlay a graph over an existing one, click on File, Plot over and select the second,
third or fourth datafile for which you want to plot the graph. Dual channel files can
only be plotted on their own.
b) Select Channel
Multi-channel data loggers are set up and calibrated one channel at a time. The
required channel is chosen via the channel selector in the top right hand corner of the
Setup screen. The channel selector and channel name are not displayed when a single
channel data logger is being configured.
To distinguish between multiple plots, click on Options, Colours and assign a different
colour to each overlaid plot. The bottom right hand corner of the screen shows an
index of the colours used. It is important that colours are chosen in such a way that
they not only look correct on screen, but are also distinguishable as a grey scale on a
laser or inkjet printer.
10
19
VI) Graphing
After the data has been downloaded from an EasyLog module to a computer, it can be
analysed. This can be done by using EL-WIN’s built-in graphing module, or by
exporting the data to another software application (e.g.: Spreadsheet, Wordprocessor,
Database, Statistical Process Control package, etc.).
1) Graphing with EL-WIN
EL-WIN has been designed in such a way that most datalogging exercises can be
performed from beginning (Start logging) to end (Graphing of downloaded data),
without the need for third party software.
Data accumulated in Normal mode, Rolling mode and Histogram mode can be graphed using
EL-WIN’s graphing module. Data accumulated using One-shot mode cannot be graphed
in EL-WIN, this data must be processed using a spreadsheet (See Chapter VII Part
2). It is theoretically possible for data, accumulated in Normal mode, Rolling mode and
One-shot mode, to be converted into a histogram. You will require a spreadsheet to do
this. Data accumulated in Histogram mode does not contain any time or date information, it can therefore not be converted (either in EL-WIN or in another software
application) into a ‘Normal mode’ or ‘Rolling mode’ graph.
a) Viewing graphs
To view an EasyLog datafile, click on the Graph data button and select the datafile that
you wish to graph. If you gave the datafile an appropriate name during the download
procedure, then your file should be easy to identify. Once you have clicked on OK,
your datafile will be graphed. Click the maximise button in the top right hand corner
to view the graph full-screen. You will notice instantly that the following information
is automatically included on your graph:
i) for data recorded in Normal mode and Rolling mode
- The EasyLog module’s serial number is displayed in the top right hand corner.
- The graph title, up to 30 characters long, can be displayed above the graph.
- Alarm levels can be displayed as horizontal lines in the colour of the plot.
- The Y-axis is automatically scaled to display the two largest recorded values.
- The X-axis displays time and date for the whole graph.
- Any fault conditions can be displayed as red vertical lines.
ii) for data recorded in Histogram mode
- The EasyLog module’s serial number is displayed in the top right hand corner.
- The graph title, up to 30 characters long, can be displayed above the graph.
- The Y-axis is automatically scaled to display Count Total.
- The X-axis displays the measured parameter, divided into sample groups.
- Alarm levels and fault conditions are not displayed.
18
c) Sensor type
The Sensor type box allows you to configure the EasyLog module to accept a voltage
signal (Voltage, Current, Frequency, Rate count) or the output from a sensor
(Temperature, Humidity, pH, etc.). When your choice of Sensor type is downloaded
from computer to EasyLog module, the module will configure its input circuitry
accordingly. Selecting the wrong Sensor type may result in one of the following.
- The EasyLog module does not display and record expected readings.
- The EasyLog module is constantly showing overrange (‘1 ’ on display).
- The inputs to the EasyLog module may be permanently damaged.
Select the correct Sensor type in EL-WIN for each channel and configure any solder
or jumper links on the module before applying a signal or connecting a sensor to the
EasyLog module. Choosing a particular Sensor type will cause the EL-WIN software to
select an appropriate Unit in Display symbols.
d) Display symbols : Units, Scaler
The Display symbols box is divided into two sections : Units and Scaler. Before choosing
your combination of Unit and Scaler, you must check that the required symbols are
indeed available on the type of EasyLog module being used. The choice of display
symbol is automatically updated when you choose a particular Sensor type. You can
override this automatic choice by selecting a unit from the list.
e) Sample rate
The sample rate is the time interval between two successive logging procedures of an
EasyLog module, where a logging procedure consists of the following steps:
- Measuring the module’s input.
- Displaying the corresponding value.
- Storing that value in the module’s non-volatile memory.
- Activating alarm levels if these have been set.
The Sample rate can be selected from a set of ten pre-defined values. Below the set of
sample rates, the duration of a complete logging exercise is displayed. The duration
of a logging exercise depends on the Storage mode selected, as follows.
- Normal
- Rolling
- Histogram
- One-shot
Duration of logging exercise until module memory is full.
As Normal mode. Module will then overwrite oldest data.
Duration of logging exercise cannot be predicted.
Duration of logging exercise cannot be predicted.
11
f) Storage modes : Normal, Rolling, Histogram, One-shot
Data can be stored inside an EasyLog module’s non-volatile memory in one of four
different ways, depending on the Storage mode selected.
Normal mode
This is the conventional method for recording data over a period of time. In Normal
mode, readings are taken at a regular time interval, as selected in Sample rate. These
readings are related to time and date and are stored in the EasyLog module’s
non-volatile memory as a sequence of values. Logging stops and the module shuts
--down once its memory is full of readings. The module will then display either ‘ ’ or
‘FULL’ on its LCD. Data accumulated in Normal mode can be graphed in EL-WIN.
Rolling mode
Rolling mode is similar to Normal mode, in that data is recorded over a period of time. The
readings are taken at a regular time interval, as selected in Sample rate. These readings
are related to time and date and are stored in the EasyLog module’s non-volatile
memory as a sequence of values.
The main difference is that in Rolling mode, logging does not stop once the memory is
full. Instead, the oldest recorded data is overwritten with new readings. The EasyLog
module continues to log data until the user tells it to stop in EL-WIN, or until the
voltage of the module’s on-board battery has reached a very low level. Data
accumulated in Rolling mode can be graphed in EL-WIN.
Histogram mode
In Histogram mode, as in Normal mode and Rolling mode, readings are taken at a regular time
interval, as selected in Sample rate. In Histogram mode, the values of individual readings
are not related to time and date. Instead, the number of occurrences of each reading
is recorded. This means that, when compared to Normal mode or Rolling mode, many more
readings can be stored over a much longer period of time. Potentially, many millions
of readings can be stored before the module is full. Data accumulated in Histogram mode
can be graphed in EL-WIN. 12-bit loggers cannot log in histogram mode.
5) Time and date
Because the computer’s internal time and date are downloaded to the module when
Start log is selected, it is important for you to check that your computer’s system time
and system date are correct before you start a logging exercise. The current system
time and system date are automatically shown in the Start Options box.
IV) Stop logging
Once sufficient data has been accumulated, the EasyLog module as a whole can be
told to stop logging. To stop a datalogging exercise, click the Stop log button. Before
EL-WIN tells the EasyLog module to stop logging, you will be asked for confirmation that you do indeed want to stop logging. This important safety measure has been
included because, once a logging exercise has been terminated, it cannot be restarted.
V) Downloading data from EasyLog module to computer
Once a datalogging exercise has been terminated, the stored data can be downloaded
to computer for analysis.
To download data from an EasyLog module to your computer, click on Save Data. A
window opens, allowing you to specify a directory and filename (in 8.3 character file
format) for the downloaded data. The selection of an appropriate filename will ensure
that the desired file can be easily identified at a later date.
One-shot mode
Whereas in Normal mode, Rolling mode and Histogram mode, readings are taken at a regular
time interval, in One-shot mode, a reading is only taken and stored in the EasyLog
module’s non-volatile memory when the one-shot button is pressed. Each reading is
stored together with the time and date at which the button was pressed. This means
that, in One-shot mode, far fewer readings can be stored than in Normal mode or Rolling
mode. Logging stops once the module’s memory is full of readings. The module will
--then display either ‘ ’ or ‘FULL’ on its LCD. Because, in One-shot mode, readings are
not taken at regular time intervals, they cannot be graphed in EL-WIN. Instead,
export this data to a spreadsheet (see Graphing) for further processing.
12
17
Immediate start
By far the easiest method to start logging is achieved by clicking on Start log and then
on OK. The EasyLog module will then start logging immediately. When an EasyLog
module has been configured to log in Histogram mode, the action of clicking on Start
log and then on OK will not cause the module to start immediately. Instead, there is a
20 second delay, during which the module is being set up for Histogram mode.
Push to start
Some applications require that an EasyLog module is primed and ready to start at the
push of a button, without the need for a computer. This may be the case, for example,
if you want to configure the EasyLog module in the office or laboratory, but only
want to start logging when you are at the location where you want to accumulate
data, maybe a shop floor or a storage area. To select Push to start mode, click on Start
log, tick the Push to start box in the Start Options window and click on OK.
Once the EasyLog module has started logging, the push button takes on its secondary
function. It effectively becomes a Push to read button. When in Push to read mode, every
push of the button updates the reading on the display, but does not log that reading,
nor does it indicate the exceeding of an alarm level. Push to read is especially useful
with long sample rates, where you may want to update the display without affecting
the logging cycle.
Show active
When an EasyLog module is configured with a long Sample rate, the time interval
between consecutive display updates will be relatively long. To indicate visually that
the module is fully operational, click on Start log and tick the Show active box prior to
Starting the module.
Note: The setting of Show active may introduce inaccuracies in the EasyLog
module’s sample rate. While the majority of applications are mostly unaffected by
these inaccuracies, time-critical applications should have Show active switched off.
g) Set alarms
EasyLog modules can be programmed to give a visual indication when the reading
exceeds one of two pre-programmed alarm levels.
In addition, the status of these alarm levels has been made available on EasyLog
modules via 2 output pins per channel, one pin for each alarm level. These pins can
be connected to external electronic circuitry to turn the EasyLog module into a
comprehensive measurement, logging and control system. For further information on
the pin-out, consult the EasyLog module’s datasheet.
Alarm levels are by default switched off, but can be set by ticking the Set alarms box.
This activates the two alarm level boxes, allowing you to enter a Low alarm and a
High alarm value.
It is not possible to enter two identical alarm levels or to enter only one alarm level.
If only one alarm level is required, then enter the other as an end-of-scale value in
such a way that it is opposite to the only required alarm level.
Note: The setting of alarm levels may introduce inaccuracies in the EasyLog
module’s sample rate. While the majority of applications are mostly unaffected by
these inaccuracies, time-critical applications should have the alarms switched off.
h) Calibrating the EasyLog module
Once an EasyLog module has been configured, each of its channels needs to be
calibrated. The calibration process ensures that any errors, introduced by connecting
a sensor to an EasyLog module, are reduced. On multi-channel modules, calibration
is performed per channel selected in Setup.
Click on Calibrate to open the calibration window. This offers you a choice of two
calibration methods : Default calibration and User calibration.
Delayed start
Delayed start is ideal for those applications that require an EasyLog module to be
primed and ready to start at a pre-defined time and date in the future, without the
need for a computer. As there is no ‘group start’ command in EL-WIN, Delayed start
will ensure that multiple EasyLog modules start logging at the same time.
To select Delayed start mode, click on Start log and tick the Delayed start box. This will
cause the Time and Date boxes to show the current time and date, as defined by your
computer’s clock. If the time and/or date are incorrect, then you must correct these in
your computer’s set-up before proceeding.
Figure 4: The Calibration screen
16
13
Default calibration
Default calibration uses factory calibration settings, and can be used for the ranges,
depending on the module used: Temperature, Voltage (0 to 200mV, 0 to 2V and 0 to
20V) and Current (4-20mA and 0 to 2A).
Note : Humidity (%RH) and pH can only be calibrated in User calibration.
Rate count and Frequency cannot be calibrated by the user.
j) Clear/stop log
Before an EasyLog module can be used for a new datalogging exercise, any old stored
readings must be erased. This is done by clicking on Clear/stop log in the Setup window.
Although all old readings are erased, the module’s configuration parameters (Logger
name, Sensor type, Display symbols, Sample rate, Storage mode and Alarms) and calibration
parameters remain unchanged. If the EasyLog module is logging when Clear/stop log is
clicked, then a warning message appears to indicate that the logger will be stopped
and any data will be cleared. Clicking on OK will then stop the logging process and
erase all the stored readings off all channels.
User calibration
i)
ii)
Select the channel to calibrate (only valid on multi-channel data loggers)
Apply a known input to the EasyLog module.
- If you are using a sensor, then subject the sensor (Temperature, Humidity, pH, etc.)
to a known condition.
- If you are measuring Voltage or Current, then apply a known voltage or current.
- If you are measuring Frequency, then apply a known frequency.
iii) Enter the value you would like to display on the EasyLog module for the input
you have applied.
iv)
Click on Set level 1.
v)
Apply a second known input to the EasyLog module.
vi)
Enter the value you would like to display on the EasyLog module for the input
you have applied.
vii) Click on Set level 2.
viii) Click on OK to download the calibration settings to the EasyLog module.
Repeat this procedure on other channels if you are using a multi-channel module.
i) Comms: Address, Baud rate
Each attached EasyLog module must be set up with a Baud rate (default is 9600) and
its own unique address in the range 0 to 7 (default is 0).
If the Baud rate for EL-WIN does not match that of the module, then the module will
fail to respond to a Search command and you may receive the General Communications Failure message. Select the correct Data rate in Connection and search twice in
succession. The first search will reset the module’s communications section, the
second search will be successful.
k) Reset
To reset an EasyLog module’s configuration parameters (Module name, Sensor type,
Display symbols, Sample rate, Storage mode and Alarms) as well as the calibration settings to
factory defaults and erase any stored readings, click on Reset in the Setup window. If
the EasyLog module is logging when Reset is clicked, then a warning message appears
to indicate that the EasyLog will be stopped and reset to factory defaults and that any
data will be lost. Clicking on OK will then stop the logging process and reset the
module. All alarm settings will be lost. The module will revert to default calibration.
l) Multi-mimic
To view ‘live’ readings from all connected EasyLog modules and their channels on
your computer screen, click on Multi-mimic in the main window. To use this feature, the
EasyLog modules must not be logging.
III) Start logging
Once an EasyLog module has been configured and calibrated, it can start logging.
Three starting modes apply to the module as a whole: Immediate start, Push to start
and Delayed start. In each of these starting modes, an activity symbol can be
displayed to show that the module is active. Once configured for one of the starting
modes, the EasyLog module(s) may be disconnected from the computer.
To alter a module’s Baud rate, first establish a connection by clicking Search, then
select the desired Baud setting in Setup:Comms. This will automatically update ELWIN’s Baud rate setting. By keeping the Baud rate setting at 9600 for module and
EL-WIN, mismatches are avoided.
Figure 5: The Start Options screen
14
15