1
ADAS810: Generate envelope feature photon
emissivity coefficient
The program calculates envelope feature emissivities of type ADF40 for an ion of a complex element.
The program is a foreground, interactive, version of the mass production, parallised background code
ADAS810_offline. The interactive version is designed for small sample testing and test result
production prior to large scale execution. It can use the same driver data file type (ADF42) as the
offline version, but allows the user to modify some driver parameters. ADAS810 includes the full
population, emissivity and radiated power calculation functionality of ADAS208.
Background theory:
)B3(&
An envelope feature photon emissivity coefficient, denoted by
, is defined on a wavelength
interval and is a composite feature arising from very many lines from a single ionisation stage. The
is suitable as a descriptor in wavelength intervals and at spectral resolutions where the
individual component lines are unresolved or only partly resolved. This situation occurs with very
complex heavy element ions for which it becomes helpful and economical to handle the envelope
s). Following Chap 3.8, the
feature rather than the individual line emissivity coefficients (
emissivity of an individual line is specified as
)B3(&
3(&
M
ε j →k = A j →k ( ∑)
σ =1
( exc )
jσ
N e Nσ +
M z +1
∑)
υ ′=1
( rec )
jυ ′
N e N υ+′ ) .
9.10.1
This allows specification of the excitation photon emissivity coefficient
3(&σ(,excj→)k
= A j →k ) jσ( exc )
9.10.2
and the recombination photon emissivity coefficient
3(&υ(′,recj→) k
)
= A j →k )jυ( rec
.
′
9.10.3
There are similar coefficients, namely, the charge exchange photon emissivity coefficient and the
ionisation photon emissivity coefficient, which are of less relevance here. Each of these coefficients is
+z
+ z +1
ions respectively.
associated with a particular metastable σ or υ′ of the X , or X
Consider
a
spectral
[ λ 0 , λ1 ] ,
interval,
subdivided
into
N pix
intervals
as
{ ∆λ [i 0 ,1 ] ≡ [ λ 0 + i( λ1 − λ 0 ) / N pix , λ 0 + ( i + 1 )( λ1 − λ 0 ) / N pix ] : i = 0,.., N pix − 1 } Also
suppose that the j → k spectrum line has a normalised emission profile
ϕ j →k ( λ ) . In general, such
a profile is a convolution of Doppler and instrumental functions. Then the envelope feature photon
emissivity coefficient vector is defined as
)B3(&
( exc )[ 0 ,1 ]
σ ,i
=
λi +1
∑ 3(&
( exc )
σ , j →k
∫ϕ
j →k
( λ )dλ
9.10.4
λi
j ,k
λ j → k ∈[ 0 ,1 ]
λ j→k is the natural wavelength of the j → k spectrum line. The default broadening assumed is
Doppler with a Maxwellian distribution for the emitting ion at temperature, Tion , equal to the electron
3(&
temperature, Te , used in the collisional–radiative modelling of the
s. This consitutes a
minimum broadening. The integral in equation 9.10.4 is then expressible in terms of error functions as
)[ 0 ,1 ]
)B3(&σ( ,exc
i
=
∑ 3(&
( exc ) 1
σ , j →k 2
{ erfc(( λ i − λ j →k ) / σ )
j ,k
λ j → k ∈∆λ[i 0 ,1 ]
9.10.5
− erfc(( λ i +1 − λ j →k ) / σ )}
kTion m p me
⋅
⋅
where σ = λ j → kα
I
m
m
X
p
H
ADAS User manual
1/ 2
and m X is the emitting ion mass.
Chap9-10
17 March 2003
In actual spectral analysis involving complex heavy species, individual strong spectrum lines may be
distinguishable from the envelope. It is therefore appropriate to archive a restricted number of the
s and these can be identified and ordered as processing for the
s
strongest individual
takes place. Again, while passing through the complete set of radiative transitions for assignment to
3(&
)B3(&
)B3(& ( exc )
(z)
s , the line radiative power coefficient for the ion, PLT , can be totalled. This
excitation
), which is the part
total line power coefficient (archived in the data class ADF11, subcategory
driven by excitation for the ground or metastable levels of the ion, is a more precise estimate that than
computed by the code ADAS408 and so is a preferred substitute for that data. For application to actual
3/7
(z)
measurements of total radiation emission, it is normally necessary to calculate PLT as modified by
appropriate soft x-ray and /or bolometer filter transmission functions. Such modification can not be
)B3(& ( exc )
(z)
is suited to further
done retrospectively on the unfiltered PLT . In contrast, the
processing which can include imposition of spectrometer instrument functions as well as filtering and
s are treated as
integration over extended wavelength regions. Such additional operations on
separate from ADAS810 will be handled by a new code for. Note that preparation of filters is provided
by the codes ADAS414 and ADAS415. It is also assumed that this is the route for preparation of
)B3(&
(z)
higher precision filtered PLT s and requires the initial creation of appropriate
present ADAS810 code.
)B3(& s via the
3(& ( rec ) s can be produced, provided the input data (ADF04) supports this. Note that
( exc )
for ease and consistency in modelling, the same spectral intervals apply to both the )B3(&
s and
( rec )
the 3(&
s and to each of the metastable drivers – if more than one. Also, the selection of the
strong individual 3(& s is determined from the whole ground excitation driven set and the selected
In like manner,
set is then used for all other metastable drivers and for recombination. The rank ordering of individual
s is from the maximum of each
viewed as a tabular function of Te and N e .
3(&
3(&
Note finally that
)B3(& s are tabulated as a function of selected wavelength range, wavelength
interval bin, Te and N e with Ti = Te .
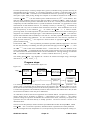
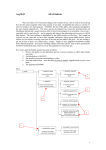
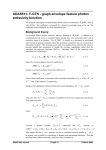
Program steps:
These are summarised in figure 9.10.
Figure 9.10
select
adf32_p810
driver for an
ion
>
Choose Te/Ne
& wavelength
ranges or alter
defaults
>
Select output
files for f_pec,
pec & PLToutput
>
Read adf04
specific ion
file
<
begin >
Output text
and data files
Calculate f_pec,
pec & PLT
<
end
<
Calculate
population
structure
)B3(&
It is noted again that the code is designed to allow single ion testing of
production. The
primary intent is nonetheless mass production and so the interactive code ADAS810 makes use of the
driver data sets and file naming conventions of the mass production codes. As ADAS810 is in essence
a variant of the population code ADAS208, instead of direct selection of an ADF42 driver file, the data
set selected on the INPUT screen may be an ADF04 file.
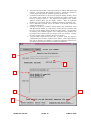
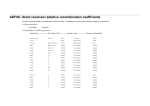
As noted above, the driver files for this application are of format ADF42. The planned organisation in
central ADAS will be according to pathways /…/adas/adf42/iso_nucl/<element>/. The primary
parameter settings for operation of ADAS810 are contained in the driver, which may be copied to the
equivalent user area and edited directly to modify operation. The driver structure is shown in the
illustration below.
3/7 3(&
,
Note the various file pathways which include the input ADF04 file and then the output
and
files. In interactive operation, ADAS810 allows re-specification of some parameters
such as wavelength intervals, temperatures etc. (on the processing screen and of output file routing (on
)B3(&
ADAS User manual
Chap9-10
17 March 2003
the output screen) ) over-riding the adf42 driver file. All other parameters are predetermined or set in
the driver file. Note the use of namelists where possible in the driver file structure
&FILES
dsn04
dsn18
dsn35
dsn15
dsn40
dsn11
dsn11f
&END
=
=
=
=
=
=
=
'/home/adas/adas/adf04/adas#6/mom97_ls#c2.dat',
'NULL',
'NULL',
'test_adf15_pec.dat',
'test_adf40_fpec.dat',
'test_adf11_plt.dat',
'test_adf11_plt_filter.dat'
&ION
element
z0
z1
ip
&END
=
=
=
=
'C',
6,
2,
386241.0
&META
lnorm
= .TRUE.,
nmet
= 1,
imetr(1) = 1
&END
&PROCESS
liosel
lhsel
lrsel
lisel
lnsel
lpsel
zeff
&END
&OUTPUT
lmetr
ltscl
ldscl
lbrdi
numte
numtion
numth
numdens
numdion
numwvl
&END
=
=
=
=
=
=
=
.FALSE.,
.FALSE.,
.FALSE.,
.FALSE.,
.FALSE.,
.FALSE.,
0.0
=
=
=
=
=
=
=
=
=
=
.FALSE.,
.FALSE.,
.FALSE.,
.FALSE.,
5,
0,
0,
5,
0,
3
1.800e+04 4.500e+04 9.000e+04 1.800e+05 4.500e+05
1.000E+11 1.000E+12 1.000E+13 1.000E+14 1.000E+15
64 1.500e+00 3.00e+00
32 1.000e+01 1.00e+02
32 4.500e+02 8.00e+02
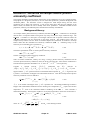
Interactive parameter comments:
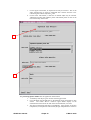
The file selection window is as shown below
1. A primary file, either an adf04 for the ion whose spectral line and envelope
emissivities are required, or a driver file of format adf42 is required. The
driver file route maintains compatibility of operation of the interactive
ADAS810 with the automatic offline mass production codes. Data from the
driver file fills the editable fields in on the following Processing window.
With an ADF04 file selected, these fields must be edited in.
ADAS User manual
Chap9-10
17 March 2003
2.
3.
4.
5.
6.
Note that each type of data is stored according to its ADAS data format (adf
number). Your personal data should be held in a similar file structure to
central ADAS, but with your identifier replacing the first adas.
Available sub-directories are shown in the large file display window. Scroll
bars appear if the number of entries exceed the file display window size
Click on a name to select it. The selected name appears in the smaller
selection window above the file display window. Then the individual
datafiles are presented for selection. Datafiles all have the termination .dat.
Once a data file is selected, the set of buttons at the bottom of the main
window become active.
Clicking on the Browse Comments button displays any information stored
with the selected datafile. It is important to use this facility to find out what
has gone into the dataset and the attribution of the dataset. The possibility
of browsing the comments appears in the subsequent main window also.
Clicking the Done button moves you forward to the next window. Clicking
the Cancel button takes you back to the previous window.
An extra button, Expansion and filter files, is present. Click it to pop-up a
supplementary file selection window shown below. These supplementary
files may be included, if available, to extend the population and emissivity
calculation, paralleling the selections available in ADAS208.
1
2
3
4
6
5
ADAS User manual
Chap9-10
17 March 2003
7.
8.
On the upper sub-window, an expansion file may be selected. This is the
same expansion file as used by ADAS208 and is drawn from the crossreferencing file subclass adf18/a17_p208.
On the lower sub-window, a filter file of format adf35 may be selected.
ADAS810 provides total radiative power and filtered power as well as the
line and envelope emisisvities.
7
7
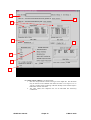
The processing options window has the appearance shown below:
1. An arbitrary title may be given for the case being processed.
2. For information the full pathways to the datasets being processsed are also
shown. The button Browse comments again allows display of the
information field section at the foot of the selected dataset, if it exists.
3. The main inputs follow that those of ADAS208. Your settings of electron
temperature, ion temperature and neutral hydrogen temperature are shown in
ADAS User manual
Chap9-10
17 March 2003
4.
the temperature display window. The temperature values at which the
excitation rate coefficients (in fact ‘upsilons’) are stored in the selected
adf04 (input) are also shown for information. The program obtains the
output from the adf42 driver file if available. A similar pattern is shown in
the Density sub-window although there is no ‘Input’ from the adf04 file.
Selection of Default temperatures is somewhat different from the usual
ADAS pattern. A drop-down menu allows choice from a number of
favoured sets, such as the GCR Standard set. Personal preferred sets are
allowed. These should be stored in your /…/<uid>/adas/defaults/ directory
as adas810_te.dat (for temperature defaults) and adas810_dens.dat (for
density defaults). Samples are illustrated below.
2
--------Low Te set
11
ev
1.0
2.0
3.0
5.0
7.0
10.0
20.0
30.0
50.0
70.0
100.0
---------Another set
4
K
500.0
1000.0
4000.0
8000.0
2
--------Low Ne set
4
cm-3
1.0e11
2.0e11
3.0e11
4.0e11
---------Another set
4
cm-3
1.0e12
2.0e12
3.0e12
4.0e12
5.
6.
7.
8.
ADAS User manual
Selection of metastables is done from a scrollable button list rather than a
pop-up.
Wavelength ranges and associated pixels are specified in an editable table.
The set of control parameters for the calculation follows ADAS208.
The Normalisation option should be chosen when there is only a single
metastable..
Chap9-10
17 March 2003
1
2
3
4
6
5
7
8
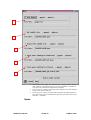
The output options window is as shown below
1. The Text Output button activates writing to a text output file. The file name
may be entered in the editable File name box when Text Output is on. A
‘pop-up’ window issues a warning if the file already exists and the Replace
button has not been activated.
2. The PEC (adf15) file comprises the set of individual line emissivity
coefficients.
ADAS User manual
Chap9-10
17 March 2003
1
2
3
4
5
. 3
3.
4.
5.
The Feature PEC (adf40) file comprises the envelope feature data for
each selected wavelength interval and each metastable, tabulated in
pixel space as a function of temperature and density .
The Total power (adf11/plt) unfiltered file comprises the total radiated
power in the spectral intervals.
The Total power (adf11/plt) filtered file comprises the radiated power in
the spectral intervals as transmitted by the filter specified in the input
filter file – if selected.
Notes:
ADAS User manual
Chap9-10
17 March 2003