1
Feb18-03
ADAS Bulletin
I must firstly apologise for the delay in this release. As you will recall, we held the intensive fourweek ‘Winter School’ on ADAS and Atomic Calculations at Strathclyde University from 18 Nov. – 13
Dec. This had the two effects of giving us a large number of corrections to implement in ADAS codes
and running me into my heavy examining amd marking schedule. The Winter School was
nonetheless very beneficial since it was the most concentrated examination of the ADAS package we
have ever had.
I had hoped to go with a comprehensive release of all the heavy species handling codes
together some little time ago. However, these codes are pretty complicated and are taking a long time
to verify, adjust and get working compatibly. Handling heavy species means revising upwards
virtually all decisions made many years ago – maximum angular momenta, fields allocated to
statistical weights, lengths of configuration strings, translation tables etc. etc. But we are nearly there
now and I feel it is best to release some of them now as ‘beta’ versions so that we get them under more
general test. Also, we have already introduced some of the codes to participants at the Winter School,
who wish to continue working with them immediately. So this time, we have included ADAS510 for
interrogating and displaying envelope feature emissivity coefficients, ADAS808 for previewing
complex species spectral emission in selected spectral intervals and setting up appropriate driver data
sets for off-line execution and ADAS810 for calculating feature emissivity coefficients. First versions
of two other utilities in series 8 are also included, namely, ADAS804 for simple effective potential
Born omega and Upsilon calculation, ADAS809 for conversion of an adf04-type 1 file to an adf04type 3 file. We shall upgrade ADAS809 in the near future to full non-Maxwellian handling.
You will be aware of the gradual shift in the ADAS Project to making available some of our
fundamental atomic structure and collision calculation capability. Parts of this are suitable for
interactive ADAS (see series 7 and 8) but main calculations need to be done off-line on powerful
machines. With the introduction of heavy species modelling to ADAS, the link to off-line calculation
becomes essential and we are trying to make this as smooth as possible. Working with off-line
structure and collision codes was one of the themes of the Winter School. I have made the complete
set of lecture notes, presentations and tutorial exercises available in the ADAS documentation release
(see /…/adas/docs/adas-and-atomic-calculations-course/* . I would recommend however that those
who wish to use the off-lines codes should try to come to at least to the second part of the Winter
School (next occasion Nov 2003) at some stage. Working on a specific example with the experts is
worth a lot of words.
You will notice (amongst many others) two new ADAS data formats, adf38 and adf39.
These are for photo-excitation and photo-ionisation cross-sections and reflect on-going work of Nigel
Badnell and Mike Seaton. This extends and revises some bits of the Opacity Project. I hope this will
lead onto a capability for handling photo-ionised plasmas in ADAS sometime in the future. For the
moment, the specifications of ad38 and adf39 have been added to the IDL-ADAS User Manual
(appxa-38.pdf, appxa-39.pdf).
A final word concerning the ADAS User Manual. It has of course become very large and
needs frequent updating, especially when new codes are being brought on stream and the ADAS data
formats are being extended to cope with new situtations. I have therefore decided to align the manual
version with the ADAS release and enter chapters on new codes in it as they are released. This means
that the up-to-date manual is really the computer version (in the /docs/ directory or accessible via
http://adas/phys.strath.ac.uk). Also, the manual is now more of a ‘road map’. That is it includes
entries for codes which we have working in preliminary version, but have not yet had the time to
bring-up fully into IDL-ADAS, and data formats which are now necessary, but have not been filled
yet with significant amounts of central ADAS data yet.
Corrections and additions to codes (ADAS v2.5.6 to ADAS v2.6)
C.1
There are problems in using ADAS811 particularly on true 64 bit (DEC/Compag/HP)
machines. It arises when making call_external IDL routines just using fortran. This was tried
with r8necip.for as no string passing was involved. However it proved necessary to introduce
C glue code.
1
*** Removed r8necip_if.for and replaced with r8necip_calc.for and r8necip_if.c.
C.2
There are some further issues with ADAS211. The recombining ion charge (iz1) is calculated
from the atomic number and isoelectronic sequence. However the test to find the number of
electrons in the isoelectronic was case sensitive. Unfortunately ADAS807 produced adf08 files
with mixed case. Rather than failing, unfortunately ADAS211 calculated silly quantum defects
and defaulted to hydrogenic values. The fix is to do the test having converted to an upper case
sequence string. We are attempting to put active string conversion into all codes at key places.
Note the conversion subroutine xxcase.for in /…/fortran/adaslib.
C.3
The adf08 files produced automatically by ADAS807 caused more than just the problem of C.2.
In the Li-like case the level configuration strings dropped the full 1s2 shell. The parsing
routine in ADAS211 (bbprs3.for) did not cope very well. As it does not know the number of
electrons, full shells below the currently open one are assumed filled. Therefore 4p1 was taken
as 1s2 2s2 2p6 3s3 3p6 3d10 4p1. At least this time nothing was produced so the problem could
be traced. The 'solution' is to modify ADAS807 to put in the 1s2 for the Li-like sequence.
Yet another problem is with the seq string. It looks human readable but is fixed format. IDL
writes single character sequences as ' C' via A2 format. However this is incorrectly interpreted
in adas211.for. We have changed prop_adf08.pro to write out 'C '.
Closed shells becomes a bigger issue for heavy complex ions – which is the trend of our
development at the moment. The configuration field in the standard adf04 file format is
insufficiently long to put the complete configuration for a heavy ion, nor is it helpful for most
purposes to see the occupancies of inactive inner shells. We have more advanced versions of
the configuration handling, parsing, detection & conversion between forms (Eissner and
Standard) subroutines. These include xxpars.for, xxprs1.for, xxprs3.for, xxcftr.for, xxdtes.for
and so on. These will deal with arbitrarily complex systems and verify inner shell (undeclared)
occupancy by examing the ground state configuration of the ion in the adf00 look-up tables.
We are introducing them into the ADAS releases as and when we have checked through all
their dependencies.
C.4
A missing utility subroutine for ADAS811 has been added to the IDL library - i4indf.pro. This
is a complement to the fortran i4indf.for subroutine, but in this case, since it is simple, a
version has written directly in IDL.
Some new functionality has also added. A 'Print All' button, which prints all transitions (of a
single type) to a file, is included. Also a new information field, which gives the value of x,y (in
data units) under the cursor on the graph, is provided.
Ambiguities in labelling on the file selection screen have been fixed. Thus ‘Browse’ is
replaced by ‘Select’ for choosing files. Another IDL 5.5 array/scalar problem has been fixed.
This was a most tiresome alteration in IDL5.5 which has caused a lot of extra work.
Note incidintally that ADAS801 can also handle the special case of H-like configurations which are labelled n=2 etc (that is with the bundling notation) in the light ion GCR Project.
C.5
A subtle logic flaw in read_adf04.pro has been picked up. When overwriting ionisation rate
data from S lines, the level and parent indices were occasionally incorrect.
C.6
Some of the files produced by ADAS204 are obsolete, in particular the adf10 files. These
should now be generated using ADAS208. Some other formatted output files are also not
necessary. The output screen has been remodelled into necessary and optional sections. The
only mandatory one, required to run, are adas204_adf17.pass and/or paper.txt. The others are
optional. Note that paper.txt has re-instated - in the previous IDL-ADAS version, printing to it
was suppressed.
2
Further changes affect both the fortran and IDL. More logic variables have been added to
adas204.for and the method of specifing a passdir, which was used to construct the output file
names, has been replaced. Now an array of names is passed in together with an array
indicating whether output is required or not.
b4spf1.pro is no longer necessary as its functionality has been replaced by an updated
adas204_out.pro. This output widget does not require the cw_adas204_out compound widget.
*** Removed b4spf1.pro and cw_adas204_out.pro.
C.7
Yet another missed IDL 5.5 array/scalar problem in ADAS402 has been fixed. Also the
polynomial fit tolerance query in cw_adas402_proc.pro has been fixed.
C.8
There was a logic flaw when cycling between range boxes in explicit scaling of output graphs if no z range is present, then pressing <return> in y-max caused a crash as the program tries to
give input focus to z-min. This bug affects all widgets which use cw_adas_ranges.
C.9
ADAS209 did not include bundling of S-lines. This has proved necessary for H-like lithium.
The approach taken is to calculate the rates from the data in the adf04 file and then take the
statistical sum of rates. This sum is then divided by the new, bundled, exponential factor in
order to generate valid adf04 S-lines. Also we have added the name of producer to the output
(bundled) adf04 file automatically via xxname.for subroutine.
C.10 There is an odd problem with adas_in_v2.pro for IDLv5.4 on DEC machines. It looks like the
array of one vs. scalar problem and has the same solution, but it appears to be specific to this
version/machine combination. Adding a [0] is harmless to other machines, so we have done so.
C.11 A problem appeared in ADAS703 which failed to produce ordinary dipole transitions between
doubly excited states. The program relied on parsing AUTOSTRUCTURE output.
Unfortunately, the output formatting changed significantly between v16.5 and 16.10 9 - the
current ADAS version). We have to apologise about a failure in our own group’s internal
communication system.
C.12 A new read_adf00.pro routine has been prepared to retrieve data from the adf00 reference
atomic data files, that is ionisation potentials and ground configurations of the ionis of all
elements.
C.13 We have made many changes to ADAS801 as we tested it to destruction at the Winter School.
These are all to do with learning tocope with very heavy species. The main changes are:
- Algorithm deficiency in rcg which did not properly allocate unlabeled levels among the
multiply labeled ones. This shows up in particular in highly mixed ions.
- Purity of levels is now written to IC adf04 file.
- Indication in comment section whether a level (or a term within a level) has been relabeled in rcg (sprnadd.for).
- Ionisation potentials can now be retrieved from the central ADAS adf00 collection.
Typing in the correct value is still possible.
- Type 1 adf04 files can now be written directly by ADAS801.
- To accommodate adf04 files with large level and transition lists the output format of the
transition indices and Upsilons is now adjusted according to the number of levels. This
fits in with the new flexible adf04 reading codes. The new complete general purpose
adf04 reading subroutine is xxdata_04.for and it resides in the highest level
/…/fortran/adaslib sub-directory.
- paper.txt now holds a record of the temporary files used in the calculation.
C.14 Dimension updates have been made in ADAS201, ADAS205 and ADAS207 so as to cope with
xenon. This meant that xxminv.for also had to be re-dimensioned.
3
C.15. ADAS403 did not work correctly on SUN hardware. The IDL spawn command requires the
/sh parameter in that case. The addition has no effect on other operating systems.
C.16. ADAS207 had a problem with the neutral density and recombining fractional abundance ratios
(the vectors ratha and ratia). These can change in size between runs but the size stored in the
defaults file was fixed. Their values are not stored but the structure assignment in IDL does not
allow for re-dimensioning of vectors or arrays.
C.17. ADAS402 had a lingering IDL v5.5 ‘array of one’ bug. A more serious problem was a peculiar
logic flaw when using the search button – the central year was not searched for if a default year
was present. This has been corrected.
C.18. The IDL version of the xxdtes routinewas machine specific. This arose by trying to pass
FORTRAN logicals, through C to IDL. A more robust way is to pass integers, but this requires
an interfacing FORTRAN program. Keeping with convention, this is called xxdtes_calc.for
and is stored in wrapper/adaslib along with the xxdtes_if.c code.
C.19. In ADAS807, the passing files (and internal naming of variables and routines) for the mapping
of adf09 files onto the adf04 levels hada name reversal. Rather than a09_a04 which reflects
the adf18/a09_a04 convention, a04_a09 was used. This has been altered.
C.20. There was an incorrectly named external function declaration in the xxcftr interface code,
xxcftr_if.c. This could have caused problems on some versions of UNIX.
C.21. ADAS312 would process adf26 files for beam emission, but not beam stopping. This was due
to a faulty design which applied an error flag for unavailable transition information in beam
emission to the beam stopping case also. This has been corrected.
It was convenient at the same time to tidy up the comments at the end of the adf21/adf22
output files and change the default pass file name to adas312_out.pass (from default.txt).
ADAS312 has an unfortunate way of determining species and donor information which are
used purely for information on the precessing screen. The adf26 input filename is parsed for
this information which effectively restricts it to central ADAS data or correctly named user
data. A trap has been inserted to se whether the input file conforms to this pattern and if not, a
message is displayed rather than random looking strings as at present.
C.22. ADAS801. A fault has been corrected in the translation of the configuration representation of
Cowan to that of Eissner by the subroutine eissner.for. The problem arose with occupation
numbers greater than 9 and gave incorrect configuration strings in the output adf04 file.
C.23 Extensions have been made to several subroutines in /../adas/idl_adas/fortran/adaslib/ to allow
us to handle very heavy species. These routines are cstrgrp.for, ceigrp.for, i4eiss.for,
i4jgrp.for, i4lgrp.for, i4ndec.for, i4ngrp.for, i4pgrp.for, i4schr.for, xxcftr.for and xxdtes.for. It
is only the latter two which might have some impact. xxdtes.for is a substantial extension. It
does require the other revised subroutines. Please let us know if you have any unexpected stops
from xxcftr.for or xxdtes.for.
C.24 ADAS407. The subroutine d7auts.for checks that the number of entries in the orbital energy
list of an adf04 files equals the number of orbitals identified in the configuration lists of the
file. For heavy species with empty inner shells, this is overstringent and can cause unnecessary
program termination. It is sufficient for the identified orbitals to be a subset.
Corrections and updates to data (ADAS v2.5.6 to ADAS v2.6)
4
D.1
Manuel Bautista's adf09/27/28 have been changed again. Some files may remain the same but
the entire directories have been updated from his files. Twice before release - latest update Jan
2003.
adf09/mb00#he/*
adf27/helike/mb00#he/*
adf28/helike/mb00#he/*
D.2
New Li-like adf04 data for Ar and Fe from Allan. The reference is A D Whiteford et al, J Phys
B 35 3729-3740 (2002).
adf04/lilike/lilike_adw02#ar15.dat
adf04/lilike/lilike_adw02#fe23.dat
D.3
PECs and SXBs from relatively high n in the hydrogen like low Z elements have been added.
These are generated with the off-line v2bndl code. Datasets for He were added in the 2.5.6
release but Carbon was omitted. These have now been added to the adf13/adf15 96 directories
with the bnd extension.
adf13/sxb96#c/sxb96#c_bnd#c5.dat
adf15/pec96#c/pec96#c_bnd#c5.dat
D.4
Lithium has been added from the GCR Project. Many files are required adf03/4/7/8/10/11/13/15/17/18/25 - approximately 10Mb of data in total.
- New fundamental data for excitation from Connor and Don Griffin, with ionisation from
the Auburn group - Stuart and Mitch Pindzola.
- The DR data came from the DR project from Nigel.
- All other data and manipulation from ADAS.
- GCR adf11 sets for ionisation, recombination and power have the year/token/designation
96 in keeping with the other light elements.
- A baseline 89 dataset has also been included which adds CX recombination and power
and a specific line power dataset for compatability.
adf03/atompars/atompars_mm#li.dat
adf04/adas#3/cpb02_ls#li0.dat
adf04/adas#3/cpb02_ls#li1.dat
adf04/adas#3/cpb02_ls#li2.dat
adf04/adas#3/cpb02_n#li2.dat
adf04/copmm#3/ls#li0.dat
adf04/copmm#3/ls#li1.dat
adf04/copmm#3/ls#li2.dat
adf04/copmm#3/ls#li3.dat
adf04/lilike/lilike_cpb02#li0.dat
adf04/helike/helike_cpb02#li1.dat
adf04/hlike/hlike_cpb02#li2.dat
adf07/szd02#li/szd02#li_li2.dat
adf07/szd02#li/szd02#li_li1.dat
adf07/szd02#li/szd02#li_li0.dat
adf08/rrc98#h/rrc98#h_li2.dat
adf08/rrc98##/rrc98##_li3.dat
adf08/rrc98#he/rrc98#he_li1.dat
adf10/acd96/pj#acd96_h11.dat
adf10/acd96/pj#acd96_he11.dat
adf10/acd96/pj#acd96_he12.dat
adf10/acd96/pj#acd96_li11.dat
5
adf10/acd96/pj#acd96_li21.dat
adf10/met96/pj#met96_h##.dat
adf10/met96/pj#met96_he##.dat
adf10/met96/pj#met96_li##.dat
adf10/plt96/pj#plt96_h##.dat
adf10/plt96/pj#plt96_he##.dat
adf10/plt96/pj#plt96_li##.dat
adf10/prb96/pj#prb96_h10.dat
adf10/prb96/pj#prb96_he10.dat
adf10/prb96/pj#prb96_li10.dat
adf10/prb96/pj#prb96_li20.dat
adf10/qcd96/pj#qcd96_he12.dat
adf10/qcd96/pj#qcd96_he21.dat
adf10/scd96/pj#scd96_h11.dat
adf10/scd96/pj#scd96_he11.dat
adf10/scd96/pj#scd96_he12.dat
adf10/scd96/pj#scd96_li11.dat
adf10/scd96/pj#scd96_li21.dat
adf10/xcd96/pj#xcd96_li12.dat
adf10/xcd96/pj#xcd96_li21.dat
adf11/acd96/acd96_li.dat
adf11/acd96r/acd96r_li.dat
adf11/scd96/scd96_li.dat
adf11/scd96r/scd96r_li.dat
adf11/prb96/prb96_li.dat
adf11/prb96r/prb96r_li.dat
adf11/plt96/plt96_li.dat
adf11/plt96r/plt96r_li.dat
adf11/qcd96r/qcd96r_li.dat
adf11/xcd96r/xcd96r_li.dat
adf11/acd89/acd89_li.dat
adf11/scd89/scd89_li.dat
adf11/ccd89/ccd89_li.dat
adf11/prb89/prb89_li.dat
adf11/plt89/plt89_li.dat
adf11/prc89/prc89_li.dat
adf11/pls89/pls89_li.dat
adf13/sxb96#li/sxb96#li_pjr#li0.dat
adf13/sxb96#li/sxb96#li_pjr#li1.dat
adf13/sxb96#li/sxb96#li_pju#li1.dat
adf13/sxb96#li/sxb96#li_pju#li0.dat
adf13/sxb96#li/sxb96#li_pjr#li2.dat
adf13/sxb96#li/sxb96#li_pju#li2.dat
adf15/pec96#li/pec96#li_pjr#li0.dat
adf15/pec96#li/pec96#li_pjr#li1.dat
adf15/pec96#li/pec96#li_pju#li1.dat
adf15/pec96#li/pec96#li_pju#li0.dat
adf15/pec96#li/pec96#li_pjr#li2.dat
adf15/pec96#li/pec96#li_pju#li2.dat
adf17/cbnm96#li/cbnm96#li_li0ls.dat
adf17/cbnm96#he/cbnm96#he_li1ls.dat
adf17/cbnm96#h/cbnm96#h_li2ls.dat
adf18/a09_a04/drm96#he/drm96#he_li1.dat
6
adf18/a09_a04/drm96#li/drm96#li_li0.dat
adf18/a17_p208/exp96#h/exp96#h_li2ls.dat
adf18/a17_p208/exp96#h/exp96#h_li2n.dat
adf18/a17_p208/exp96#he/exp96#he_li1ls.dat
adf18/a17_p208/exp96#li/exp96#li_li0ls.dat
adf18/a09_p204/drm96#h/drm96#h_li2n.dat
adf18/a09_p204/drm96#he/drm96#he_li1n.dat
adf18/a09_p204/drm96#li/drm96#li_li0n.dat
adf25/bns96#h/bns96#h_li2.dat
adf25/bns96#he/bns96#he_li1.dat
adf25/bns96#li/bns96#li_li0.dat
D.5
Add the adf00 directory which holds configuration and ionisation potential data. Note the
ga.dat file was incorrectly formatted. Incorrect ionisation potentials (missing exponents) in
Rb, Tc and Pd.
adf00
D.6
Correction to A-value in OV IC file (Peter Young, RAL).
adf04/adas#8/cop98#8_ic#o4.dat
D.7. The ADAS405 and ADAS406 example scripts atStrathclyde were out of data and so
(embarassingly) did not work.
D.8
David Elder pointed out that the ‘96’ neutral carbon pec and sxb datasets did not include
transitions that were present in the ‘93’ set. This is an old problem arising from the rather
crude algorithm in ADAS208 for restricting the total number of pecs. A new set of unresolved
and resolved files keyed to the visible spectrometer range (vsu and vsr files) – just as for CII
and CIII – have been added for CI as follow:
adf15/pec96#c/pec96#c_vsu#c0.dat
adf15/pec96#c/pec96#c_vsr#c0.dat
adf13/sxb96#c/sxb96#c_vsu#c0.dat
adf13/sxb96#c/sxb96#c_vsr#c0.dat
D.9. New adf38 and adf39 photo-excitation and photo-ionisation data. These have been prepared by
Nigel Badnell and Mike Seaton. H-like, hHe-like and Li-like ion s of carbon, oxygen, sulphur
and iron ions have been included on this occasion. Note that there are both LS and IC
versions. Further data sets are in preparation.
adf38/nrb02#h/<ion>ls<n>l,r.dat
adf38/nrb02#he/<ion>ls<n>l,r.dat
adf38/nrb02#li/<ion>ls<n>l,r.dat
H. P. Summers
07 Feb. 2003
7
ADAS510: F-PEC - graph envelope feature
photon emissivity coefficients
)B3(&
The program interrogates enevelope feature photon emissivity (
) files of type ADF40. The
coefficient is extracted for a selected wavelength range of an ion. The coefficient may be displayed in
a three dimensional plot.
Background theory:
)B3(&
An envelope feature photon emissivity coefficient, denoted by
, is defined on a wavelength
interval and is a composite feature arising from very many lines from a single ionisation stage. The
is suitable as a descriptor in wavelength intervals and at spectral resolutions where the
individual component lines are unresolved or only partly resolved. This situation occurs with very
complex heavy element ions for which it becomes helpful and economical to handle the envelope
s). Following Chap 3.8, the
feature rather than the individual line emissivity coefficients (
emissivity of an individual line is specified as
)B3(&
3(&
M
ε j →k = A j →k ( ∑) jσ( exc ) N e N σ +
σ =1
M z +1
∑)
υ ′=1
( rec )
jυ ′
N e N υ+′ ) .
6.10.1
This allows specification of the excitation photon emissivity coefficient
3(&σ(,excj→)k
= A j →k ) jσ( exc )
6.10.2
and the recombination photon emissivity coefficient
3(&υ(′,recj→) k
)
= A j →k )jυ( rec
.
′
6.10.3
Each of these coefficients is associated with a particular metastable
ions respectively.
Consider
a
spectral
interval,
[ λ 0 , λ1 ] ,
subdivided
σ or υ′ of the X + z , or X + z +1
N pix
into
intervals
as
{ ∆λ [i 0 ,1 ] ≡ [ λ 0 + i( λ1 − λ 0 ) / N pix , λ 0 + ( i + 1 )( λ1 − λ 0 ) / N pix ] : i = 0,.., N pix − 1 } Also
ϕ j →k ( λ ) . In general,
suppose that the j → k spectrum line has a normalised emission profile
such a profile is a convolution of Doppler and instrumental functions. Then the envelope feature
photon emissivity coefficient vector is defined as
)[ 0 ,1 ]
)B3(&σ(,exc
i
=
λi +1
3(&σ(,excj→)k ∫ ϕ j→k ( λ )dλ
∑
j ,k
6.10.4
λi
λ j → k ∈[ 0 ,1 ]
λ j→k is the natural wavelength of the j → k spectrum line. The default broadening assumed is
Doppler with a Maxwellian distribution for the emitting ion at temperature, Tion , equal to the
electron temperature, Te , used in the collisional–radiative modelling of the
a minimum broadening.
functions as
)[ 0 ,1 ]
)B3(&σ( ,exc
i
3(& s.
This consitutes
The integral in equation 6.10.4 is then expressible in terms of error
=
∑ 3(&
( exc ) 1
σ , j →k 2
{ erfc(( λ i − λ j →k ) / σ )
j ,k
λ j → k ∈∆λ[i 0 ,1 ]
6.10.5
− erfc(( λ i +1 − λ j →k ) / σ )}
kT
m p me
⋅
where σ = λ j → kα ion ⋅
I
m
m
H
X
p
1/ 2
and m X is the emitting ion mass.
8
)B3(&
s can be convolved with effective instrument
In principle, the minimal Doppler broadened
functions and/or representations of wavelength dependent filters. These are called ‘filtered’
s and they are structurally the same as the unfiltered
s.
)B3(&
)[ 0 ,1 ]
)B3(&σ(,exc
i
F
= Fi)B3(&
)B3(&
( exc )[ 0 ,1 ]
σ ,i
6.10.6
where { Fi : i = 1,.., npix } denotes a filter. The archiving is unchanged except for the need for a
filter code to be assigned as part of the archive.
data are extracted from archived files of type ADF40. They are interpolated by cubic
splines in electron temperature and density to provide results at an arbitrary set of temperature/density
pairs. The code can select the temperature/density pairs graphically. For this purpose the
must be contracted over wavelength. The functional used for interactive graphical pair selection is the
total photon count over the wavelength interval, namely
)B3(&
)B3(&
)B3(& σ
( exc )[ 0 ,1 ]
)[ 0 ,1 ]
= ∑ )B3(&σ(,exc
i
6.10.7
i
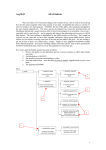
Program steps:
Interactive parameter comments:
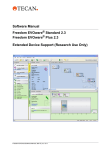
Programs of series ADAS5 which make use of data from archived ADAS datasets initiate an
interactive dialogue with the user in three parts, namely, input file selection, entry of user data and
disposition of output.
The file selection window has the appearance shown below
1. Data root shows the full pathway to the appropriate data subdirectories.
Click the Central Data button to insert the default central ADAS
pathway to the correct data type. Note that each type of data is stored
according to its ADAS data format (adf number). Click the User Data
button to insert the pathway to your own data. Note that your data must
be held in a similar file structure to central ADAS, but with your
identifier replacing the first adas, to use this facility.
2. The Data root can be edited directly. Click the Edit Path Name button
first to permit editing.
3. Available sub-directories are shown in the large file display window.
Scroll bars appear if the number of entries exceed the file display
window size.
4. Click on a name to select it. The selected name appears in the smaller
selection window above the file display window. Then its subdirectories in turn are displayed in the file display window. Ultimately
the individual datafiles are presented for selection. Datafiles all have
the termination .dat.
5. Once a data file is selected, the set of buttons at the bottom of the main
window become active.
6. Clicking on the Browse Comments button displays any information
stored with the selected datafile. It is important to use this facility to
find out what is broadly available in the dataset. The possibility of
browsing the comments appears in the subsequent main window also.
7. Clicking the Done button moves you forward to the next window.
Clicking the Cancel button takes you back to the previous window
9
1
2
4
3
6
5
7
The processing options window has the appearance shown below
1. An arbitrary title may be given for the case being processed. For
information the full pathway to the dataset being analysed is also
shown. The button Browse comments again allows display of the
information field section at the foot of the selected dataset, if it exists.
2. Spectral intervals for which envelope feature emissivity coefficients are
available in the data set are displayed in the list display window. This
is a scrollable window using the scroll bar to the right of the window.
Note there is a Filter field present for information. Click anywhere on
the row for a feature to select it. The selected feature appears in the
selection window just above the feature list display window.
3. Your settings of electron temperature/electron density pairs (outputs)
are shown in the temperature/density display window. The temperature
and density values at which the envelope feature emissivity coefficient
is stored in the datafile (inputs) is also shown for information. Note
that you must give temperature/density pairs, ie. the same number
of each as for a model. The underlying datafile has a threedimensional storage as a function of temperature, density and
wavelength.
10
1
2
3
4
5
4. The program initially recovers the output temperature/density pairs you
used when last executing the program. The Temperature & Density
Values are editable. Click on the Edit Table button if you wish to
change the values. The usual ‘drop-down’ window, the ADAS Table
Editor window, appears. Default Te and Default Ne are available.
These buttons insert the electron temperature data or electron density
data respectively from the input data set as the output values and offers
a choice of a fixed electron density or electron temperature respectively
to be associated with these.
5. The third button is for Value Selection by display. Click to pop-up the
point value selection widget. It is designed both to provide a display of
the actual three-dimensional surface of the density and temperature
dependent wavelength interval summed, envelope feature collisionalradiative emissivity coefficient (see equation 6.10.6) and to allow
selection of temperature/density pairs for the output graphs visually.
The point value selection widget has the appearance shown below
11
1
2
3
5
6
4
1. The summed envelope feature emissivity coefficient surface is shown.
Controls are provided to orientate and alter the appearance of the
display. Sliders allow rotation about the X-axis and about the Y-axis so
that the whole surface can be examined. The surface styles can be
altered by selecting from drop-down menus. The styles include
continuous or mesh surfaces and the colour of the surface. Finally the
form of the axes, that is logarithmic or linear can be chosen from dropdown menus.
2. A two dimensional projection on the Te/Ne plane is displayed. Note
that the grid lines are those of the actual data in the source file. The
code provides a sophisticated method for selecting Te/Ne pairs by
mouse click which allows the user to track over interesting parts of the
surface.
12
3. Move the mouse cursor over the lower Te/Ne grid. A tracking pointer
moves over the surface in the upper display. Click the left mouse button
to select a Te/Ne pair. A symbol marks the selection on the Te/Ne grid
in the lower display and a marker also appears on the surface in the
upper display. Continue to select point pairs as required.
4. Note that the position of the cursor in Te/Ne space is shown
numerically for precise positioning
5. Control buttons at allow adjustments to your selection set. Pairs can be
added at the beginning or end of the set or inserted between pairs. Also
a pair can be deleted. Finally the whole set of pairs can be erased.
6. Click Done on completion to return to the processing options window.
The pairs selected will be present in the editable table. Note that
conventional entry or modification of user data with Table Editor
remains an option as before.
The output options window appearance is shown below
1
2
3
4
1. As in the previous window, the full pathway to the file being analysed is
shown for information. Also the Browse comments button is available.
2. Graphical display is activated by the Graphical Output button. This
will cause a graph to be displayed following completion of this window.
When graphical display is active, an arbitrary title may be entered
13
which appears on the top line of the displayed graph. By default, graph
scaling is adjusted to match the required outputs. Press the Explicit
Scaling button to allow explicit minima and maxima for the graph axes
to be inserted. Activating this button makes the minimum and
maximum boxes editable.
3. Hard copy is activated by the Enable Hard Copy button . The File
name box then becomes editable. If the output graphic file already exits
and the Replace button has not been activated, a ‘pop-up’ window
issues a warning. A choice of output graph plotting devices is given in
the Device list window. Clicking on the required device selects it. It
appears in the selection window above the Device list window.
4. The Text Output button activates writing to a text output file. The file
name may be entered in the editable File name box when Text Output is
on. The default file name ‘paper.txt’may be set by pressing the button
Default file name. A ‘pop-up’ window issues a warning if the file
already exists and the Replace button has not been activated.
The graphical output window has the appearance shown below
1. The 3-D plot is displayed together with identifying textual annotation.
2. The Print button sends the displayed graph to the graphic file. The
Adjust button pops up the 3-D graph adjustment widget which allows
modification of the graph.
3
3
The 3-D graph adjustment widget has the appearance shown below
14
1. Control is provided to alter the axes. A choice for the X-axis
(temperature or density) is provided. Note that the X-axis is
representing the variation with both temperature and density, since
model pairs are being used. The Y-axis is assigned to wavelength. The
style (logarithmic or linear) for each of the axes may be varied.
2. Explicit scaling may be activated and then the usual manual entry of
minima and maxima for each of the three axis scales is supported.
3. Control of the orientation of the 3-D display is provided. Also, the
appearance of the surface (mesh or surface) and colour of the surface
may be chosen.
4. Note that the widget remains present and active for convenience so that
a sequence of adjustments may be made. Click Done to close the
widget..
1
2
3
4
Notes:
15
ADAS804: Calculate cross-sections & rate
coefficients
The code calculates electron impact excitation cross-sections in a one electron distorted wave Born
approximation using an optimised Slater type or Jucys screening potential and observed level
energies.
Background theory:
+z
γ
A (γ ) + e ( E ) → A (γ ') + e( E ')
For a free electron colliding with a z times ionised ion A
+z
in the state
+z
9.4.1
E and E ' are the initial and final electron energies with E > E ' and ∆E = E − E ' is the
transition energy. The Born collision strength takes the form
Ωγ ,γ ' ( E, E ') = ωγ 8
EE '
Qγ( λ,γ)' R ( λ ) ( E , E ')
∑
IH λ
where the sum is over the various multipoles
9.4.2
Qγ( λ,γ)' comprises the angular factors and
λ.
R (λ ) ( E , E ') the momentum and radial integrals. The Ochkur extension allows the application tto
(λ )
(λ )
spin change transitions, but with different Qγ ,γ ' and R ( E , E ') . In term coupling the formulae are
No spin change:
γ ≡ ( S p Lp )nlSL ; γ ' ≡ (S p Lp )n ' l ' SL ' .
l L Lp l l ' λ
= (2l + 1)(2l '+ 1)(2l '+ 1)(2λ + 1)
L ' l ' λ 0 0 0
2
(λ )
γ ,γ '
Q
R ( λ ) ( E , E ') =
1
∫
nl jλ (qr ) n ' l '
2
2
d (cosθ )
a04q 4
Spin change: γ ≡ ( S p Lp ) nlSL ; γ ' ≡ ( S p Lp )n ' l ' S ' L ' .
9.4.3
−1
Qγ( λ,γ)' = (2l + 1)(2l '+ 1)(2l '+ 1)(2λ + 1).
(2S '+ 1) l L L p l l ' λ
2(2 S p + 1) L ' l ' λ 0 0 0
2
1
nl jλ (qr ) n ' l '
2
2
4
q
R ( E , E ') = ∫
9.4.4
k d (cosθ )
4 4
a0 q
−1
q is the momentum transfer at scattering angle q and q is the initial momentum. Other notation is
(λ )
conventional. The radial integrals are evaluated from numerical wave functions as follows.
Effective potential non-hydrogenic radial integrals: Let z0 be the nuclear charge of ions A
+z
and write z1 = z + 1 . A parameterized effective central potential is adopted here as the basis for
calculating these wave functions. The central potential is established by defining an effective
screening configuration
9.4.5
n1l1q1n2l2 q2 ....nsl s qs such that q1 + q2 + .... + qs = z0 − z1 .
The electron in shell i is supposed to be screened from the nucleus by the electrons in shells < i and
partially screened by the other electrons in shell i itself. So the effective charge for the i th shell
electron is
i −1
zi = z0 − ∑ q j − 1 2 qi .
9.4.6
j =1
The adopted (Slater type) potential is then
16
V (r ) =
ni
z0 s qi
− ∑ exp( −α i zir / ni ) ∑ aik r − k
r i=1 r
k =0
9.4.7
The α i are adjustable parameters chosen so that the one electron wave function satisfies the one
electron Schrodinger equation with potential V (r ) and the observed eigenenergy ε and quantum
defect µ . In practice, we set α i = α iα with α i specified so that only the overall scaling parameter α
is varied to match the observed quantum defect. The radial integrals are evaluated by numerical
quadratures.
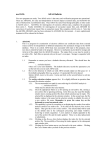
Program steps:
Interactive parameter comments:
The archive selection window appears first. It is slightly different in
operation than the usual file selection window.
1. The recommended root path for user archiving for ADAS804
analysis is
.../uid/adas/arch804/
which may be edited in the usual manner.
2. Click the appropriate button for opening an old archive file,
starting a new archive file or ignoring archiving. In the first case,
the usual file display window shows existing archive files from
which selection may be made. The selected file is displayed in the
selection window. In the second case, the file display window is
the same, but the selection window is editable for entry of a new
archive file name. Remember to press the return key on the
keyboard to record an entered value.
3. The capability is given for reworking or re-displaying the results
of an earlier analysis stored in an archive file. Click on the
Refresh from archive button. Then give the Archive index
number. The selected data will be used as the default data in the
subsequent processing and output windows. Archiving is strictly
sequential. A new analysis is simply appended at the end of the
archive file and the index updated. These is no data replacement
or substitution.
4. Clicking on the Browse Index button displays the index list for the
selected archive file. The possibility of browsing the index appears
in the subsequent main window also.
5. Clicking the Done button moves you forward to the next window.
Clicking the Cancel button takes you back to the previous window
The processing options window appearance is shown below
1. An arbitrary title for the run may be set. If an archive is in
use, then its name is given. Also the index of the archive can
be browsed.
2. The nuclear and ionic charges should be specified along with
Zeff, the effective ion charge. Normally, Zeff is set equal to
the ion charge+1.
3. Specify the parent term or level. Note that the code can deal
with LS-coupled terms or levels and with J-resolved parents
in Jp-j coupling. If the parent is a term, leave the Jp field
bank.
17
1
3
2
4
5
4.
5.
6.
7.
Specify the details of the lower and upper levels of the
transition. For a transition between terms, leave the fields
JT1 and JT2 blank. Note that the number of equivalent
electrons are required for the initial and final shell of the
active electron together with fractional paranetages associated
with the identified parent. The binding energy is the energy
(rydbergs) required to remove the active electron leaving the
residual ion in the identified parent state.
Select required energies at which the collision strength should
be calculated and temperatures at which the Upsilons should
be calculated. The table is editable and there are default
buttons for both the energies and temperatures. The default
values are the standard ADAS sets.
At the present time, only the effective potential Born
calculation is provided. The option for an impact parameter
calculation (of dipole allowed transitions only) will be
provided in the future.
A choice of Slater and Jucys forms for the effective potential
is provided. The current trend of our work is to prefer the
Slate form. At this time only internal (calculation) of
wavefunctions is permitted. The option of reading in
numerical radial wavefunctions may nbe made available at a
later stage. Adjustable (alpha) parameters in the potential
may be varied so that the wavefunction eigenenergy
corresponds to the input energy. There is another option,
whereby the potential parameters are locked and the
18
8.
eigenenergy sought. This is a less useful option in the present
context.
The potential form is established by specification of a
‘screening configuration’. Typically this is the distribution of
the electrons amongst their various nl-shells in the initial
state, excluding the active electron (that is the parent ion).
Also, initial values of the adjustable parameters may be set.
Usually both are set to 1.0 initially.
1
2
4
3
5
6
8
7
The output options window appearance is shown below
1. There is a choice of method for examination and display of the results data.
Click either the Standard Plot Option of the Burgess Plot Option. The
sub-window varies depending on this choice.
2. Graphical display is activated by the Graphical Output button. This will
cause the graphs to be displayed following completion of this window.
When graphical display is active, an arbitrary title may be entered which
appears on the top line of the displayed graph. By default, graph scaling is
adjusted to match the required outputs. Press the Explicit Scaling button to
allow separate explicit minima and maxima for the graph axes of the omega
and Upsilon plots to be inserted.
3. Hard copy is activated by the Enable Hard Copy button . The File name
box then becomes editable. If the output graphic file already exits and the
Replace button has not been activated, a ‘pop-up’ window issues a warning.
19
4.
A choice of output graph plotting devices is given in the Device list
window. Clicking on the required device selects it. It appears in the
selection window above the Device list window.
The Text Output button activates writing to a text output file. The file name
may be entered in the editable File name box when Text Output is on. The
default file name ‘paper.txt’may be set by pressing the button Default file
name. A ‘pop-up’ window issues a warning if the file already exists and the
Replace button has not been activated.
1
2
3
4
The output graph windows are shown below
1. The Previous and Next buttons allow switching between the Upsilon
and Omega plots. Print and Printall send the graphs to the hard copy
unit. Click Archive to add the complete set of results for the case
analyses to the end of the archive selected on input and assign the next
sequence number to it.
20
1
Notes:
21
ADAS808: Create a composite set of adf34, adf40
and adf41 iso-nuclear driver files
The program uses the IDL graphical user interface to automate preparation of the driver datasets
required for large-scale off-line production of ADAS Baseline Atomic Data for complex atoms.
Drivers for many or all of the ionisation stages of a heavy element may be generated at the one time.
The drivers produced are the input datasets for offline running (usually on massively-parallel
computers) of the codes ADAS801, ADAS407 and ADAS810. Subsequent to ADAS808, the offline
calculations may be executed automaticaaly under the control of a master script with final delivery of
complete data in the ADAS data format classes ADF04, ADF03, ADF11, ADF15 and ADF40. The
code allows the user to assess and regulate the subsequent size of the offline calculations on the basis
of experimental spectral regions of interest, available machine size and strategies in atomic structure
modelling.
Background theory:
The fundamental part of the ADAS Baseline Atomic Data consists of ADF04 files for each ion of an
element, archived in iso-nuclear collections. Each file comprises energy levels and A-values for an
ion computed using Cowan Atomic Structure Code and electron impact Maxwell averaged collision
strengths in the Born approximations. Implementation within ADAS is via the code ADAS801. This
code has the Cowan Atomic Structure Code at its core but includes an IDL front end to acquire the
input data (the ADF34 driver), and subroutines to organize output in ADAS standard forms (ADF04
files) and nomenclatures. For medium/ heavy element ions, with many electrons, the ADAS801
calculations must be performed in intermediate coupling and include many configurations. For such
systems the preparation of configuration lists for the ADF34 drivers is prohibitively tedious and the
calculations are massive. Automated handling followed by offline execution on massively parallel
machines is essential. In ADAS, the automated, high throughput is achieved by firstly sophisticated
interactive set-up of the ADF34 drivers. ADAS808 fulfills this latter purpose.
The complete ADAS Baseline Atomic Data includes also various derived data classes. In simple
systems, these other data are generated by interactive execution of the codes ADAS407, ADAS408
and ADAS208. For medium/heavy element systems, it is convenient to use ADAS808 to set up
additional drivers so that these codes also may be executed automatically offline. Finally, the
complexity of heavy element emission, means in practice that spectral analysis must often be carried
out on unresolved or only partially resolved transition array features rather than on individual
spectrum lines. In ADAS, a new derived quantity, called a feature photon emissivity coefficient,
, is introduced (analogous to the emissivity coefficient,
) is intrdoduced to describe
these envelope features. The associated code, ADAS810, calculates such
s and it is
convenient for ADAS808 to prepare the drivers for offline execution of ADAS810 also. Following
interactive execution of ADAS808, all subsequent calculations and assembly of the complete ADAS
Baseline Atomic Data are achieved by launching an integrated PERL script to the target high
performance parallel computer system. No further user intervention is required.
Configuration definition The set of working configuration for the atomic structure calculation is
obtained by an electron promotional strategy starting from the ground configuration
)B3(&
3(&
Γg = n1l1 1 n2 l 2 2 ......nm l m
q
q
qm
where qi > 0 for i = 1,...,m and
)B3(&
m
∑q
i =1
i
=N
For complex systems, there may be empty inner shells and multiple open shells. Elements up to
uranium are within the scope of ADAS808. The ground configurations for every ion of every element
up to uranium are provided in the ADAS data format for general constants ADF00 as
/…/adas/adas/adf00/ground_configs/<element symbol>.dat. An equivalent data set provides both the
ground configurations and the ionisation potentials as /…/adas/adas/adf00/ground_ionpots/<element
symbol>.dat. It is helpful to maintain a consistent pattern for configurations. In ADAS two
conventions are use, namely the Standard form and Eissner form. Standard form represents each
shell with three characters with a space separating shells in the whole configuration as ‘ 1s2 2s2 2p1’
representing 1s22s22p1. For certain calculations, principal quantum numbers greater than 9 may be
required and for complex element ion, shell occupancies greater than 9 also may occur. To maintain
the three character shell notation, the integers beyond nine are represented alphabetically, that is 10 ≡
22
‘a’, 11 ≡ ‘b’ etc. Thus in Standard form, 2p6 6f11 11s1 is represented by ‘ 2p6 6fb bs1’. In Eissner
form, each orbital, starting from 1s is indexed. The index is an integer up to 9, but continues through
the upper case alphabet and then through the lower case alphabet. Thus 1s ≡ ‘1’, 2p ≡ ‘2’, 4f ≡ ‘A’. A
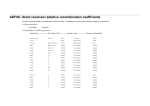
portion of the conversion table is
Orbital 1s
2s
2p
3s
3p
3d
4s
4p
4d
4f
Eissner 1
2
3
4
5
6
7
8
9
A
Orbital 5s
5p
5d
5f
5g
6s
6p
6d
6f
6g
Eissner B
C
D
E
F
G
H
I
J
K
The shell occupancy is represented as a two digit integer as 50+q and this precedes the shell index
character. Thus again the shell is represented by a three character field but is written with no
separation between the fields in the whole configuration. Thus in Eissner form 1s2 2s2 2p6 6g11 is
represented by ‘52152256361K’. ADAS works freely with both notations and subroutines in the
ADAS library transform from one to the other. Eissner form is the preferred form in ADAS series 7
codes since structure calculations there use the Autostructure code. Standard form is the preferred
form in ADAS series 8 codes since structure calculations there use the Cowan/O’Mullane code.
Eissner form is the most compact and is generally adopted with very complex configurations.
A promotional strategy Consider a group of ions
{$
+z
: z = z min ,..., z max } of the element
$.
A set of configurations targetted on a structure calculation is established by promoting electrons from
the ground configurations of the ions. The criteria for promotion are shell-based and not set up ion by
ion - rather they are for the group of ions of the element. For complex ions, it is possible to have
ground configurations with more than one partially filled shell, which are called valence shells. By
reviewing the ground configurations of the ion group, a list of single valence shells present is
identified - likewise for double valence shells and in principal on to triple valence shells. The
promotional strategy depends on whether there is a single or double valence shell. At this time,
ADAS808 has no strategy for triple and higher valence shells.
1.
In the single valence shell case, we progress through each of the identified valence shell
orbitals in turn. Consider valence orbital nv l v . Distinguish promotions upward in
principal quantum number, that is to nl shells such that ∆n = n − nv > 0 from
promotions downward (in normal shell ordering) with ∆n < 0 . Principal quantum
shell promotions are determined by the permitted maximum ∆n and by the sign of the
promotion. The negative case allows promotions to empty inner shells to be treated. In
similar manner, promotions are ranked according to the maximum ∆l allowed with
2.
positive and negative ∆l handled separately. Note that the valence shells treated in
this manner are partially filled. Promotions from inner closed shells excluding the
valence shell, which may generate many less important configurations, are preferably
restricted by setting the lowest n-shell from which the promotion can occur and the
highest n-shell to which the promotion can take place. Again it is single electron
promotion which is done. Finally, it is a usual policy in accurate energy level
calculations to include all the configurations of a complex if one of the configurations of
the complex is present. Such a policy can generate large numbers of configurations in
the complex ion case. It is helpful to decide if whole complexes associated with the
single electron promotion configurations are to be included.
A similar procedure may be applied in the two valence shellcase but with the
permissions for each electron specified separately.
Configuration partitioning For complex ions, the number of configurations which satisfy even quite
restricted promotional rules can be large. Also, since these configurations often include more than
one unfilled shell, the level count for each configuration can be very large. Mechanisms beyond the
basic promotional rules are required to restrict the total level set to match available computer power.
In ADAS808, a second mechanism is introduced based on observational spectral regions of interest.
The principle is straightforward. Consider a spectral region of interest [ λ 0 , λ1 ] , which may be the
range of a particular spectrometer or an interval of special diagnostic value. For configurations I
23
( av )
and J , introduce the configuration average energies E I
energy
∆E
( av )
IJ
=E
( av )
J
−E
( av )
I
and
wavelength
Configurations such that the transition wavelength
( av )
and E J
λ
( av )
IJ
, the transition array average
= hc / E J( av ) − E I( av )
E J( av ) < E I( av )
.
λ(IJav ) ∈ [ λ0 ,λ1 ] should be handled at high
resolution, that is level resolved, while configurations such that the transition wavelength
λ(IJav ) ∉ [ λ0 ,λ1 ] may be handled at low resolution, that is configuration average. In general, there
may be a set of wavelength intervals of interest and from the total number of configurations, N C is
partitioned into the level resolved set, numbering N C R , and the configuration average set, numbering
N C A , such that N C = N C R + N C A . A further constraint may be imposed by setting a lower limit
for transition probabilities, thereby excluding very weak lines. At the configuration average level, this
means a lower limit
'min2( av )
on the reduced dipole matrix elements,
I
'J
2
for the transition
arrays. A preliminary stage of the Cowan structure code package generates configuration average
energies and reduced dipole matrix elements. This stage is rapid and makes low demands on
computer resources. It is convenient therefore to provide a transition array spectrum display so that
the definition of wavelength regions of interest can be done directly in interaction with the display.
Immediate information is returned to the user on resolved level counts and on resolved and unresolved
configuration counts, so that the size of the subsequent full structure computations may be assessed
and regulated. The transition array spectrum in which the ordinates are reduced dipole matrix
elements provides a relatively crude picture. Transition arrays between excited configurations are on
the same footing as those involving the ground configuration. There is no real population
information. It is to be noted however that the first stage of the Cowan code package also returns the
reduced Born matrix elements. Thus a configuration average population calculation and emissivity
production is possible without significant additional computational overhead. The configuration
average transition array emissivity coefficients for an ion provides a more realistic footing. On the
other hand, at this first stage of structure calculation, no basis for relative weighting of transition
array emission functions from different ionisation stages is available. Due to the sensitivity of the
spectrum and dominant ionisation stage to electron temperature, a constraint based on temperature is
unsound at this point of the data generation exercise. Equal weighting of ionisation stages
abundances is the most appropriate choice. ADAS808 presents either a reduced dipole or
configuration average emissivity transition array spectrum to the user. These details are described in
detail below.
, is
Envelope features An envelope feature photon emissivity coefficient, denoted by
defined on a wavelength interval and is a composite feature arising from very many lines from a
is suitable as a descriptor in wavelength intervals and at
single ionisation stage. The
spectral resolutions where the individual component lines are unresolved or only partly resolved. This
situation occurs with very complex heavy element ions for which it becomes helpful and economical
s). The
to handle the envelope feature rather than the individual line emissivity coefficients (
primary use of ADAS808 is to set up calculations for very heavy species and so the wavelength
intervals such as [ λ 0 , λ1 ] above, introduced as a focus for partitioning configurations, are identified
)B3(&
)B3(&
3(&
as the spectral intervals over which the envelope features are sought. ADAS808 therefore provides
drivers also for the
calculations – see ADAS810 for more details.
)B3(&
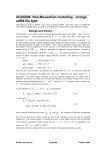
Program steps:
Interactive parameter comments:
The input window is as shown below
1.
Enter the element symbol. Note that the element symbol and nuclear
charge number boxes are linked so if one of them is changed, the other is
24
automatically updated. Also, set the minimum and maximum ion charges,
noting that the last ion of an element in this context is the hydrogen-like
stage with z = z 0 − 1 where z 0 is the nuclear charge.
2.
3.
Three sets of electron temperatures must be specified. These temperatures
are passed through to the final drivers and ultimately are the temperatures
used in the ADF04 , AD11 and ADF15 files. The Input temperatures are
usually the ADF standard reduced temperatures. Note that the temperature
set is editable and a user’s units of choice may be selected.
A pathway to ionisation potentials for all elements and their ions is
required. These data include the ground configurations and are provided in
the Central ADAS archive /packages/adas/adas/adf00/ .
3
1
2
4
4.
The Browse Comments button has no effect at this time. Clicking the Done
button moves you forward to the next window. Clicking the Cancel button
takes you back to the previous window.
The processing – configuration generator window is shown below:
1.
2.
3.
The processing window has three separate modes of operation which may
be selected. In Configuration Generator mode, the window appearance is
as shown below. This mode must be completed before the other modes are
meaningful and is described below.
The sub-window on the left permits the setting up of a promotional strategy
for configuration generation. You must note that this strategy applies to
simultaneously to all ions selected on the Input window. Single and
double valence shell cases are chosen as required and the fields which are
presented depends on that selection. The one valence shell case is
illustrated below.
The valence shells are listed. Clicking on a member of the list causes it to
appear in the selection widget. Then the choices made on the left at 4
apply to that valence electron.
25
4.
5.
6.
Make the preferred choices, then click on the Set Default Configurations
Button. Done is appended to the chosen valence shell in the list widget.
Work through each shell in the list. Note that a shell may be reworked
simply by reselecting it.
In like manner select the Two open shell button and then work through the
two valence shell list.
When the promotional strategy is complete, enter an ion charge from the
selected range in the text box . The set of default configurations for that
ion is presented in the table together with the number of levels, which
would result from that configuration. The table is editable to add further
configurations which are not entered by the promotional strategy.
9
1
5
2
3
4
6
10
7
8
7.
8.
The total level count for the ion is shown.
It is now possible to select configurations to be treated as resolved by
activating the right-most buttons. The number of levels in the resolved set
of configurations is displayed in the lower box .
9. There are two sets of Select All and Deselect All buttons which apply to the
right-most button selectors. The upper pair apply to the lists for every ion
in the whole ion range simultaneously. The lower pair apply only to the
currently displayed ion.
10. Additional strategies for inner shell promotion are in development and are
subject to change. In the present ‘beta’ version, this button is omitted
The processing - configuration selection window is shown below
1. Clicking the Configuration Selection button presents the window shown
below, in which the sub-window on the left is now used to show a a stick
spectrum of the various transition arrays.
26
5
1
3
7
2
6
4
2.
3.
4.
5.
6.
Clicking the Calculate Survey Spectrum button spawns the calculation of
the first stage of the Cowan code to obtain the necessary parameters. The
calculation may take a few minutes, but then all information is available
the stick plot is displayed. Any further selections operate rapidly.
The stick plot shows the transition arrays for every ion in the group.
Transition arrays for the ion selected at the right are marked with sticks in
a contrasting colour.
The wavelength range of the stick plot may be altered and logarithmic or
linear axes chosen.
The plot area is active. The mouse may be used to delimit rectangular
areas which are the spectral intervals of special interest. The base of the
rectangle set a minimum value of the reduced dipole matrix element for
transition array configurations to be included in the resolved set.
To mark a rectangle, first activate a square row button on the left of a row
of the spectral ranges sub-window, so that it is displayed and the button on
the right to make the row active for editing. Drag out a horizontal line on
the plot area using the right mouse button and release. The rectangle may
be stretched by catching an edge and dragging with the left mouse button.
'
The selections, ( λ min , λ max ,
7.
2
min
) are shown in the boxes.
The left hand button of a spectral range row defines configurations which
contribute to lines in that range as requiring level resolution on the
configuration list and that configuration is marked its button indicator
light. The selected configurations count
is updated accordingly.
Remember to reselect an ion at 3. to update the configuration list subwindow display after each alteration.
The processing – level count window is shown below
1. Clicking the Level Count button presents the window shown below. The
sub-window to the left displays a count summary plot.
2. Display of configuration counts and level counts for each ion in the selected
ion range may be chosen. Note that the Total Levels and Total
27
3.
4.
Configurations may be shown prior to the calculating the survey spectrum.
Selected Levels and Selected Configurations require the survey spectrum to
be calculated first.
The graph display scales may be adjusted.
Note the summary information
1
3
2
4
The output options window is as shown below
1.
2.
The Text Output button activates writing to a text output file. The file name
may be entered in the editable File name box when Text Output is on. The
default file name ‘paper.txt’ may be set by pressing the button Default file
name. A ‘pop-up’ window issues a warning if the file already exists and the
Replace button has not been activated.
The primary output is to an adf34 sub-directory which can be entered and/or
selected.
28
1
2
Illustration:
Table 9.08a
w_7_adf34.dat
2
Table 9.08b
-5
74
74
74
74
74
74
74
74
74
-1
2
8
8
8
8
8
8
8
8
8
10
w
w
w
w
w
w
w
w
w
1.0
5.d-09
4f13 5s2 0
4f13 5s2 3
4f12 5s2 7
4f13 5s2
4f12 5s2
4f13 5s2
4f13 5s2
4f12 5s2
4f12 5s2
0130
1.0 0.65
5p6
5p5 6p1
5p6 6p1
5p5 6s1
5p6 6s1
5p5 5d1
5p5 6d1
5p6 5d1
5p6 6d1
0.0
0.5
w_7_inst.dat
z0 74
zi 7
parity-1 3
parity-2 6
E2 3
M1 3
scale 93 99 93 93 93
temperature 25
2.00000E+02
5.00000E+02
1.00000E+04
2.00000E+04
1.00000E+05
2.00000E+05
2.20000E+06
2.20000E+06
2.20000E+06
2.20000E+06
2.20000E+06
2.20000E+06
2.20000E+06
Table 9.08c
5.d-11-2
4f13 5s2
4f13 5s2
4f12 5s2
4f13 5s2
4f12 5s2
4f13 5s2
4f13 5s2
4f12 5s2
4f12 5s2
1.00000E+03
5.00000E+04
5.00000E+05
2.20000E+06
2.20000E+06
2.20000E+06
2.00000E+03
5.00000E+03
1.00000E+06
2.00000E+06
2.20000E+06
2.20000E+06
w_7_pp.dat
1
Allan Whiteford
15/12/79
1
C
Comments are for losers!
&FILES ifgfile = './ifg#w_7_adf34.dat' , outfile = './w_7_adf04.dat'
&END
&OPTIONS ip =
1134988.8, coupling = 'IC' , aval = 'YES' ,
isonuclear = 'NO', lweight = 'NO' , comments = 2, numtemp = 14, &END
1 2 3 4 5 6 7 8 9 10 11 12 13 14
Table 9.08d
w_7_pec_drv.dat
w + 9
74
./w_9_adf04.dat
10
1475969.1
# input adf04 file
29
./w_9_adf11.dat
# output plt file
./w_9_adf15.dat
# output pec file
./w_9_adf40.dat
# output f_pec file
lmetr = false
metastables
ltscl = true
temperatures
ldscl = false
densiities
lbrdi = true
broadening
# true to resolve
# true for z-scaled
# true for z-scaled
# true for ion temp.
13
2.000E+02 5.000E+02 1.000E+03 2.000E+03
5.000E+03 1.000E+04 2.000E+04 5.000E+04
1.000E+05 2.000E+05 5.000E+05 1.000E+06
2.000E+06
# no. of temperatures
# temperatures (K)
5
1.000E+11 1.000E+12 1.000E+13 1.000E+14
1.000E+15
# no. of densities
# densities (cm-3)
2
intervals
128 2.759e+01 2.112e+03
triplets
128 5.890e-01 2.242e+00
# no. of wavelength
# pixel no.,wvmin,wvmax
(wavelenths in Angstrom)
Notes:
ADAS809: Non-Maxwellian modelling - change
adf04 file type
The program converts an ADF04 – type 1 file to a standard ADF04 – type 3 file. That is an ADF04
file with collision strength data is converted to an ADF04 file with Maxwell averaged collision
strengths.
Background theory:
The tabulation of the electron impact excitation and ionisation data in an ADF04 – type 1 file is of
collision strength Ω versus threshold parameter X . X = ε i / ∆E ij where ∆E ij is the energy of
the transition i → j and
ε i is the incident electron energy with the target in the lower energy state
i . At the finest energy resolution, collision strengths display detailed resonance structure. It is
assumed that the tabulated collisions strengths in the ADF04 – type 1 file are smoothly varying, that
is they have been subject to some averaging over resonant structure. It is evident that if the ‘width’ of
the averaging interval above is ∆E res − avge , then the generation of Maxwell averaged collision
strengths at temperature Te is meaningful only if kTe >> ∆E res − avge . The numerical quadrature
procedure takes account of dipole, non-dipole and spin change forms for excitation. The behaviours
for transition i → j are as
dipole:
Ωij ≈ F3 Sij log( X + F2 )
non − dipole: Ω ij ≈ F3 + F2 X
9.9.1
spin change: Ω ij ≈ F3 ( X + F2 ) 2
where F2 and F3 are constants. In the dipole case, asymptotically F3 = 4 3 . Sij is the line strength
for the transition. For ionisation, the dipole form with F3 S ij replaced by the single constant F3 ' is
30
appropriate. For electron impact excitation of ions, the collision strength tends to a finite value at
threshold. In contrast, for neutral atom excitation and ionisation, the collision strength tends to zero
α
at theshold, with the threshold behaviour Ω ~ aX . Usually
and α ~ 1 for ionisation of both atoms and ions.
α = 1 / 2 for neutral atom excitation
For the tabulation {( X k , Ω k ) : k = 1,...,n } , the quadrature
∞
Υij = ∫ Ω ij (ε j ) exp( − ε j kTe ) d (ε j kTe )
9.9.2
0
is expressed as
Υij = ( ∆Eij kTe ) exp( ∆Eij kTe )
∞
∫Ω
ij
9.9.2
( X ) exp[ − X ( ∆Eij kTe ))] dX
1
and the integral divided into the ranges
∫
∞
Xn
X1
,
∫
X1
1
and
∫
. The asymptotic behaviours extrapolating
Xn
from the first and last two tabular points are used in the evaluation of the first and last integrals
respectively. The second integral is evaluated piece-wise in each tabular interval with the integrand
locally fitted to a quadratic in either a linear scale (ie. Ω = c1 + c 2 X + c3 X ) or logarithmic scale
2
picture (ie. lnΩ = c1 + c 2 ln X + c3 lnX ).
2
Quadrature precision is checked from the exact integrals of the approximate forms, namely,
dipole :
Υij ≈ F3 S ij [ln( 1 + F2 ) + EEI (( 1 + F2 )∆Eij / kTe )]
non − dipole : Υij ≈ F3 + F2 ( ∆Eij / kTe )EEI ( ∆Eij / kTe )
spin change : Υij ≈
F3 ( ∆Eij / kTe )
1 + F2
9.
EE 2(( 1 + F2 )∆Eij / kTe )
9.3
where EEI ( x ) = exp( x ) E1 ( x ) and EE 2( x ) = exp( x ) E 2 ( x ) with E 1 and E 2 the first and
second exponential integrals. A further verification on the quadratures is from the exact integrals for
Ω = constant, Ω = X − 1 and Ω = ( X − 1)2 which are exact for the quadratic fit, linear scale
option.
The program has a capability for comparison and display. In addition to the input ADF04 – type 1
file for conversion, it can accept a second ADF04 – type 3 file. The temperature set for output is
copied from the latter reference file. Additionally, the collision data for a selected single transition
may be graphed along with the corresponding data from the reference file if it exists. The usual
display and output routing facilities are provided.
Program steps:
Interactive parameter comments:
Remember to ensure you have a defaults directory allocated. This should have the pathway
/..../uid/adas/defaults
where uid is your user identifier. The defaults directory records the parameters you set the last time
you ran each ADAS code. Move to the directory in which you wish any ADAS created files to appear.
These include the output text file produced after executing any ADAS program (paper.txt is the
default) and the graphic file if saved (e.g. graph.ps if a postscript file). Initiate ADAS, move to the
series 2 menu and click on the first button to activate ADAS201.
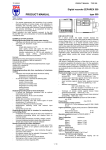
The file selection window has the appearance shown below
31
1. Selection of two adf04 files is permitted. The first selected in the upper
sub-window is of adf04 – type1 and is mandatory. The second optional
file, selected in the lower sub-window is of adf04-type3. It provides a
temperature grid for the conversion. Selection of the adf04 files follows
the standard ADAS.
2. Data root shows the full pathway to the appropriate adf04 data
subdirectories. Click the Central Data button to insert the default
central ADAS pathway to the correct data type. Click the User Data
button to insert the pathway to your own data. Note that your data must
be held in a similar file structure to central ADAS, but with your
identifier replacing the first adas, to use this facility. The Data root can
be edited directly. Click the Edit Path Name button first to permit
editing.
3. Available sub-directories are shown in the large file display window.
Scroll bars appear if the number of entries exceed the file display
window size. Click on a name to select it. The selected name appears
in the smaller selection window above the file display window. Then its
sub-directories in turn are displayed in the file display window.
Ultimately the individual datafiles are presented for selection. Datafiles
all have the termination .dat.
4. Once the adf04 files are selected, the set of buttons at the bottom of the
main window become active. Clicking on the Browse Comments button
displays the comment line information stored with the adf04 datafile. It
is important to use this facility to find out what is broadly available in
the dataset. The possibility of browsing the comments appears in the
subsequent main window also.
32
2
3
1
4
The processing options window has the appearance shown below:
1. An arbitrary title may be given for the case being processed. For
information the full pathway to the dataset being analysed is also shown.
The button Browse comments again allows display of the information field
section at the foot of the selected dataset, if it exists. A summary of the
number of electronic transitions and energy levels is also given.
2. Transitions for which electron impact excitation data are available in the
data set are displayed in the line list display window. This is a scrollable
window using the scroll bar to the right of the window. Click anywhere on
the row for a line to select it. The selected transition appears in the
selection window just above the line list display window. This single
transition will displayed.
3. The output rate coefficient for the selected transition may be fitted with a
polynomial. This is as a function of temperature. Clicking the Fit
Polynomial button activates this. The accuracy of the fitting required may
be specified in the editable box. The value in the box is editable only if the
Fit Polynomial button is active.
33
1
3
2
4
.
2
4.
5.
To obtain an output adf04-type3 file output temperatures must be selected.
If a comparative adf04-type3 file was selected, the Input temperatures are
taken from that file. Otherwise temperatures from the Defaults file are
used. Pressing the Default Temperature values button inserts a default set
of temperatures equal to the input temperatures
The Temperature Values are editable. Click on the Edit Table button if you
wish to change the values. A ‘drop-down’ window, the ADAS Table
Editor window: It follows the same pattern of operation as described in
bulletin.
The output options window is as shown below
1. As in the previous window, the full pathway to the file being analysed is
shown for information. Also the Browse comments button is available.
34
1
2
3
4
5
.
2
2.
3.
4.
5.
Graphical display is activated by the Graphical Output button. This will
cause a graph to be displayed following completion of this window. When
graphical display is active, an arbitrary title may be entered which appears
on the top line of the displayed graph. By default, graph scaling is adjusted
to match the required outputs. Press the Explicit Scaling button to allow
explicit minima and maxima for the graph axes to be inserted. Activating
this button makes the minimum and maximum boxes editable.
Hard copy is activated by the Enable Hard Copy button. The File name
box then becomes editable. If the output graphic file already exits and the
Replace button has not been activated, a ‘pop-up’ window issues a
warning. A choice of output graph plotting devices is given in the Device
list window. Clicking on the required device selects it. It appears in the
selection window above the Device list window.
The Text Output button activates writing to a text output file. The file
name may be entered in the editable File name box when Text Output is on.
The default file name ‘paper.txt’ may be set by pressing the button Default
file name. A ‘pop-up’ window issues a warning if the file already exists
and the Replace button has not been activated.
The adf04 File button activates writing of the full configured adf04-type 3
dataset to an output file. The file name may be entered in the editable File
name box. The default file name ‘…/pass/adas809_adf04.pass’ may be set
35
by pressing the button Default file name. A ‘pop-up’ window issues a
warning if the file already exists and the Replace button has not been
activated.
The graph is displayed in a following Graphical Output window.
ADAS810: Generate envelope feature photon
emissivity coefficient
The program calculates envelope feature emissivities of type ADF40 for an ion of a complex element.
The program is a foreground, interactive, version of the mass production, parallised background code
ADAS810_offline. The interactive version is designed for restricted sample testing and result display
prior to large scale excution. It requires the same driver data file types as the offline version, but
allows the user to modify some driver parameters. The interactive code can initiate the background
code although the usual practice is for launch of ADAS810_offline from the command line,
independently of IDL-ADAS, via a PERL script [see NOTES: below]
Background theory:
36
)B3(&
, is defined on a wavelength
An envelope feature photon emissivity coefficient, denoted by
interval and is a composite feature arising from very many lines from a single ionisation stage. The
is suitable as a descriptor in wavelength intervals and at spectral resolutions where the
individual component lines are unresolved or only partly resolved. This situation occurs with very
complex heavy element ions for which it becomes helpful and economical to handle the envelope
s). Following Chap 3.8, the
feature rather than the individual line emissivity coefficients (
emissivity of an individual line is specified as
)B3(&
3(&
M
ε j →k = A j →k ( ∑) jσ( exc ) N e N σ +
σ =1
M z +1
∑)
υ ′=1
( rec )
jυ ′
N e N υ+′ ) .
9.10.1
This allows specification of the excitation photon emissivity coefficient
3(&σ(,excj→)k
= A j →k ) jσ( exc )
9.10.2
and the recombination photon emissivity coefficient
3(&υ(′,recj→) k
)
= A j →k )jυ( rec
.
′
9.10.3
There are similar coefficients, namely, the charge exchange photon emissivity coefficient and the
ionisation photon emissivity coefficient, which are of less relevance here. Each of these coefficients is
+z
+ z +1
associated with a particular metastable σ or υ′ of the X , or X
ions respectively.
Consider
a
spectral
interval,
[ λ 0 , λ1 ] ,
subdivided
N pix
into
intervals
as
{ ∆λ [i 0 ,1 ] ≡ [ λ 0 + i( λ1 − λ 0 ) / N pix , λ 0 + ( i + 1 )( λ1 − λ 0 ) / N pix ] : i = 0,.., N pix − 1 } Also
ϕ j →k ( λ ) . In general,
suppose that the j → k spectrum line has a normalised emission profile
such a profile is a convolution of Doppler and instrumental functions. Then the envelope feature
photon emissivity coefficient vector is defined as
)[ 0 ,1 ]
)B3(&σ(,exc
i
=
λi +1
3(&σ(,excj→)k ∫ ϕ j→k ( λ )dλ
∑
j ,k
9.10.4
λi
λ j → k ∈[ 0 ,1 ]
λ j→k is the natural wavelength of the j → k spectrum line. The default broadening assumed is
Doppler with a Maxwellian distribution for the emitting ion at temperature, Tion , equal to the
electron temperature, Te , used in the collisional–radiative modelling of the
a minimum broadening.
functions as
)[ 0 ,1 ]
)B3(&σ( ,exc
i
3(& s.
This consitutes
The integral in equation 9.10.4 is then expressible in terms of error
=
∑ 3(&
( exc ) 1
σ , j →k 2
{ erfc(( λ i − λ j →k ) / σ )
j ,k
λ j → k ∈∆λ[i 0 ,1 ]
9.10.5
− erfc(( λ i +1 − λ j →k ) / σ )}
kT
m p me
⋅
where σ = λ j → kα ion ⋅
I
m
m
H
X
p
1/ 2
and m X is the emitting ion mass.
In actual spectral analysis involving complex heavy species, individual strong spectrum lines may be
distinguishable from the envelope. It is therefore appropriate to archive a restricted number of the
s and these can be identified and ordered as processing for the
s
strongest individual
takes place. Again, while passing through the complete set of radiative transitions for assignment to
3(&
)B3(&
)B3(& ( exc )
(z)
s , the line radiative power coefficient for the ion, PLT , can be totalled.
excitation
This total line power coefficient (archived in the data class ADF11, subcategory
), which is the
part driven by excitation for the ground or metastable levels of the ion, is a more precise estimate that
than computed by the code ADAS408 and so is a preferred substitute for that data. For application to
3/7
(z)
actual measurements of total radiation emission, it is normally necessary to calculate PLT as
modified by appropriate soft x-ray and /or bolometer filter transmission functions. Such modification
(z)
can not be done retrospectively on the unfiltered PLT . In contrast, the
)B3(& ( exc )
is suited to
37
further processing which can include imposition of spectrometer instrument functions as well as
filtering and integration over extended wavelength regions. Such additional operations on
s
are treated as separate from ADAS810 and are handled in a new interrogation code for
s,
ADAS510, complementing ADAS503. Note that preparation of filters is provided by the codes
ADAS414 and ADAS415. It is also assumed that this is the route for preparation of higher precision
)B3(&
)B3(&
(z)
filtered PLT s and requires the initial creation of appropriate
code.
)B3(& s via the present ADAS810
3(& ( rec )
In like manner,
s can be produced, provided the input data (ADF04) supports this. Note
that for ease and consistency in modelling, the same spectral intervals apply to both the
)B3(& ( exc ) s and the 3(& ( rec ) s and to each of the metastable drivers – if more than one. Also,
the selection of the strong individual 3(& s is determined from the whole ground excitation driven
set and the selected set is then used for all other metastable drivers and for recombination. The rank
ordering of individual 3(& s is from the maximum of each 3(& viewed as a tabular function of
Te and N e .
Note finally that
)B3(& s are tabulated as a function of selected wavelength range, wavelength
interval bin, Te and N e with Ti = Te .
Program steps:
)B3(&
It is noted again that the code is designed to allow single ion testing of
production. The
primary intent is nonetheless mass production and so the interactive code ADAS810 makes use of the
driver data sets and file naming conventions of the mass production codes. Thus, as ADAS810 is in
essence a variant of the population code ADAS208, as well as direct selection of an ADF04 file, the
data set selected on the INPUT screen may be a driver data. The driver files for this application are of
format ADF42. The relevant pathway is /…/adas/adf42/iso_nucl/<element>/. The primary
parameter settings for operation of ADAS810 are contained in the driver, which must be copied to the
equivalent user area and edited directly to modify operation. The driver structure is shown in the
illustration below.
Note the various file pathways (lines 2-4) which include the input ADF04 file and then the output
,
and
files. In interactive operation, ADAS810 allows re-specification of
some parameters such as wavelength intervals, temperatures etc. (on the processing screen and of
output file routing (on the output screen) ) overiding the adf42 driver file. All other parameters are
predetermined or set in the driver file. Note the use of namelists where possible in the driver file
structure
3/7 3(&
)B3(&
&FILES
dsn04
dsn18
dsn35
dsn15
dsn40
dsn11
dsn11f
&END
=
=
=
=
=
=
=
&ION
element
z0
z1
ip
&END
'/home/adas/adas/adf04/adas#6/mom97_ls#c2.dat',
'NULL',
'NULL',
'test_adf15_pec.dat',
'test_adf40_fpec.dat',
'test_adf11_plt.dat',
'test_adf11_plt_filter.dat'
=
=
=
=
'C',
6,
2,
386241.0
&META
nmet
= 1,
imetr(1) = 1
&END
&PROCESS
liosel = .FALSE.,
38
lrsel
lisel
lnsel
lhsel
lpsel
zeff
&END
&OUTPUT
lmetr
ltscl
ldscl
lbrdi
numte
numtion
numth
numdens
numdion
numwvl
&END
=
=
=
=
=
=
.FALSE.,
.FALSE.,
.FALSE.,
.FALSE.,
.FALSE.,
0.0
=
=
=
=
=
=
=
=
=
=
.FALSE.,
.FALSE.,
.FALSE.,
.FALSE.,
5,
0,
0,
5,
0,
3
1.800e+04 4.500e+04 9.000e+04 1.800e+05 4.500e+05
1.000E+11 1.000E+12 1.000E+13 1.000E+14 1.000E+15
64 1.500e+00 3.00e+00
32 1.000e+01 1.00e+02
32 4.500e+02 8.00e+02
Interactive parameter comments:
The file selection window is as shown below
5. Two primary files are required, namely an adf04 for the ion whose spectral
line and envelope emissivities are required, and a driver file of format
adf42. The latter is optional and provides conditions of electron
temperature and density, spectral ranges etc. This driver file maintains
compatibility of operation of the interactive ADAS810 with the automatic
offline mass production codes. Data from the driver fills the editable fields
in on the following Processing window. Otherwise they mauts be edited in.
6. Note that each type of data is stored according to its ADAS data format
(adf number). adf42 is the appropriate format for use by the program
ADAS810. Your personal data of this type should be held in a similar file
structure to central ADAS, but with your identifier replacing the first adas.
7. Available sub-directories are shown in the large file display window.
Scroll bars appear if the number of entries exceed the file display window
size Click on a name to select it. The selected name appears in the smaller
selection window above the file display window. Then the individual
datafiles are presented for selection. Datafiles all have the termination
.dat.
8. Once a data file is selected, the set of buttons at the bottom of the main
window become active.
9. Clicking on the Browse Comments button displays any information stored
with the selected datafile. It is important to use this facility to find out
what has gone into the dataset and the attribution of the dataset. The
possibility of browsing the comments appears in the subsequent main
window also. Clicking the Done button moves you forward to the next
window. Clicking the Cancel button takes you back to the previous
window.
10. An extra button, Expansion and filter files, is present. Click it to pop-up a
supplementary file selection window shown below. These supplementary
files may be included, if available, to extend the population and emissivity
calculation, paralleling the selections available in ADAS208.
39
1
2
3
4
6
5
11. On the upper sub-window, an expansion file may be selected. This is the
same expansion file as used by ADAS208 and is drawn from the crossreferencing file subclass adf18/a17_p208.
12. On the lower sub-window, a filter file of format adf35 may be selected.
ADAS810 provides total radiative power and filtered power as well as the
line and envelope emisisvities.
40
7
7
The processing options window has the appearance shown below:
1. An arbitrary title may be given for the case being processed.
2. For information the full pathways to the datasets being processsed are also
shown. The button Browse comments again allows display of the
information field section at the foot of the selected dataset, if it exists.
3. The main inputs follow that those of ADAS208. Your settings of electron
temperature, ion temperature and neutral hydrogen temperature are shown
in the temperature display window. The temperature values at which the
excitation rate coefficients (in fact ‘upsilons’) are stored in the selected
adf04 (input) are also shown for information. The program obtains the
output from the adf42 driver file if available. A similar pattern is shown in
the Density sub-window although there is no ‘Input’ from the adf04 file.
41
4.
5.
Selection of Default temperatures is somewhat different from the usual
ADAS pattern. A drop-down menu allows choice from a number of
favoured sets, such as the GCR Standard set
Selection of metastables is done from a scrollable button list rather than a
pop-up.
1
2
3
4
6
5
7
8
6.
7.
8.
Wavelength ranges and associated pixels are specified in an editable table.
The set of control parameters for the calculation follows ADAS208.
The Normalisation option should be chosen when there is only a single
metastable..
The output options window is as shown below
1. The Text Output button activates writing to a text output file. The file
name may be entered in the editable File name box when Text Output is on.
A ‘pop-up’ window issues a warning if the file already exists and the
Replace button has not been activated.
2. The PEC (adf15) file comprises the set of individual line emissivity
coefficients.
42
1
2
3
4
5
3.
4.
5.
. 3
The Feature PEC (adf40) file comprises the envelope feature data for each selected wavelength
interval and each metastable, tabulated in pixel space as a function of temperature and density .
The Total power (adf11/plt) unfiltered file comprises the total radiated power in the spectral
intervals.
The Total power (adf11/plt) filtered file comprises the radiated power in the spectral intervals as
transmitted by the filter specified in the input filter file – if selected.
Notes:
43