1
SVAN 106 User MANUAL
_
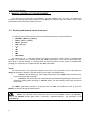
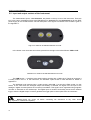
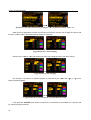
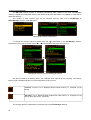
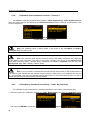
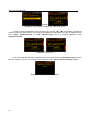
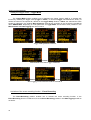
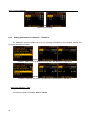
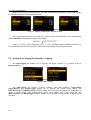
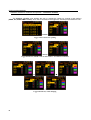
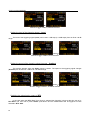
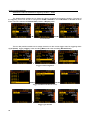
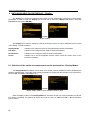
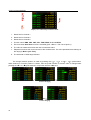
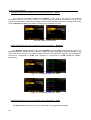
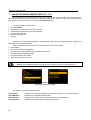
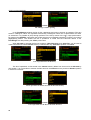
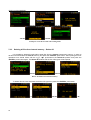
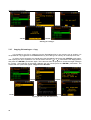
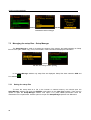
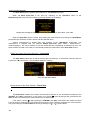
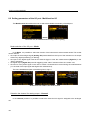
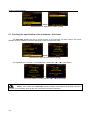
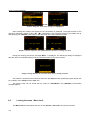
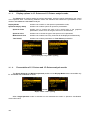
Displays in Single Spectrum view for 1/1 Octave and 1/3 Octave function
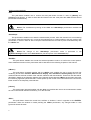
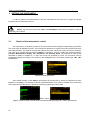
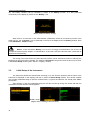
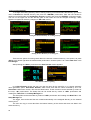
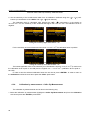
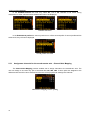
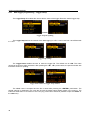
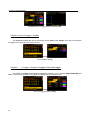
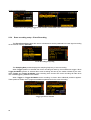
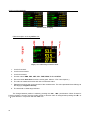
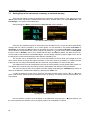
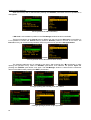
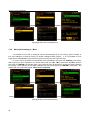
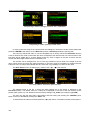
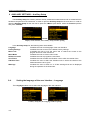
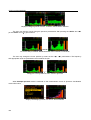
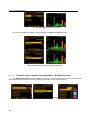
The user may shift the Y-axis during the spectrum presentation after pressing the <Shift> and <5>
(or the <Shift> and <6>) push-buttons.
<Shift/6>
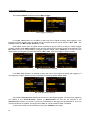
1/1 Octave analysis with the shifted horizontal axis in relation to vertical one
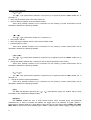
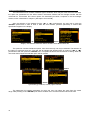
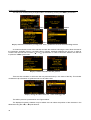
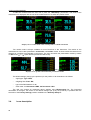
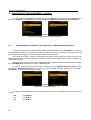
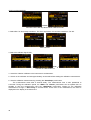
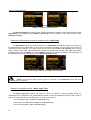
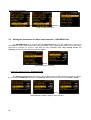
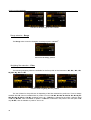
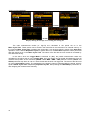
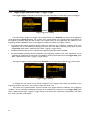
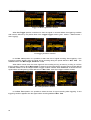
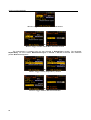
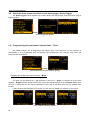
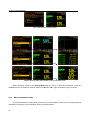
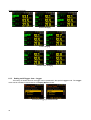
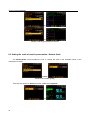
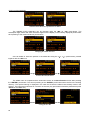
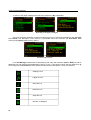
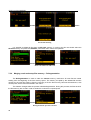
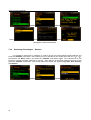
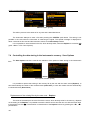
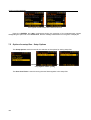
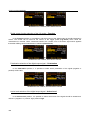
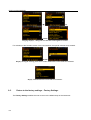
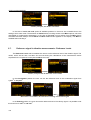
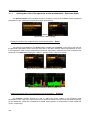
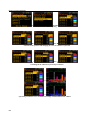
The user may change the cursor position by means of the <3>, <4> push-buttons. The frequency
and appropriate value are presented in the line below the plot.
<4> ...
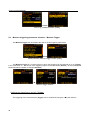
Change the cursor position for the 1/1 Octave spectrum
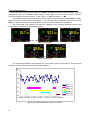
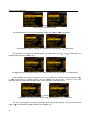
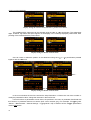
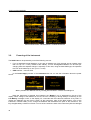
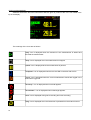
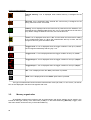
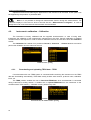
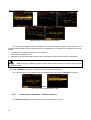
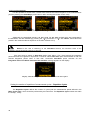
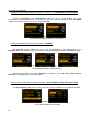
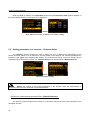
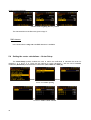
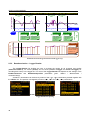
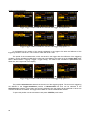
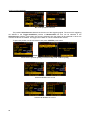
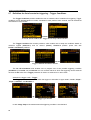
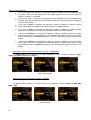
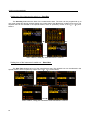
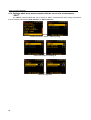
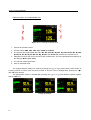
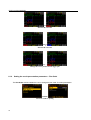
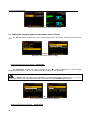
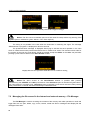
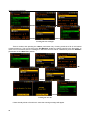
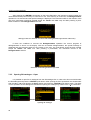
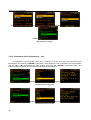
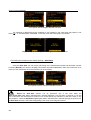
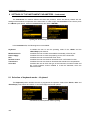
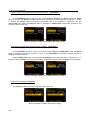
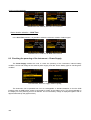
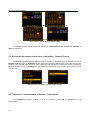
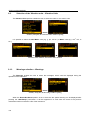
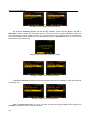
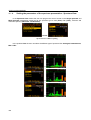
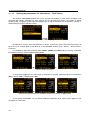
When Multiple spectrum mode is switched on the measurement screen in Spectrum visualisation
mode is like below.
=>
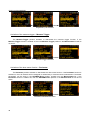
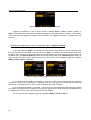
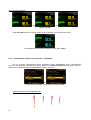
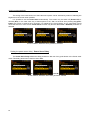
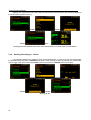
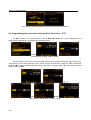
Displays in Multiple spectrum view for 1/1 Octave function
125