1
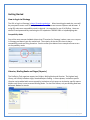
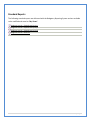
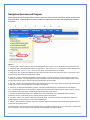
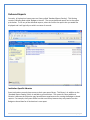
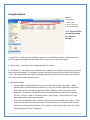
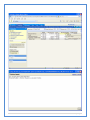
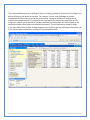
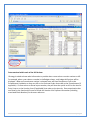
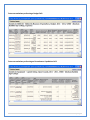
Budgetary Reporting System For Executive Users ProClarity Web Reporting Training Guide Version 3.1 4/21/2011 BOARD OF REGENTS UNIVERSITY SYSTEM OF GEORGIA Office of Fiscal Affairs 270 Washington Street, SW, Atlanta, Georgia 30334 | (404) 656-3392 Internet Address: http://www.usg.edu/fiscal_affairs E-mail Address: [email protected] Table of Contents Table of Contents .................................................................................................. 2 Introduction .......................................................................................................... 3 Glossary ................................................................................................................. 4 Getting Started ...................................................................................................... 7 Standard Reports .................................................................................................. 8 Navigation Overview and Diagram ....................................................................... 9 Using the System ................................................................................................. 11 1) Using Page Slicers/Filters … Using the Navigation Tab ............................... 16 2) Using Breadcrumbs ..................................................................................... 16 3) Drill to another Dimension ......................................................................... 17 4) Drill to Detail ............................................................................................... 22 5) Export to Excel ............................................................................................ 29 6) Enhanced Drill Capabilities – Reporting Services........................................ 34 7) “Hide and Show Only” Features… Using the Navigation Tab ..................... 48 8) Using the View Tab (Charts vs. Reports) ..................................................... 51 9) Using the Sort Tab....................................................................................... 67 10) Using the Filter Tab ..................................................................................... 73 11) Using the Filter Tab (Rankings & Exceptions) ............................................. 75 12) Running your own Custom Reports – “My Views” ..................................... 82 2|P age Introduction Budgetary reporting has become increasingly more important and complex, especially in these times of continued budget reductions and economic uncertainty. These challenges, coupled with the growing need for more formalized information and analysis, introduces a need for additional tools to be provided to our University System of Georgia institutions so that financial information can be reviewed and analyzed by institutional management in an expeditious and meaningful manner. While the PeopleSoft financial system is our system of record and satisfies the majority of our reporting needs, we are pleased to provide a new tool for your use. This “out of the box” product, which combines iStrategy Solutions with the ProClarity Web Reporting tool, integrated with PeopleSoft Financials, will enable intuitive self-service and analysis of institutional information through an application that is both secure and robust. The Budgetary Reporting System framework will permit guided analysis through key performance indicators, visualization components and interactive reports and will provide consistent information and metrics to all institutional users. These reports will assist in providing insights to institutional personnel on what has occurred historically as well as information to proactively address emerging campus financial needs. The system also will provide an opportunity to use advanced analytics to provide early warning detection of budgetary trends. We know that each of our GA First institutions has unique needs and requirements; therefore, this system provides a flexible, efficient framework to customize your reports and analysis. We believe this tool will provide an essential way in which your critical reporting needs can be supplemented and satisfied. 3|P age Glossary Apply Click this button to apply your selections to the view. When you click Apply, the process is run and the results are displayed. Backspace The “backspace” key on the computer keyboard. Breadcrumbs (Breadcrumb Navigation) A type of text-based web site navigation that breaks the site into links of categories and subcategories allowing major categories of information to be linked in a range of sequential order. Breadcrumb navigation is displayed in order to see exactly where that web page is located within the web site. Briefing Book A view or collection of views within the reporting tool, ProClarity. When you click a library , its Briefing Books replace the list of libraries. Briefing Books contain pages (reports) that can be further organized into folders. 1. In the Contents tab, open a Briefing Book by clicking its name or icon. If the Briefing Book contains folders , click a folder to display its contents. 2. Click a Briefing Book page . The page automatically displays in the Navigation tab. Combine Items Command used to aggregate the values of multiple members selected in a Background hierarchy. Dimension A structural attribute of a cube, which is an organized hierarchy of categories (levels) that describe data in the fact table. These categories typically describe a similar set of members upon which the user wants to base an analysis. For example, dimensions in our system include funds, departments, budget reference, vendors etc. Drill Down/Drill Up A technique for navigating through levels of data ranging from the most summarized (up) to the most detailed (down). Drill Down To The “Drill Down to” feature allows you to drill down on hierarchies that are not currently on rows or columns. For example, from a report based on Account, “Drill Down to” a further breakdown of Personal Services by Departments. 4|P age Drill to Detail To retrieve the detailed data from which the data in a cell was summarized. For example, drill to the journal lines that make up an expense value in a cell. Expand An analysis feature, similar to drill down, that displays more detail about an item while maintaining the current display of other items. For example, display the individual departments that roll-up to a College node in the Department Tree. Fact Value or measurement, which represents a fact about the managed entity or system. In iStrategy, a Fact would consist of a Journal or a voucher while the dimensions would be the chart fields that make up the journal and/or voucher. Export to Excel Capability in ProClarity that enables users to export the current Briefing Book or report view to Microsoft Excel. Hide An analysis feature that removes selected items from the current display of data. Library A group of Briefing Books, each of which contain one to several reports. Security is applied to Libraries to restrict access to institution reports. The Contents tab lists all of the libraries you have permission to open. To open a library, click the name of a library or its icon . Measures In a cube, a set of values that are usually numeric and are based on a column in the fact table of the cube. Measures are the central values that are aggregated and analyzed. Some examples of measures are Budget Amount, Encumbrance Amount, and Remaining Amount. Member An item in a dimension representing one or more occurrences of data. A member can be either unique or nonunique. For example, 1997 and 1998 represent unique members in the year level of a time dimension, whereas January represents nonunique members in the month level because there can be more than one January in the time dimension if it contains data for more than one year. 5|P age My Views A special Briefing Book used to save views for personal use. Pivot Slice A feature that flips data from Rows to Columns and vice versa to emphasize different comparisons. A subset of the data in a cube, specified by limiting one or more hierarchies by members of the hierarchy. For example, facts for a particular year constitute a slice of multiyear data. Slicer (AKA “Page Filters”) A drop-down menu that displays with a Briefing Book page (report) and contains members (or slices of data) that can be selected to filter the data in the page. For example, a slicer could be used to select the fund on which you want the report to display data. Tree PeopleSoft trees are used to store Hierarchical data such as Department, GL Account hierarchy, Fund codes, etc. Trees are widely used for reporting purposes. 6|P age Getting Started How to log in to iStrategy The URL to log in to iStrategy is https://frweb.usg.edu/pas. When launching the web site, users will be prompted to enter a user ID and password. Note – Please use Internet Explorer web browser. If using IE8, make sure compatibility mode is selected. An example of a user ID is BI\JDoe. Users can obtain IDs and passwords by contacting the ITS helpdesk at 706-583-2001 or [email protected]. Compatibility Mode One of the most common helpdesk tickets that ITS receives for iStrategy is when a user runs a report in iStrategy and doesn’t get any results back. The majority of the time this issue is due to compatibility mode not being turned on. See the screen print below for an example of how to turn on compatibility mode. Libraries, Briefing Books and Pages (Reports) The ProClarity Tool organizes reports into Folders, Briefing Books and Libraries. The highest level, Library, will initially include a single, Standard Report Catalog. In future phases, institution specific Libraries can be added with access secured by institution to limit access to institution specific reports. Within each Library is one to several Briefing Books. For the Pilot Rollout, only one Briefing Book was delivered: Budget to Actuals. 7|P age Standard Reports The following standard reports are delivered with the Budgetary Reporting System and are available to be modified and saved to “My Views”: Budget to Actuals - Expenditures By Acct Budget to Actuals - Expenditures By Dept Budget to Actuals - Expenditures By Fund Budget to Actuals - Revenues 8|P age Navigation Overview and Diagram When browsing the iStrategy online system, users can select several options to review, analyze and download data. Navigating the system provides the opportunity to learn more about the features delivered. 1 2 3 4 5 6 8 10 9 7 Figure 1: 1. Contents Tab – Where Institution Library and Briefing Book(s) are stored. User’s ‘My Views’ are accessed here also. 2. Navigation Tab – First tab displayed when running reports. This is where user’s can drill down to other dimensions on existing report data. Important note – this is the only screen where Drill Actions are available. 3. Data Layout Tab – Screen that displays the report layout as well as all criteria used by the report. This section is also used to change dimensions and measures for reports. 4. View Tab – Used to add charts and graphs to existing reports. You can also add or remove subtotals to rows and `columns in this section. An important feature here is the Flatten Row Headers/Flatten Column Headers which can be used to make reports easier to view by removing multiple layers for chart fields. 5. Sort Tab – Used to sort report data based on the existing measures in the report. Preserve peer groups maintains the integrity of the tree structure within the report when sorting data. 6. Filter Tab – Provides advanced filtering options. Examples include filtering by top 5 departments over Budget. Note – by default all reports are set up here to Hide Empty Rows (Rows with no data using the report criteria). You can turn on/off the Hide Empty Rows and Hide Empty Columns filtering in this section. 7. Standard /or Professional Report Tool – Default access here is Standard. Only Administrators have access to Professional access. Professional access is used to develop system-wide reports. 8. My Views – Where user-specific customized reports are saved. The data contained in the ‘My Views’ reports are updated nightly just like the reports in the Institutional libraries. 9. Library – Where Institution-specific reports are accessed. Reports are typically located within briefing books that are accessed in the Libraries section. 10. Breadcrumbs - Links back to each previous page the user navigated through to get to the current page. Breadcrumbs are very useful if a user mis-clicks an item and need to navigate back to a previous screen. 9|P age Delivered Reports Currently, all Institutions have access to a Library called ‘Standard Report Catalog’. This Catalog contains a Briefing Book called ‘Budget to Actuals’. The current delivered reports are in the screen print below. To run any of the delivered reports, select the link for the report that you would like displayed and it will typically run within a matter of seconds. Institution Specific Libraries Some Institutions currently have access to their own report library. This library is in addition to the ‘Standard Report Catalog’ which is available to all Institutions. The reason for these additional libraries is because the Institution may have different requirements for running the Budget to Actual reports. For example, the System Office has their own library because they may need to see the Budget to Actual data for all Institutions in one report. 10 | P a g e Using the System Figure 2: 1. Page Filters 2. Report Body 1 3. Drill to Dimension 4. Expand/Drill Mode 2 3 NOTE: Figure 2 will be the reference image for exercises 1 through 7. 4 1. Page Filters – Used to quickly modify the report to run for different criteria. A good example of this is changing the Budget Reference from 2011 to a prior year to view fiscal years. 2. Report Body – Information that is displayed within the report. 3. Drill Down To – Very useful tool that allows users to quickly view a different dimension of the data that is currently displayed. For example, the user can select Personal Services and the Drill Down to ‘Fund’. The report would then display the Budget to Actual Personal Services account data by Fund. This can be used for other dimensions also. 4. Expand/Drill Mode o Expand Mode is designated by the (+) sign next to the Row values in the report. When expand mode is selected and users select the (+) sign, the row will display the next level of data based on the tree used to populate the Row in Addition to all of the current rows displayed. For example, if Personal Services is expanded then the user will see ‘Personal Services – Faculty’ as well as ‘Personal Services – Non-Faculty’. They will also see Travel, Operating Expenses and Equipment data. o Drill mode is designated by the up/down arrow next to the Row values in the report. If Drill down mode is selected and the user selects ‘Personal Services’, all of the Personal Services information is displayed but the user can no longer see other report information for ‘Travel’, ‘Operating Expenses’ and ‘ Equipment’. 11 | P a g e Expand Mode Drill Mode 12 | P a g e Save to My Views - When this icon is selected the user will be prompted to Name the Report and the report will then be saved in the user’s ‘My Views’ section under the Content tab. The data contained in the ‘My View’ is updated daily but the format will remain unchanged. Print Report - When this icon is selected, user will be prompted to set up print options and can name the report if needed. Note – this option prints the current view of the report displayed in screen print above. Export to Excel - Exports the current page to excel in spreadsheet format. The user can then resort and filter the report as needed as well as save the report to the user’s computer. Email Report - When this icon is selected the user will be prompted to save the report as a my view (if not already saved). Then a link for the current report will display in the user’s e-mail client which can then be sent to other users to open. When a user selects the link to open the report they will be prompted to login with their user id and password and then the report will display as long as the user has the correct security in iStrategy. Help - When the help icon is selected another window will display helpful information. This Help information screen does include an index and search tab so the user can find out more information on the desired topic. Examples include Using a Slicer, Displaying data in Charts, and Saving My Views. 13 | P a g e Use of Trees in iStrategy PeopleSoft trees are fed to iStrategy as part of the nightly ETL process. The tree information is used to display the Hierarchical data in iStrategy. The tree data that is currently sent over to iStrategy is listed below: o System Office Maintained Trees o Account o Fund o Class o Program o Business Unit o Institution Maintained Trees o Department o Project Example of a Tree in PeopleSoft: 14 | P a g e Example of Tree Values in iStrategy: Note – All account values that are not listed in the PeopleSoft Account tree are categorized as “Not in Hierarchy” in iStrategy. This can be used as a powerful audit tool to quickly identify entries in the system that are not currently part of the chart of accounts. 15 | P a g e 1) Using Page Slicers/Filters … Using the Navigation Tab a) b) c) d) Run the “Budget to Actuals - Expenditures By Acct” report to display default report view. Click on Slicer/Page Filters to see list of Dimensional “slices” available in report. Select specific value from list to re-run report for selected “slice” of information. Expected Result: return data for selected slice. 2) Using Breadcrumbs a) Use the “Breadcrumbs to return to the Expenditures By Acct” report. i) Other options include the “Backspace Key” on the keyboard or the “Back” arrow Internet Explorer. in b) Expected Result: User will be directed back to the Budget to Actuals – Expenditures by Acct report. 16 | P a g e 3) Drill to another Dimension Drill to another Dimension is one of the best features of iStrategy. Within just a matter of seconds users can run a report for all expenses and then quickly see what funds make up the Budget, Encumbrances and Actual amounts for Travel, for example. This can be done for any of the other dimensions also – Department, Program, etc. Below are some examples showing this functionality. Drill to Dimension examples: Identify row of report for Drill down to another dimension, and click on the “dimension row name” (Select: “Travel”) a) Click on “Drill Down To…” select box in the Navigation frame to the left and select the dimension for drill down (Select: “Department - undefined”) b) Expected Result: In this example, iStrategy would display the dollars for Travel in the new dimension of Departments. 17 | P a g e c) You may need to click on the (+) sign next to the Row values to expand the row and see all departments. (See #4 – Expand/Drill Mode on Page 11). 18 | P a g e Use the breadcrumbs to go back to the Budget to Actuals – Expenditures by Acct report. Note – We know that this data is for Budget Reference 2011 based on the slicer at the top of the screen. For this example, change the slicer to Budget Ref 2010 (if needed). 19 | P a g e Identify a row of report for Drill down to another dimension, and click on the “dimension row name” (select: “Operating Expenses”) a) Click on “Drill Down To…” select box in the Navigation frame to the left and select the dimension for drill down (Select: “Calendar Fiscal – All Fiscal Periods”) b) Expected Result: rows will now display all Operating Expenses for Budget Ref 2010 for all Fiscal Years that make up the report data. 20 | P a g e 21 | P a g e 4) Drill to Detail Drill to detail is another very helpful tool that allows users to quickly see the data that makes up any number located within a report. It is important to understand what data can be drilled and what data cannot be drilled. Use the breadcrumbs to go back to the Budget to Actuals – Expenditures by Acct report. In this example, all data in the Budget, Open Encum, and Actual Columns can be drilled. The data located in the Remaining Budget and Budget Utilized columns cannot be drilled. Why is this? The Remaining Budget and Budget Utilized are calculated based on the information located within the other cells. For example, to identify the Remaining Budget for the 2011 Budget Reference, a formula would be necessary: “Budget – (Open Encum + Actual) = Remaining Budget”. On the other hand, there is no formula for the Budget data. That data is made up of budget journals so we can drill on that information. If a user highlights a field in the Remaining Budget column and tries to drill on this information they will notice a couple of things. 1) The drill actions on the bottom left of the screen are empty 2) If the user selects Drill to Detail for the number they will get the error message “Error Accessing Drill To Detail Information. Remaining Budget in dimension Measures is a calculated member.” 22 | P a g e 23 | P a g e The recommended approach for drilling on data is to always go down to the lowest level of detail first before drilling into the detail for the data. For example, if a user runs the Budget to Actuals – Expenditures by Dept report they see the results below. Instead of drilling on President which contains many department ID’s it is best that the user Expand the section they would like to drill using the (+) button just to the left of President and then performing their drill action based on the departments where they need more detailed information. This accomplishes a couple of things: 1) the user doesn’t have to filter through large amounts of data to get the information they want, and 2) the results come back quicker, resulting in improved performance. 24 | P a g e Data contained within each of the Drill Actions iStrategy is coded to know what information to provide when a user selects a certain number to drill. For example, when a user selects a number in the Budget column, only budget drill actions will be displayed. When an Encumbrance number is selected users will have the option to Drill on the Encumbrance Liquidation or they can drill on the Purchase Orders that make up the Encumbrances (if applicable). If a user selects an Actual report number, they will have the option to drill on the Journal Entry Lines or on the Voucher Lines (if applicable) that make up the journals. One customization that was done for the Voucher drills was to include the Voucher Line Payment Information (including associated Check Number) for the users reference. 25 | P a g e Data returned when performing a Budget Drill: Data returned when performing an Encumbrance Liquidation Drill: 26 | P a g e Data returned when performing a Purchase Order Drill: Data returned when performing a Journal Entry Lines Drill: Data returned when performing a Voucher Drill: 27 | P a g e Note: i) You can only “Drill to Detail” on stored transactional data….drill to detail cannot be performed on calculated measures such as Remaining Balance or Budget Utilized ii) The records selected are based on the transactional data in the report view, not measure (calculated) values. iii) The Actions available will vary depending on data type (Budget, Open Encum, Actual) iv) “Drill to Detail” is not the same as “Drill Down To”. “Drill to Detail” will always provide transactional data that supports the report data. “Drill Down To” will always provide the user the ability to view the data from a different perspective (ex. Show travel (6xxxxx) encumbrance data by associated Fund Codes) v) Note: The drop-down box feature … Question: “Each time I select a number a drop-down box appears. When should I use this feature?” Answer: “Never”. Always select the appropriate link in the “Actions” area (on the left side) for drill-down information. “Drill Journal Entry Lines” gives all the detail that makes up the Actual number, including P-Card entries, payroll journals, etc. “Drill Voucher Lines” only gives the detail for transactions that were paid by using a Voucher in the AP system. 28 | P a g e 5) Export to Excel All drill actions allow you to export the data to Excel. To export the data to excel, select the link at the top right of the screen (example below). The user will be prompted to either Open the file, Save the file, or Cancel the request. If the user selects open, the first time they may be prompted to confirm the file is from a trusted source. If they select ‘yes’ then the file will open in an Excel format. Once the data is in excel, the user can sort, filter and format the data any way they prefer. 29 | P a g e Note: In the example below, note column C displays the journal date as 00:00.0. To correct this issue, highlight the column and then right-click and select format cells. Then select ‘Date’ and then ‘OK’ and then the cells are displayed in the date format. 30 | P a g e 31 | P a g e Note: i) Currently, the “Export to Excel” feature only loads the first 1000 rows of data. If the retuned data is more than 1000 rows, select to “get all rows” of the data in the drill-down, then perform the following steps: (1) Select All (Ctrl + A) (2) Copy (Control + C) (3) and then open Excel and paste (Ctrl + V). ii) You can only “Drill to Detail” on stored transactional data…“Drill to Detail” cannot be performed on calculated measures such as Remaining Balance or Budget Utilized 32 | P a g e iii) The records selected are based on the transactional data in the report view, not measure (calculated) values. iv) The Actions available will vary depending on data type (Budget, Open Encumb etc.) v) “Drill to Detail” is not the same as “Drill Down To” (See page 28, item ‘iv’ in the Note). vi) Note: The drop-down box feature … Question: “Each time I select a number a drop-down box appears. When should I use this feature?” Answer: “Never”. Always select the appropriate link in the “Actions” area (on the left side) for drill-down information. vii) “Drill Journal Entry Lines” gives all the detail that makes up the Actual number, including P-Card entries, payroll journals, etc. “Drill Voucher Lines” only gives the detail for transactions that were paid by using a Voucher in the AP system. 33 | P a g e 6) Enhanced Drill Capabilities – Reporting Services Enhanced Drill Capabilities Base Drill Actions Report Data Drill Journal Entry Lines Drill Voucher Lines Enhanced Drill Actions Report Data Journal Data Sub-Ledger Data AP Vouchers, PERS_SERV_BOR 8 Compared to the standard reports in the ProClarity application, the Reporting Services Tool provides a Budget Progress Report that more closely resembles the one in PeopleSoft. In ProClarity, there are restrictions that will not allow reports to run that provide All Accounts, All Departments, All Funds, All Classes, etc., side by side in a row. The Reporting Services tool is ideal for displaying data in that format. Possibly the biggest benefit of Enhanced Drills is that you can drill multiple times on some data as you will see in the examples covered in this training guide. 34 | P a g e Enhanced drills The examples below are taken using ABAC (57000) data but feel free to follow along using your business unit’s data here. Run the “Budget to Actuals – Expenditures by Account Report.” Select the (+) next to the Travel category to expand the row. Select amount $269,473 and to the left side under the “Actions” section the user sees two options – 1) Drill Budget and 2) Drill Enhanced Budget. Note – Any time you see the word Enhanced in iStrategy it is referring to a Reporting Services Tool drill action. Select the drill action “Drill Enhanced Budget.” The user is prompted to login again. (Note – This is temporary as currently the ProClarity application and the Reporting Services Tool are on two separate servers. In the near future, these applications will be on the same server and users will not have to enter ID’s and passwords multiple times). Enter ID and password (Ex. Bi\jdoe, password). Once the password is entered the user will be directed to the Enhanced Drill for Budget. 35 | P a g e 36 | P a g e There are several key features to Note: 1) Drop-down slicers at the top of the report. Users can now run the report for all Funds or select Fund Code 10500 and just get the information for that Fund. The same goes for the Account and Department slicers. 37 | P a g e 2) Options to hide or show accounting information are available by clicking on the checkbox with the (+) or (-) signs next to the “Show Accounting Information” in the heading. 38 | P a g e 3) Search/find functionality. If the user types the word “Offset” in the box next to the “Find” section, the reporting tool will search to find the closest line that contains the word ‘‘Offset”. Also the “Next” button will show the next line where the word “Offset” is displayed. This can be really useful to find a certain Journal ID or Purchase Order. 39 | P a g e 4) Export functionality – You can export to multiple formats including PDF, Excel and Word. Select the desired format from the drop-down menu and Click on “Export.” 40 | P a g e 5) Print functionality 41 | P a g e 42 | P a g e Closing the Reporting Services Enhanced Drill window will direct the user back to the original ProClarity report. Select an Open Encumbrance amount and then select the “Drill Enhanced Encumbrance” option. 43 | P a g e Note – The user now has the option to select the Purchase Orders that make up the encumbrance amount and get more detail on them. For example, if the user selects PO ID 0000400822 they will be directed to another screen within reporting services that provides all of the detail around that PO, including line number, description, entered by, approved by, posted status, etc. 44 | P a g e Closing the Reporting Services Enhanced Drill window will direct the user back to the original ProClarity report. 45 | P a g e Select an Actual amount and then select the “Drill Enhanced Journal.” 46 | P a g e The user now has the option to do a second drill showing Payroll Information by clicking on the “Payroll Details” link. Note – Payroll Details includes detailed payroll information by employee, so a screen print of this is not included in this training guide. Also, for Institutions who do not want this data displayed in iStrategy, ITS has the ability to secure Payroll information by hiding the payroll details link using delivered iStrategy security. This can be requested when setting up new users or updating existing users in iStrategy. Below are some of the fields available when clicking on the “Payroll Details” link. • Transaction ID • Employee ID • Employee Name • Position Number • Account Code • Expended Amount • Journal Date • Description • Check Number As with the other enhanced drills, all of the functionality mentioned previously (export, print, find, show accounting information) also exists for the ‘Enhanced Journal Drill’. 47 | P a g e 7) “Hide and Show Only” Features… Using the Navigation Tab a) Run the “Budget to Actuals - Expenditures By Dept” report to display default report view. b) To Isolate or Remove a Column or Row Member from the Report. i) Click on the Column or Row Name. ii) Click on the “Show Only” or “Hide” box in the Navigation frame to the left (You may get a message “The hide operation may take a long time to complete. Would you like to run the query?” Select “OK”). Note: When hiding rows, grand totals will be affected. However, when hiding columns, totals will not change. 48 | P a g e All columns and rows 49 | P a g e Hidden rows – totals change Hidden column – totals do not change iii) To “Unhide” press the “Backspace” key on your computer keyboard. Note: This option only works once, immediately after the first change. It does not work for subsequent changes. iv) Expected Result – selected member will be isolated or removed from the report. 50 | P a g e 8) Using the View Tab (Charts vs. Reports) a) Run the “Budget to Actuals - Expenditures By Fund” report to display default report view. b) Click on the View tab (Figure 1, Page 9 - #4). c) Select the type of view “Grid and Chart” in the View frame to the left. Note – Users have the option to select Grid only (Default view) or Chart only also. 51 | P a g e d) Select the type of chart “Pie chart” e) Expected Result : report will redisplay in selected view type 52 | P a g e 53 | P a g e Let’s customize this report. In this example, we would like to see the Actual Expenditures by all Funds for Budget Reference 2010 in a Horizontal Bar Chart. It is important to note that all iStrategy functionality in this training guide applies to charts as well as grid reports. f) Select the “Actual” Column in the report and select “Show only”. Expected results are below. 54 | P a g e 55 | P a g e g) Select the “Education and General” row and select “Show only”. Expected results are below. 56 | P a g e 57 | P a g e h) Click on the (+) Symbol to the left of “Education and General.” Expected results – All Education and General Funds will be displayed in the grid report and reflected in the Chart. Expected results are below. 58 | P a g e 59 | P a g e i) Optional – User has the option to remove the Column Grand Totals by unchecking the check box to the left of the “Column Grand Totals” in the Grid Options section. By default, iStrategy will always display the Column Grand Totals for this report. 60 | P a g e j) Note that the chart still shows “Education and General” as well as the Fund codes that make up the Education and General Fund. In this example, we don’t want to see the “Education and General” heading. To remove the heading, highlight “Education and General” and select “Hide”. Note – The user may be prompted with a screen that lets them know this operation may take a long time. If this displays, select “OK”. This operation should not take more than a couple of seconds. 61 | P a g e 62 | P a g e k) The Fund data is now displayed in the Grid and Chart. Use the slicer at the top to change the “Budget Reference” to 2009. Expected results – the Grid and Chart data changes accordingly to the Budget Reference selected. 63 | P a g e 64 | P a g e l) To view this chart as a Bar Chart (Horizontal), select the “Bar Chart (Horizontal)” option. Expected result – the chart should display as a Horizontal Bar Chart. See below. 65 | P a g e m) Now that we have the report looking exactly like we want it, we are going to save the report and chart to “My Views” by selecting the ‘Save this page to my views’ icon to the topright of the report screen. Expected results – User will be prompted to save the report and can then access the report from their “My Views” section any time in the future. 66 | P a g e 9) Using the Sort Tab a) Run the “Budget to Actuals – Expenditures By Dept” report to display default report view. b) Click on the (+) sign to the left of one of the departments until you reach the department id level. Example: President c) Click on the Sort tab (Figure 1, Page 9 - #5). d) Select the column for sorting in the Sort frame to the left (drop-down menu -select “Budget”). Note – Users will not see any of the sort options until after they select an option from the “Sort” drop-down box. Once a sort option is selected then the user will have the option to select how they would like to sort the report data. e) Select High to Low, or Low to High. f) Click on “Apply”. g) Expected Result: Rows will be sorted based on the column and options selected. 67 | P a g e The report is now sorted by Budget from highest budget to lowest budget. 68 | P a g e To maintain the integrity of the tree structure (President and all departments that roll up to President) check the box to the left of “Preserve Peer Groups” and re-click the “Apply” button. 69 | P a g e Expected results are below. 70 | P a g e h) To remove the sorting, select “No Sort” from the Sort drop-down menu and click “Apply.” 71 | P a g e Expected results are below. 72 | P a g e 10) Using the Filter Tab By default, iStrategy will hide all empty rows on the Budget to Actual reports. In this example, there are fund codes that do not have any data against them for the criteria used in this report. Uncheck the check box next to “Hide Empty Rows” to show all funds regardless of whether there are any journal entries against those funds or not. As one could imagine, this could get pretty sticky and impact performance if we were to show all values for certain chart fields (ex. Acct, dept). a) Run the “Budget to Actuals - Revenues” report to display default report view b) Click on Filter tab (Figure 1, Page 9 - #6) c) Uncheck the “Hide Empty Rows” box and select “Apply”. Note – The apply button is grayed out until the user selects the checkbox to change the Hide Empty Rows/Hide Empty Columns criteria. Expected Result: report will redisplay with Empty Rows and/or Columns unhidden. Empty rows hidden 73 | P a g e Showing empty rows 11) Using the Filter Tab (Rankings & Exceptions) a) Run the “Budget to Actuals - Expenditures by Department” report to display default report view. b) Change the Budget Reference slicer to view 2010 data 75 | P a g e c) Click on the Filter tab (Figure 1, Page 9 - #6) d) Click on Filter 1 and select a filter type “Top”. The filter is based on two general filter types: i) Top and Bottom are relative selections or rankings (i.e., select the top/bottom x members or % of members based on criteria). ii) Above, Below and Between are absolute criteria for selection iii) Once you select the filter type, you will be able to select more criteria for the filter 76 | P a g e e) Select the “based on” dimension in the drop-down box. The drop-down box contains all the options for filters. Select “Budget”. Note: Use the scroll bar to view the entire drop-down list. Scroll to the top of the drop-down box 77 | P a g e f) By default, iStrategy is going to display the top 5. This value can be changed to display other amounts (i.e. 10, 20). When the filter criteria is complete, click the “Apply” button. Expected results – the report displays the top 5 Departments based on Budget. i) The “for” section is not used ii) Count, sum, and % filters are also available as options in the drop-down box. This example uses a Top 5 Count. 78 | P a g e To filter the report by Remaining Budget instead of Budget, change the report filter criteria “based on” option to “Remaining Budget” and click the “Apply” button. Now that the data is filtered, the user has the option of adding a second filter (sub-filter) if they prefer. g) To add second criteria, select Filter 2. To show only the filtered lines that have Actual amounts Greater than 10,000,000, use the following criteria for filter 2 i) Actual above 10,000,000 79 | P a g e 80 | P a g e h) Click the “Apply” button to run the report i) Expected Result: Report will be redisplayed with data based on the filter criteria. 81 | P a g e 12) Running your own Custom Reports – “My Views” On page 66 of the training guide the user is prompted to save a report to their “My Views” section. As a final exercise, please complete the steps below to access your “My Views” section. Note - The data contained in “My Views” reports is updated nightly just like the reports in the Institutional libraries. To List and Run “My Views” Reports. a) Click on the Contents tab (Figure 1, Page 9 - #1). b) Click on “My Views” (located next to Libraries) (Figure 1, Page 9 - #8). c) Click on the report name in “My Views” to run (Figure 1, Page 9 - #9). 82 | P a g e d) Expected result – The “My Views” report runs correctly showing the report created earlier. 83 | P a g e Conclusion: This Executive Training guide has covered navigating the iStrategy system, running basic reports, using slicers/filters, using breadcrumbs, drilling to other dimensions, drilling to underlying detail data, enhanced drill options, how trees are used in iStrategy, exporting data to excel, hiding rows/columns, sorting data, creating charts, filtering data and saving reports to “My Views”. NOTE: This training guide is a pre-requisite to the “Budgetary Reporting System for Power Users” class. The Power User Guide will contain more information about reporting methodology, customizing reports, changing dimensions, and creating slicers. 84 | P a g e BOARD OF REGENTS UNIVERSITY SYSTEM OF GEORGIA Office of Fiscal Affairs 270 Washington Street, SW, Atlanta, Georgia 30334 | (404) 656-3392 Internet Address: http://www.usg.edu/fiscal_affairs E-mail Address: [email protected] 85 | P a g e