1
5.0
4.5
4.0
Default TP (kg/ha/yr)
3.5
3.0
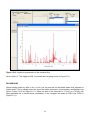
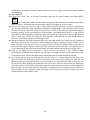
y = 0.318x + 0.3625
R² = 0.9291
2.5
2.0
1.5
1.0
0.5
0.0
0.0
0.5
1.0
1.5
2.0
2.5
3.0
3.5
4.0
4.5
5.0
uMngeni TP (kg/ha/yr)
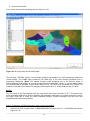
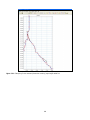
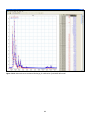
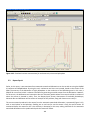
Figure 2.2.1.6: Comparison of phosphate load modelling results using the PLOAD default values (Default
TP) and the phosphate export coefficients gleamed predominantly from South African literature (uMngeni
TP).
2.3 Watershed Delineation
When dealing with large catchments, it is sometimes difficult to work with large areas, with a wide variety of
land cover and soil types. This may make tasks such as hydrological modelling difficult, with so many
variables. Therefore, it is often easier to deal with smaller, more manageable catchments. This is where the
automatic and manual watershed delineation tool becomes useful. This tool “allows the user to delineate
subwatersheds based on an automatic procedure using Digital Elevation Model (DEM) data. User specified
parameters provide limits that influence the size and number of subwatersheds created” (EPA, 2010). With
this in mind, the following lesson plan was compiled using data for a single quaternary catchment (U20J)
situated within the uMngeni catchment. (NOTE: This lesson plan was initially provided on a CD, along with
project names, various files and file directories. This report does now contain these files, but they are on
record for a potential user to use.)
Lesson title: Learning how to use the automatic and manual watershed delination tool within BASINS 4.0
21