1
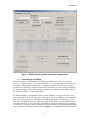
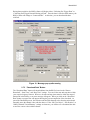
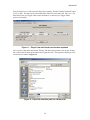
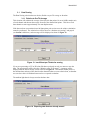
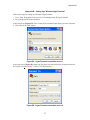
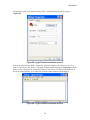
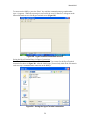
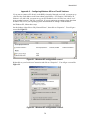
March 2010
RibEye™ Multi-Point Deflection Measurement System
Software User’s Manual (Version 1.8)
Boxboro Systems, LLC
978-257-2219
www.boxborosystems.com
1
March 2010
Table of Contents
Page
1.0
2.0
3.0
4.0
5.0
RibEye Control Software Description .................................................................... 4
1.1 Computer Requirements .............................................................................. 4
1.2 Software Installation ..................................................................................... 4
RibEye Control Software Operation....................................................................... 4
2.1 Connecting to the RibEye............................................................................. 5
2.2 Text Field Under “RibEye Installed in ATD” ................................................. 7
2.3 Trigger Setting.............................................................................................. 8
2.4 “RibEye Pointed Toward Dummy” Field ....................................................... 8
2.5 ISO Code Settings........................................................................................ 8
2.5.1 “ISO Test Object” Menu.................................................................... 10
2.5.2 “ISO Position” Menu ......................................................................... 11
2.6 “Show Current XYZ’s” Button ...................................................................... 11
2.7 Data Collection Setup, Arm, and Download Controls.................................. 12
2.7.1 Data Buffer Operation....................................................................... 12
2.7.2 Flash Memory Data Storage............................................................. 12
2.7.3 “Erase Memory” Button..................................................................... 13
2.7.4 “Arm/Disarm” and “Trigger” Buttons ................................................. 13
2.7.5 “Download Data” Button ................................................................... 14
2.7.6 Error Codes in Data File ................................................................... 15
“Export” Tab .......................................................................................................... 15
3.1 Data Zeroing ............................................................................................... 17
3.1.1 Relative to Pre-T0 Average .............................................................. 17
3.1.2 Absolute (no zeroing)........................................................................ 18
3.2 Filtering ....................................................................................................... 18
3.3 Data formats................................................................................................ 18
3.3.1 Diadem Data Format ........................................................................ 19
3.3.2 CSV format ....................................................................................... 19
3.3.3 ISO MME format ............................................................................... 19
“Plot” Tab .......................................................................................................... 20
4.1 “Select File” Button...................................................................................... 21
4.2 “Plot Data” Selection ................................................................................... 21
4.3 “Filter Class” Selection ................................................................................ 22
4.4 “Relative/Absolute” Switch .......................................................................... 22
4.5 Zooming and Modifying a Plot Style............................................................ 22
“Live Display” Tab................................................................................................. 23
Appendixes
A.
Setting the RibEye’s IP address ................................................................... 25
B.
Setting Up a Windows HyperTerminal.......................................................... 27
C. Configuring Windows XP for a Fixed IP Address ......................................... 30
2
March 2010
List of Figures and Tables
Figure No.
Page
1
RibEye control software main screen upon start-up...................................... 5
2
“Find RibEyes” screen................................................................................... 6
3
RibEye control software main screen after connecting to RibEye................. 7
4
Confirmation of updated data under “RibEye Installed in ATD”..................... 8
5
ISO code settings .......................................................................................... 9
6
Adding to “ISO Test Object” list.................................................................... 11
7
“ISO Position” list of options ......................................................................... 11
8
Data collection setup, arm, and download controls ...................................... 12
9
“Disarm” and “Trigger” buttons that appear after arming.............................. 13
10
Message pop-up after arming ...................................................................... 14
11
“Export” tab with format selection box expanded ......................................... 16
12
Export file selection panel for a Diadem file ................................................. 16
13
Insufficient pre-T0 data for zeroing............................................................... 17
14
Exporting data that was already zeroed ....................................................... 17
15
Exporting previously filtered and zeroed data .............................................. 18
16
ISO MME format directory and files.............................................................. 19
17
“Plot” tab....................................................................................................... 20
18
“Select File” browser .................................................................................... 21
19
Changing plot styles by right-clicking on a trace in the “Legend” box .......... 23
20
“Live Display” tab for Polar RibEye .............................................................. 24
A1
HyperTerminal screen .................................................................................. 26
B1
HyperTerminal connection screen 1............................................................. 27
B2
HyperTerminal connection screen 2............................................................. 27
B3
HyperTerminal connection screen 3............................................................. 28
B4
HyperTerminal connection screen 4............................................................. 28
B5
HyperTerminal connection screen 5............................................................. 29
B6
Saving the HyperTerminal connection.......................................................... 29
C1
Windows XP configuration screen 1............................................................. 30
C2
Windows XP configuration screen 2............................................................. 30
C3
Windows XP configuration screen 3............................................................. 31
Table No.
1
ISO codes used in RibEyes.......................................................................... 10
2
Linear buffer operation examples ................................................................. 12
3
March 2010
RibEye™ Multi-Point Deflection Measurement System
Software User’s Manual
1.0
RibEye Control Software Description
The RibEye control software is used to set up the RibEye for a test, download the data from the
RibEye, view the data, and export the data for crash analysis programs. The RibEye software
will work with all RibEye models. When the software connects to a RibEye, it will adapt the
screens according to the features and capabilities of the connected RibEye.
1.1
Computer Requirements
The RibEye Control software will work on PCs running Windows 2000 or XP. Windows Vista
and Windows 7 are not currently supported.
1.2
Software Installation
First, insert the RibEye CD into your CD drive. Using Windows Explorer, open the “RibEye
Installer” directory and run the “setup.exe” program. Then follow the instructions on the screen.
This program will install the RibEye control software and the National Instruments
LabWindows/CVI Run-Time Engine.
2.0
RibEye Control Software Operation
The main screen upon start-up of the RibEye control software is shown in Figure 1. Note that
most of the controls are grayed out, and only the “Connect/Setup”, “Plot”, and “Export” tabs are
visible. Without connecting to a RibEye, the software can be used only to re-plot and to export
existing datasets. The “Status” box shows the current state of the RibEye (disconnected).
4
March 2010
Figure 1. RibEye control software main screen upon start-up
2.1
Connecting to the RibEye
The control software can communicate to RibEyes via Ethernet over a Local Area Network
(LAN) or a serial connection. The “Connect to RibEye via” drop-down menu has the option for
connecting via RS232 Serial and Ethernet. For RibEyes integrated with DTS Slice systems, if
you want to use the RibEye software instead of the DTS software, you can connect to the RibEye
by using the IP address of the Slice Distributor, and select the “Ethernet via Slice DB” option on
the “Connect to RibEye via” drop-down menu.
For Ethernet RibEyes, select Ethernet in the “Connect to RibEye via” drop-down menu. Next,
select the IP address for your RibEye in the “IP Address” box. If your RibEye is not listed on the
drop-down menu, you can type your RibEye’s IP address into the box. Alternatively, you can
click on the “Find RibEyes” button, which will search for all RibEyes currently connected to the
LAN and powered up. If you click on the “Find RibEyes” button, a message will pop up asking
you to wait for 15 seconds. After the RibEyes have been found, they will be displayed and added
to the “IP Address” drop-down menu as shown in Figure 2. To find the RibEyes on the network,
5
March 2010
the software listens to port 1020 for a UDP protocol broadcast message from the RibEyes. Each
RibEye will send out a UDP broadcast packet every 10 seconds. Note that some network routers
and most firewalls will block UDP broadcast packets. See your system administrator if this
feature doesn’t work.
Figure 2. “Find RibEyes” screen
After you have selected the correct IP address, click on the “Connect” button to connect to the
RibEye. When the software connects to the RibEye, it will retrieve the following data and fill it
in on the screen: RibEye Type, Serial Number, Calibration Date, and Firmware Version. The
software will also retrieve and fill in the “RibEye Installed in ATD” text field. For some RibEye
models the RibEye trigger setting will also be retrieved and displayed. Figure 3 shows the main
screen after the software has connected to the RibEye. Note that “Live Display” tab is now
visible, and the various control buttons are activated.
6
March 2010
Figure 3. RibEye control software main screen after connecting to RibEye
2.2
Text Field Under “RibEye Installed in ATD”
The user can change this text field, and software will store the data RibEye’s flash memory. The
text field can be used for any purpose, but it is typically used for the dummy identification, so that
if multiple RibEyes are being used, you can verify that you are connected to the correct one.
After you change the text in this field, either press the “Enter” key on your keyboard or click
outside the text box on the screen. Then the software will write the updated information to the
RibEye. A confirmation box will pop up as shown in Figure 4. Click on “OK” to close the box.
7
March 2010
Figure 4. Confirmation of updated data
under “RibEye Installed in ATD”
2.3
Trigger Setting
The “Trigger Setting” drop-down menu is used to select the trigger signal type and polarity. The
RibEye trigger setting is stored in the RibEye’s flash memory. If you change the setting, the new
setting is written to the RibEye. The four options are—
•
•
•
•
Switch, Rising Edge
Switch, Falling Edge
Differential, Rising Edge
Differential, Falling edge
The definitions of these terms are—
• “Switch” settings are used for a contact switch, a TTL level signal, or a trigger output pulse
from a data acquisition system (DAS).
• “Differential” settings are used for systems that have a differential trigger signal at RS485
voltage levels.
• “Rising Edge” is used when you want to trigger on a rising voltage at the trigger input.
• “Falling Edge” is used when you want to trigger on a falling voltage at the trigger input.
Some versions of the RibEye do not show the Trigger settings box because they are designed to
be directly connected to a specific DAS, and the trigger setting is fixed to operate with that DAS.
Refer to your RibEye hardware manual for more information.
2.4
“RibEye Pointed Toward Dummy” Field
The drop-down menu for “RibEye Pointed Toward Dummy” will only be shown for side-impact
dummies. The direction selections, LEFT or RIGHT, are used to convert data from the RibEye
coordinate system to the dummy coordinate system. For the SID-IIs and the WorldSID, changing
the direction will change the signs of the X and Y data. For the Polar LEFT or RIGHT settings,
the RibEye coordinate system is rotated about the Z-axis of the dummy by plus or minus 41
degrees.
The direction selection is checked whenever data is read from the RibEye, and the coordinate
conversions are applied to the data as it is received.
2.5
ISO Code Settings
The drop-down menus for “ISO Test Object” and “ISO Position” (Figure 5) are used to generate
the standard ISO channel naming codes as shown in the table on the screen in Figure 5. When
8
March 2010
you change any of the values in the drop-down menus, you will see the changes reflected in the
ISO codes in the table. The ISO codes are used as channel headers in the exported data files. The
channel codes are not stored in the RibEye. The “Rib” and “Position” entries for each LED in the
table cannot be changed by the user. When data is downloaded, the ISO codes are read from the
table and are used to name the channels in the data files. For the formal definitions of the channel
codes, see ISO/TS 13499 – RED B, Version 1.5, “Road vehicles - Multimedia data exchange
format for impact tests, Channel Codes”.
Figure 5. ISO code settings
9
March 2010
The ISO codes used in the RibEyes are shown in Table 1. The format is –
A B CCCC DD EE FF GG H I
Table 1. ISO codes used in RibEyes
Letters
ISO Definition
A
Test Object
B
Position
CCCC
Main Location
DD
Fine Posn 1
EE
Fine Posn 2
FF
Fine Posn 3
GG
H
Dimension
Direction
I
Filter Class
Options
can be defined by the user, typically:
1 = vehicle 1
2= vehicle 2
3 = vehicle 3
S = sled
etc.
standard seating positions 0-9
typically the rib name or sternum
for frontal dummies: RIBS or STRN for sternum
for side-impact dummies:
SHRI – shoulder rib
THRI – thoracic rib
ABRI – abdominal rib
the rib number such as 01, 02, 03
or a position code such as:
UP – upper
MI – middle
LO – lower
a position code such as:
UP – upper, MI – middle, LO – lower, LE – left
RI – right, OU – outer, FR – front, RE – rear
the dummy type such as:
S2 – SIDIIs
WS – WorldSID
H3 – Hybrid III 50th Male
HF – Hybrid III 5th Female
PE – Polar
BA – Ballistic SIDIIs for vest/weapons testing
always DS for displacement
X, Y, or Z
0 – unfiltered
A – CFC1000
B – CFC600
C – CFC180
D – CFC60
2.5.1 “ISO Test Object” Menu
The “ISO Test Object” drop-down menu sets the first character of the ISO codes shown in the
table. Typically this is used to indicate the vehicle that the RibEye dummy is in. This list of
options can be modified by the user by right-clicking you mouse inside the drop-down menu box.
This will pull up a screen where you can enter additional test objects as shown in Figure 6.
The “ISO Test Object” list is stored in a text file:
C:\Program Files\RibEye_1_8\t\isotestobject.txt
You can directly edit this file to delete or add entries. The file is read at program startup to
populate the drop-down menu list.
10
March 2010
.
Figure 6. Adding to “ISO Test Object” list
2.5.2 “ISO Position” Menu
The “ISO Position” drop-down menu lets you choose the standard dummy positions in a vehicle.
The “ISO Position” sets the second character of the ISO codes shown in the table on the screen in
Figure 7, which shows a list of the options.
Figure 7. “ISO Position” list of options
2.6
“Show Current XYZ’s” Button
The “Show Current XYZ’s” button will turn on the LEDs briefly and report the current positions
in the dummy coordinate system based on the Left or Right setting in the “RibEye Pointed
Toward Dummy” field. For two-axis systems, the button is labeled “Show Current XY’s”.
11
March 2010
2.7
Data Collection Setup, Arm, and Download Controls
Figure 8 illustrates these controls, which are described in the following sections.
Figure 8. Data collection setup, arm, and download controls
2.7.1 Data Buffer Operation
The RibEye has a 30-second D-RAM data buffer (25 seconds for WorldSID), which can be
configured as a circular or linear buffer. If the data buffer is set to “Circular”, only the “Data to
collect after Trigger” box will be shown. In this mode, when the RibEye is armed, it will begin
collecting data to a circular buffer. It will continue to collect data to the circular buffer until it
receives a trigger signal (see section 2.6.4 “Arm/Disarm” and “Trigger” Buttons). After a trigger
is received, RibEye will continue to collect data for the number of milliseconds entered in the
“Data to Collect after Trigger” box. You can set this value from 1 to 30,000 milliseconds (ms).
Note that if you set the “Data to Collect after Trigger” to 30,000 ms, no pre-trigger data will be
saved.
When the data buffer is set to “Linear”, the RibEye collects up to 30 seconds of data, starting
from when it is armed. If a trigger is received, it will continue to collect data until it has either
collected the amount of data set in the “Data to Collect after Trigger” box, or until the “Time (ms)
to collect after ARM” is reached, whichever happens first. If no trigger is received, the RibEye
will stop collecting data after the time period specified in “Time (ms) to collect after ARM”. If a
trigger is detected, the time the trigger occurs is set to 0 ms. Table 2 shows some examples.
Table 2. Linear buffer operation examples
Data to collect
after Trigger
(ms)
2,000
2,000
2,000
Time (ms) to
collect after
ARM
30,000
30,000
30,000
Data Stored in RAM Buffer
Trigger occurs
(ms after ARM)
Start Time
Stop Time
10,000
29,000
No Trigger
–10,000
–29,000
0
2,000
1,000
30,000
2.7.2 Flash Memory Data Storage
Immediately after data collection stops, data is copied from the RAM buffer to flash memory.
The flash memory holds 2 seconds of data (1.7 seconds for WorldSID). If the RibEye is powered
down after it writes to flash memory, only 2 seconds of data will be available to download. If a
trigger occurred during the test, the flash will hold data from –500 to 1,500 ms (–200 to 1,500 ms
for WorldSID), where Time 0 is the time the trigger occurred. If no trigger occurred, the RibEye
12
March 2010
will store the last 2 seconds of data acquired in flash memory. If the linear buffer was set to
30,000 ms to collect after arm, the flash will hold 28,000–30,000 ms.
Note that if power is interrupted while the RibEye is writing data to flash memory, when RibEye
is rebooted, it will report the data in flash as –
Start Time = –29, 999 ms
Stop Time = 27,9999 ms
There may or may not be any good data in flash memory, but the data can be downloaded and
inspected.
2.7.3 “Erase Memory” Button
The “Erase Memory” button will erase the RibEye RAM and flash memory. This typically takes
about 10 to 14 seconds depending on the RibEye model, but the memory specifications say that it
can take longer. The RibEye “Status” box will display “Erasing RibEye Flash Memory”, and a
progress bar will appear.
2.7.4 “Arm/Disarm” and “Trigger” Buttons
Clicking on the “Arm” button (see Figure 8 above) will start the RibEye collecting data. Note
that if memory is not erased as described above, the Arm button is inactive. When you click the
“Arm” button, the button label will change to “Disarm”, and a “Trigger” button will appear as
shown in Figure 9.
Figure 9. “Disarm” and “Trigger” buttons that appear after arming
The RibEye Status box will display “Collecting Pre-Trigger Data”, and a message will pop up,
asking if you plan to disconnect the communications cable to the dummy (Figure 10). If you do
plan to disconnect the cable, you must click on the “Disconnect Now” button. This will close
communications to the RibEye so that disconnecting the cable will not lock up communications.
If you do not plan to disconnect the dummy communications cable, you can click the “Stay
Connected” button. After the test is completed and the communications cable is plugged back in
to the dummy, you can click on the “Connect” button to re-establish communications with the
RibEye.
The “Disarm” button will cause the RibEye to stop collecting data, and no data will be stored.
The “Trigger” button will mark a trigger event, and the RibEye will treat it as if a hardware
trigger occurred.
13
March 2010
During data acquisition, the RibEye Status will display either “Collecting Pre-Trigger Data” or
“Collecting Post-Trigger Data and Storing to Flash”. Once the data is stored to flash memory, the
RibEye Status will change to “Connected-Idle”. At this time, you can download the data
collected.
Figure 10. Message pop-up after arming
2.7.5 “Download Data” Button
The “Download Data” button will download data from the RibEye based on the “Data to
Download”, “Start Time”, and “Stop Time” settings. You can set the start and stop times within
your expected region of interest. However, the start and stop times must be within the range of
data stored in the RibEye, or an error message will appear. When you click on the “Download
Data” button, a progress bar will appear showing the percent completion of the download. As
part of the Download process, the software reads the ISO channels codes from the main tab and
internally stores the channel codes with the data set. If the “ISO Test Object”, “ISO Position”, or
“RibEye Pointed Toward Dummy” settings are incorrect, you will have to re-download the data
to store the correct values with the dataset.
14
March 2010
All RibEye data is downloaded. The LED X, Y, and Z data is downloaded in millimeters, and the
ambient light readings for each sensor are downloaded in counts (65,535 maximum).
After the download is complete, the program will display the “Export” tab, allowing you to save
the data. You can save the data or switch to the “Plot” tab to preview the data before saving (see
Section 4.0 “Plot tab”).
2.7.6 Error Codes in Data File
If the RibEye cannot accurately calculate a LED position, it will generate error codes in the data
file, causing a drop-out in the plots. The RibEye will force the X, Y and Z data to the same error
code. The error codes are generated when light from a LED is blocked between the LED and one
of the sensors, or if there is too much ambient light to accurately resolve the LED position.
For two-axis systems, the X and Y data will be forced if –
1. The left sensor (dummy’s left) is blocked or sees too much ambient light
2. The right sensor (dummy’s right) is blocked or sees too much ambient light
3. Both sensors are blocked or see too much ambient light
4. A divide-by-zero condition occurred in the data processing.
For three-axis systems, the X, Y, and Z data will be forced if –
1. The top sensor is blocked or sees too much ambient light
2. The bottom sensor is blocked or sees too much ambient light
3. Both top and bottom sensors are blocked or see too much ambient light
4. The middle sensor is blocked or sees too much ambient light
5. The middle and top sensors are blocked or see too much ambient light
6. The middle and bottom sensors are blocked or see too much ambient light
7. All three sensors are blocked or see too much ambient light
8. A divide-by-zero condition occurred in the data processing.
If an error code occurs, discount the data a few milliseconds before and after the drop-out,
because the LED brightness control loops must stabilize. Most often , the cause of a drop-out is a
loose cable that swings between the LED and the sensors, blocking the light. Error conditions
can also occur if the rib rotates enough so that the light from the LED cannot reach the sensor.
Note that the error codes can get masked by filtering the data. Also, removing the zero offsets
will change the error levels by the zero offset amount, and all three axes will no longer be at the
same level. Therefore we strongly recommend reviewing and saving a copy of the unfiltered,
absolute data so that the error codes are preserved.
3.0
“Export” Tab
The “Export” tab is shown in Figure 11. If data has been downloaded from the RibEye, the
“Data in Memory” field will display “Downloaded RibEye Data in Memory”. If an existing
RibEye data file was read in (see Section 4.0 “Plot tab” for importing an existing file), the
existing file name will be displayed. Either downloaded data or an existing file can be exported.
15
March 2010
You can choose to save and export the data in three formats: Diadem, Comma-Separated-Values
(CSV), or ISO. The data can be stored unfiltered or filtered at class 1000, 600, 180, or 60. The
data can have the pre-Trigger offsets removed (Relative) or have the pre-Trigger offsets
preserved (Absolute).
Figure 11. “Export” tab with format selection box expanded
After you have chosen the data format, filtering, and data zeroing options, click on the “Export”
tab to choose the file name and location and to export the data. The program will bring up a file
selection box as shown in Figure 12.
Figure 12. Export file selection panel for a Diadem file
16
March 2010
3.1
Data Zeroing
The Data Zeroing selection has two choices, Relative to pre-T0 average or Absolute.
3.1.1 Relative to Pre-T0 Average
This selection will calculate the average of the first 100 data points (10 ms at 10 kHz sample rate)
of each channel and subtract the average from all of the channel data points. This forces each
data channel to start at approximately zero mm displacement.
If the data set does not contain at least 100 data points prior to time zero, the relative calculation
cannot be performed. The selection box will be forced to “Absolute (no zeroing)” and grayed
(see Section 3.1.2 below), and a message will be displayed as shown in Figure 13.
Figure 13. Insufficient pre-T0 data for zeroing
If you are reprocessing a CSV or ISO data file that was already zeroed, you cannot re-zero the
data. The selection box will be forced to “Relative to Pre-T0 Average”. A message will be
displayed that the data is already zeroed as shown in Figure 14. The Diadem format preserves
the absolute data and uses offset data from the channel headers to create relative data, so data that
was saved as relative in Diadem format can be re-exported as absolute.
The ambient light data is always stored as absolute data.
Figure 14. Exporting data that was already zeroed
17
March 2010
3.1.2 Absolute (no zeroing)
If you choose Absolute data, all channel data is the X, Y, or Z distance with respect to the origin
of the RibEye coordinate system. Refer to your RibEye manual for the definition of the RibEye
coordinate system. This selection preserves the data error codes and the initial positions of the
LEDs.
3.2
Filtering
Data can be exported unfiltered or filtered at Class 1000, 600, 180, or 60. The program uses the
phaseless 4 pole Butterworth filter used by NHTSA (National Highway Transportation and Safety
Administration, U.S.). The last character of the ISO channel codes will be set to the filter used:
0 =
A=
B=
C=
D=
No Filter
Class 1000
Class 600
Class 180
Class 60
If you are exporting previously filtered data, you cannot re-filter the data. The “Filter Selection”
box will be set to the filter that the data was filtered at, and grayed out so it cannot be changed,
and a message that the data is already filtered will be shown as in Figure 15.
Ambient light data is always stored unfiltered.
Figure 15. Exporting previously filtered and zeroed data
3.3
Data formats
All three data format options include the following information about the test:
• The test date
• RibEye type
• RibEye serial number
• The channel ISO codes, including the filter code as the last character
• Number of data points per channel and the start time relative to the trigger time
• The text from the field under “RibEye Installed in ATD” (see Section 2.2).
18
March 2010
3.3.1 Diadem Data Format
The Diadem data format is used for importing data into National Instruments’ Diadem data
processing program. When this format is chosen, the program will open a file selection box with
the “Save as type” selection set to “.DAT”. Enter a test file name, such as “mydata”. The
program will create two files:
mydata.DAT (an ASCII file describing the data_
mydata.R32 (a binary file with the test data in 32-bit floating point format)
For more information on the Diadem format, see the following document from the National
Instruments web site:
http://digital.ni.com/public.nsf/ad0f282819902a1986256f79005462b1/7c72161d9b13ef1086256c
e8007f570b/$FILE/dmheader.pdf
3.3.2 CSV format
The CSV format (Comma Separated Values) creates a spreadsheet compatible file with a CSV
extension. Data is arranged in columns, with the ISO codes as the column headers. The file
selection box will have the “Save as type” selection set to “.CSV”. Enter a test file name, such as
“mydata’, and the program will create a file called “mydata.CSV”.
3.3.3 ISO MME format
The ISO MME format is described in ISO/TS 13499, First edition 2003-02-01, “Road vehicles —
Multimedia data exchange format for impact tests.” When you select the ISO format option the
file selection box will have the “Save as type” selection set to “.MME”. Enter a test file name,
such as “mydata”, and the program will break down the file location and filename into the format
“/PATH/mydata”. It will then create a directory called “/PATH/mydata” and will build the files
as shown in Figure 16.
When you select an ISO file in the form: \PATH\mydata.MME
the program will create the folders and files shown below
\PATH\mydata\
mydata.MME
CHANNEL
mydata.CHN
mydata.001
mydata.002
mydata.003
Figure 16. ISO MME format directory and files
19
March 2010
The file “mydata.MME” is a generic test descriptor file in ASCII format, where the only data that
changes is the test data and a timestamp for when the file was created.
The file “\CHANNEL\mydata.CHN” is an ASCII file that contains the number of data channels
and a list of the ISO channel name codes.
The files “mydata.001” through “mydata.00n” are ASCII files, one per data channel, that contain
the data for each channel in floating point format.
4.0
“Plot” Tab
The “Plot” tab (Figure 17) is used for a quick view of RibEye data. If data has been downloaded
from the RibEye, the “Current File” box will display “Downloaded RibEye Data in Memory”. If
an existing RibEye data file was read in, the existing file name will be displayed.
Figure 17. “Plot” tab
20
March 2010
4.1
“Select File” Button
The “Select File” button allows you to read an existing RibEye data file to plot. After a file is
read in, you can also re-export the file (see Section 3.0 for more information on exporting).
When you click on the “Select File” button, a file browser will open to choose the file to read.
Figure 18 shows the file browser. Set the “Files of Type” dropdown box to:
*.DAT for Diadem files
*.CSV for Comma-Separated-Values files
*.MME for ISO files
Select the Diadem, CSV, or ISO file that you want to open.
Figure 18. “Select File” browser
4.2
“Plot Data” Selection
The “Plot Data” selection allows you to select the data to plot. The options change depending on
the type of RibEye used to collect the data. You can view the X, Y, and Z displacement data.
You can also view the ambient light readings. The ambient light data is useful to review if you
see drop-outs in the data (refer to Section 2.7.6 for more information on error codes).
21
March 2010
4.3
“Filter Class” Selection
The NHTSA standard phaseless Butterworth filter is used for filtering. You can view the data
with the following filter classes:
• No filter
• CFC 1000
• CFC 600
• CFC 180
• CFC 60.
If pre-filtered data from a file is read in, the “Filter Selection” box will be set to the filter used
when the data was stored, and the data can not be re-filtered.
4.4
“Relative/Absolute” Switch
The “Relative/Absolute” switch set to “Relative” will remove the zero offsets from the data by
subtracting an average of the first 100 samples from each channel from the rest of the channel
data. If less than 100 samples of data (10 ms at 10 kHz) was downloaded prior to time-zero, the
“Relative/Absolute” switch will be forced to the “Absolute” position, and the data cannot be
zeroed.
If data is read from a file that was stored as “Relative” data, the “Relative/Absolute” switch will
be forced to “Relative” and cannot be changed to “Absolute” for ISO and CSV files. Diadem
files can always be viewed as “Absolute” or “Relative”.
4.5
Zooming and Modifying a Plot Style
To analyze and modify a plot, perform the following steps:
• Zoom in on the plot by holding the “Ctrl” key and left mouse button and draw a box around
the area of interest.
• Pan the plot by holding the “Ctrl” and “Shift” keys and left mouse button and moving the
mouse.
• Undo zoom and pan operations by pressing “Ctrl” and the space bar. You can undo as many
as the last 25 operations.
• Zoom out by holding the “Ctrl” key and clicking the right mouse button.
• Right-click on a trace name in the “Legend” box to change colors, line thickness, and plot
style (Figure 19).
22
March 2010
Figure 19. Changing plot styles by right-clicking on a trace in the “Legend” box
5.0
“Live Display” Tab
The “Live Display” tab shows the current positions of the LEDs, which are updated
approximately 1 to 3 times per second depending on the RibEye model. You can use this display
to verify that everything is working correctly. You can zoom the plots around the LEDs so you
can see the effect of someone pushing on the ribs.
For side-impact dummies, a switch for setting the impact side of the dummy is available. For the
Polar dummy, you can view the LED positions in either the RibEye or dummy coordinate
systems. Figure 20 shows the “Live Display” tab for the Polar RibEye.
23
March 2010
Figure 20. “Live Display” tab for Polar RibEye
24
March 2010
Appendix A. Setting the RibEye’s IP address
When the RibEye ships from the factory, its IP address is set to 192.168.0.240. You can change
the RibEye’s IP address by sending commands to the RibEye over the LAN connection to port 23
using a Telnet terminal program.
The following example uses Windows HyperTerminal. Refer to Appendix B for instructions on
configuring Windows HyperTerminal to communicate with the RibEye. If you are using an
operating system other than Windows, refer to your documentation for the Telnet program
installed on your system.
To change the RibEye’s IP address using Windows HyperTerminal, follow these steps.
1. Start Windows HyperTerminal
2. Hit the “Enter” key until the command prompt appears (pound/number sign, #)
3. At the command prompt, type the following, but replace the “x”s with your new IP address—
set ip eth0 ip-address xxx.xxx.x.xxx
4. Press the “Enter” key again.
The IP address of the RibEye is now changed temporarily. It is not permanently stored in the
RibEye flash memory, so if the RibEye is powered down, it will not remember the change.
Because the IP address has been changed, HyperTerminal will no longer communicate with the
RibEye, so you must change the HyperTerminal host address:
1. Go to “File/Properties” and change “Host Address”
2. Click on “Call/Disconnect”
3. Click on “Call/Call”
4. If you don’t immediately get a command prompt, press the “Enter” key until you do
5. Finally, type “Save”.
You should see the message “Saving Configuration and Exiting”, which indicates that the change
of IP address is permanent. You may wish to re-save your HyperTerminal session with the new
IP address so that it will connect immediately the next time. Figure A1 shows the
HyperTerminal screen after saving.
IMPORTANT: If you change the RibEye IP address, you should write the new IP address on a
sticker and attach the sticker to the RibEye so that the number is readily available for the next
time you are using the RibEye.
NOTE: If you change the RibEye IP address to a different subnet (that is, if you change more
than the last three digits), you might have to change the IP address of your PC to the new subnet
also, depending on your LAN configuration.
For example, if you change the RibEye IP from—
192.168.0.240
to—
192.168.2.240
you might have to change your PC to an IP address on the 192.168.2 subnet.
25
March 2010
Figure A1. HyperTerminal screen
26
March 2010
Appendix B. Setting Up a Windows HyperTerminal
Follow these steps for setting up a Windows HyperTerminal.
1. Go to “Start Æ Programs Æ Accessories Æ Communications Æ HyperTerminal”
2. Set up the HyperTerminal Connection
At the first screen (Figure B1), enter a name for the connection and choose an icon to represent
it. Then click on the “OK” button.
Figure B1. HyperTerminal connection screen 1
At the next screen (Figure B2), ignore the first three lines and click on the drop-down menu for
the last line (“Connect using:”). Select “TCP/IP (Winsock).”
Figure B2. HyperTerminal connection screen 2
27
March 2010
Selecting this option, even without clicking “OK”, causes the following screen to appear
(Figure B3):
Figure B3. HyperTerminal connection screen 3
Enter an IP address for the RibEye connection. Make sure that the port number is set to 23 as
shown. Click on the “OK” button. The HyperTerminal window will appear (Figure B4) with the
name you have chosen for the connection at the top of the screen. The bottom left-hand side of
the screen shows that there is no connection yet between the computer and the RibEye.
Figure B4. HyperTerminal connection screen 4
28
March 2010
To connect to the RibEye, press the “Enter” key until the command prompt (pound/number
sign = #) appears. When the connection is successful, the word “Connected” will appear at the
bottom left-hand corner of the HyperTerminal screen (Figure B5).
Figure B5. HyperTerminal connection screen 5
Saving the HyperTerminal Setup for Future Connections
Go to the top of the screen and select “File Æ Save As”. Type a name for the HyperTerminal
connection as shown in Figure B6. After the initial setup, you need only click on the file name in
order to set up a communication connection to the RibEye.
Figure B6. Saving the HyperTerminal connection
29
March 2010
Appendix C. Configuring Windows XP for a Fixed IP Address
If you want to connect a PC directly to the RibEye instead of through your LAN, you must set up
your IP with a fixed address on the same subnet as the RibEye. For example, if the RibEye IP
address is 192.168.0.240, you must set up your PC IP address to be 192.168.0.xxx, where “xxx”
is any number between 1 and 254, except 240. If you are running an operating system other than
Windows XP, refer to your operating system documentation for setting a fixed IP address.
On Windows XP, follow these steps:
On the desktop, right-click on “My Network Places”, then click on “Properties”. You will get a
screen like Figure C1.
Figure C1. Windows XP configuration screen 1
Right-click on your Local Area Connection and click on “Properties”. You will get a screen like
Figure C2.
Figure C2. Windows XP configuration screen 2
30
March 2010
Click on “Internet Protocol (TCP/IP)” to highlight it, and then click on “Properties”. You will get
a screen like Figure C3.
Figure C3. Windows XP configuration screen 3
Select “Use the following IP address”.
Set the IP address to your desired address, and make sure that the subnet mask is set to
255.255.255.0 as shown in Figure C3. You don’t have to fill in the default gateway or DNS
server addresses.
Then click on the “OK” button until all windows are closed. You might get a message saying
that you have to re-boot for the changes to take effect.
You are now set to a fixed IP address.
31