1
Dissolved Oxygen Analyser
User Manual
Rev. 1.03
SiS Sensoren Instrumente Systeme GmbH
Mühlenkoppel 12
D-24222 Schwentinental
Germany
Contents
Chapter 1 Introduction ......................................................................................................... 1
Chapter 2 Functional Description ....................................................................................... 1
2.1 Photometer.................................................................................................................... 1
2.2 Algorithms...................................................................................................................... 1
2.2.1 Titration Process..................................................................................................... 1
2.2.2 Titration Curves ...................................................................................................... 2
2.2.3 Titration End Condition........................................................................................... 4
2.2.4 Endpoint Calculation............................................................................................... 5
2.2.5 Accuracy of Endpoint Determination...................................................................... 5
2.3 Titration Procedures ...................................................................................................... 5
2.3.1 Standardization....................................................................................................... 5
2.3.2 Blank Determination ............................................................................................... 6
2.3.3 Sample Titration ..................................................................................................... 6
2.3.4 Duplicate Samples.................................................................................................. 6
2.3.5 Titer Concentration ................................................................................................. 7
2.4 Calculations ................................................................................................................... 7
Chapter 3 The DO Analyser Software................................................................................. 11
3.1 Convert Bottle File......................................................................................................... 11
3.2 Calibration Program ...................................................................................................... 11
3.3 Hercules Graphic Utility................................................................................................. 11
3.4 Command Line Syntax.................................................................................................. 11
3.5 Demo Program .............................................................................................................. 12
3.6 File Formats................................................................................................................... 12
Chapter 4 The Menu System................................................................................................ 14
4.1 Help System .................................................................................................................. 14
4.2 Status Line..................................................................................................................... 14
4.3 Menu Commands.......................................................................................................... 14
4.3.1 Main Menu.............................................................................................................. 15
4.3.2 File Menu................................................................................................................ 16
4.3.3 File Selection .......................................................................................................... 17
4.3.4 Data Overview ........................................................................................................ 18
4.3.5 View Single Data Set.............................................................................................. 19
4.3.6 View Replication And Precision.............................................................................. 20
4.3.7 Print Menu .............................................................................................................. 21
4.3.8 Bottle Management ................................................................................................ 22
4.3.9 Add Bottle ............................................................................................................... 23
4.3.10 Titration................................................................................................................. 24
4.3.11 Input Maximal Transmission ................................................................................ 26
4.3.12 Titration Running .................................................................................................. 27
4.3.13 Titration Finished .................................................................................................. 28
4.3.14 Log Menu.............................................................................................................. 29
4.3.15 Second Bottle Number ......................................................................................... 30
4.3.16 Duplicate Sample Result ...................................................................................... 31
4.3.17 Blank Value .......................................................................................................... 32
4.3.17.1 First Blank Determination .............................................................................. 33
I
4.3.17.2 Additional Blank Determination ..................................................................... 34
4.3.18 Standard ............................................................................................................... 35
4.3.19 Standard Parameter ............................................................................................. 36
4.3.19.1 First Standard Determination......................................................................... 37
4.3.19.2 Additional Standard Determination................................................................ 38
4.3.20 Graph Menu.......................................................................................................... 39
4.3.21 Select Data Set from Log File .............................................................................. 40
4.3.22 Titration Curve ...................................................................................................... 41
4.3.23 Options Menu ....................................................................................................... 42
4.3.24 Configuration ........................................................................................................ 43
4.3.25 Titration Parameters............................................................................................. 44
4.3.26 External Program Configuration........................................................................... 45
4.3.26.1 Edit External Program ................................................................................... 46
4.3.27 Transmission Test ................................................................................................ 47
4.3.28 Hardware Test ...................................................................................................... 48
4.3.29 Dosimat Functions................................................................................................ 49
4.3.30 Help Menu ............................................................................................................ 50
Chapter 5 Printings............................................................................................................... 52
5.1 Printers .......................................................................................................................... 52
5.2 Printing Formats ............................................................................................................ 52
Chapter 6 Messages ............................................................................................................. 57
6.1 Warning Messages ....................................................................................................... 57
6.2 Error Messages ............................................................................................................. 58
Chapter 7 Customer Service................................................................................................ 62
References............................................................................................................................. 63
Index ....................................................................................................................................... 64
II
Figures
Figure 2.1 Theoretical Titration Curves..................................................................................3
Figure 2.2 Practical Titration Curve .......................................................................................4
Figure 4.1 Menu Tree ......................................................................................................... 14
Figure 4.2 Main Menu ......................................................................................................... 15
Figure 4.3 File Menu ...........................................................................................................16
Figure 4.4 File Selection......................................................................................................17
Figure 4.5 Data Overview ................................................................................................... 18
Figure 4.6 View Single Data Set.......................................................................................... 19
Figure 4.7 View Replication and Precision........................................................................... 20
Figure 4.8 Print Menu ......................................................................................................... 21
Figure 4.9 Bottle Management ............................................................................................ 22
Figure 4.10 Add Bottle ........................................................................................................ 23
Figure 4.11 Titration............................................................................................................ 24
Figure 4.12 Input Maximal Transmission ............................................................................. 26
Figure 4.13 Titration Running .............................................................................................. 27
Figure 4.14 Titration Finished.............................................................................................. 28
Figure 4.15 Log Menu......................................................................................................... 29
Figure 4.16 Second Bottle Number ..................................................................................... 30
Figure 4.17 Duplicate Sample Result .................................................................................. 31
Figure 4.18 Blank Value...................................................................................................... 32
Figure 4.18.1 First Blank Determination............................................................................... 33
Figure 4.18.2 Additional Blank Determination ...................................................................... 34
Figure 4.19 Standard .......................................................................................................... 35
Figure 4.20 Standard Parameter ......................................................................................... 36
Figure 4.20.1 First Standard Determination ......................................................................... 37
Figure 4.20.2 Additional Standard Determination................................................................. 38
Figure 4.21 Graph menu..................................................................................................... 39
Figure 4.22 Select Log File Data Set ................................................................................... 40
Figure 4.23 Titration Curve.................................................................................................. 41
Figure 4.24 Options Menu................................................................................................... 42
Figure 4.25 Configuration.................................................................................................... 43
Figure 4.26 Parameters ...................................................................................................... 44
Figure 4.27 External Program Configuration........................................................................ 45
Figure 4.28 Edit External Program ...................................................................................... 46
Figure 4.29 Transmission Test ............................................................................................ 47
Figure 4.30 Hardware Test ................................................................................................ 48
Figure 4.31 Dosimat Functions............................................................................................ 49
Figure 4.32 Help Menu ....................................................................................................... 50
Figure 4.33 Help Index........................................................................................................ 50
Figure 5.1 Bottle List ........................................................................................................... 52
Figure 5.2 Standard data (WOCE mode)............................................................................. 52
Figure 5.3 Blank Data ......................................................................................................... 53
Figure 5.4 Single Data Set (WOCE mode) .......................................................................... 53
Figure 5.5 Deviation Data.................................................................................................... 53
Figure 5.6 Log File.............................................................................................................. 54
Figure 5.7 Complete Data File Part 1 .................................................................................. 55
Figure 5.8 Complete Data File Part 2 ................................................................................ 56
III
Chapter 1
Introduction
This manual is part of the Dissolved Oxygen Analyser documentation. It will give the user a
detailed description of the titrator and program operation. For hardware and software
installation and a general introduction to the system, see the tutorial.
Please read the files WHATSNEW.DOC and README.DOC in your DOA directory for up-todate information on revisions and corrections to this manual.
Chapter 2
Functional Description
2.1 Photometer
The first version of the SiS titrator has a single-beam photometer with blue light at the
absorption wavelength of iodine. By use of a high resolution analog-to-digital converter the
decreasing of the absorption during the titration is recorded with very high precision. The new
photometer, in addition to the blue beam, has a red one which is little attenuated by the
iodine. This beam is used to estimate the transmission endpoint after titration. The
transparency of the sample in the blue is then nearly identical to the almost unchanged one
in the red. The light sources are solid state devices (light emitting diodes) with low power
consumption. To prevent errors from daylight or illumination effects they are modulated.
2.2 Algorithms
This section will give you some information about the titration process, the endpoint
calculation, and the quality of titrations. To understand the descriptions you need some
mathematical basics about polynomial approximation, linear regression, and differential
calculus.
2.2.1 Titration Process
Every titration will be done in three steps:
1. Fast titration phase
During this phase the system dispenses decreasing amounts of titer until a specific
transmission is reached. Between every step the system will wait some time to ensure
that the dispensed titer has reacted mainly. This wait time is called "Fast Delay" and
can be changed by the user. The default value is two seconds; proper delay times are
between two and five seconds. The fast titration phase ends when the transmission
reaches the estimated endpoint multiplied with the "Fast Factor". The default value is
0.92; proper factors are in the range from 0.85 to 0.95.
For the 1-channel systems the "Fast Factor" does not exist. In this case the fast phase
ends when the entered transmission value is reached or the primary shot volume has
been dispensed.
1
2. Wait time between fast and slow titration phase
After the fast titration phase, the system has to wait some time to ensure that all the
dispensed titer has reacted. The default value for this "Wait Time" is ten seconds.
3. Slow titration phase
During this phase the system dispenses constant amounts of titer. These amounts are
defined by the "Step Size". Every step corresponds to 1/10000 of the burette volume.
The default value is five; proper step sizes are in the range from two to ten. Like in the
fast titration phase, there is a delay time in the slow phase. The default value for the
"Slow Delay" is also two seconds. The slow titration phase ends, when the
transmission is nearly constant. To get the value of the constant transmission and the
accuracy of the measuring (e.g. noise from air bubbles), the system has to dispense
some more titer.
During the slow titration the measured transmission values are checked for spurious points
from air bubbles or particles in the sample to eliminate these points.
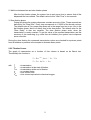
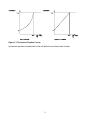
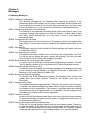
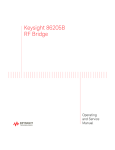
2.2.2 Titration Curves
The graph of transmission as a function of titer volume is based on de Beer's law.
Theoretically the function is:
c ∗V
T = T0 ∗ e tit , for 0 ≤ Vtit ≤ Vend
T = T max, for Vtit > Vend
with
T
T0
Tmax
c
Vtit
Vend
= transmission,
= transmission at the start of titration,
= transmission at the end of titration
= a constant factor,
= titer volume, and
= titer volume equivalent to dissolved oxygen.
2
Figure 2.1 Theoretical Titration Curves
In practical operation the detected curves will differ from the theoretical function.
3
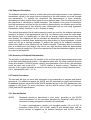
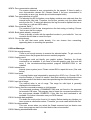
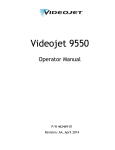
Figure 2.2 Practical Titration Curve
This figure shows a typical titration curve with the approximated function, the end line and the
interesting function points.
2.2.3 Titration End Condition
The titration will stop if the slope of the line calculated by linear regression from the last ten
valid transmission values is zero or negative, that is reaching the transmission maximum. The
average of these values is taken as the end transmission (or end line), which is used for the
endpoint calculation. In addition the point of maximal slope, detected during the slow phase, is
stored for later use.
4
2.2.4 Endpoint Calculation
The endpoint calculation is done by a third order polynomial approximation of the logarithmic
transmission values in the range from the beginning of the slow titration up to the constant
end transmission. To optimize the polynomial, the approximation is done iteratively,
eliminating the values outside three sigma for every iteration pass. Then the inflection point of
the polynomial is calculated by double derivation. The endpoint is the point of intersection
from the transmission end line and the line which is determined by the inflection point and the
slope of the polynomial at that inflection point (Remember that we are using logarithmic
transmission values; therefore, it is an e-function in reality).
This method guarantees that all valid measuring points are used for the endpoint calculation
instead of a subset. If the approximation fails (e.g. no inflection point inside the valid range,
the inflection point is a saddle point, or there are not enough measuring values during the
slow titration), the endpoint will still be calculated by intersection point determination, but by
using the point of maximal slope, detected during slow titration, by linear regression. In these
cases you will get a warning message. To assess the quality of the endpoint calculation,
observe the titration curve obtained by the Graph command. Particularly when the inflection
point is a saddle point, the titration may have a very high accuracy when the approximated
function is nearly a straight line (This occurs sometimes in the demonstration program, but not
very often in real titrations).
2.2.5 Accuracy of Endpoint Determination
The accuracy is calculated from the variation of the end line and the approximated polynomial
(or the data calculated during titration, if the approximation fails). By using small titer amounts
during slow titration (1/2000 of burette volume) and optimization of the curves, the calculated
errors are often very small (0.05 . . . 0.001% relative to burette volume). Therefore, the
accuracy of the system generally is based on the error of the motor burette (absolute error ≤
0.3 %, reproducibility error ≤ 0.1 %).
2.3 Titration Procedures
The next part will give you some brief information to the preparation of samples and titration
procedures. The software supports the WOCE and ISO standards for whole bottle titrations.
All additional features mentioned in the WOCE standard but not in the ISO standard are also
available in ISO mode. For more information, see the WOCE manual (1991) or Carpenter
(1965) and the ISO specifications.
2.3.1 Standardization
WOCE:
Standards should be determined in pure water, according to the WOCE
recommendations. It is the procedure described by Carpenter (1965) with the
extension of adding manganous chloride to the standards.
To make a standardization, pipette your standard solution (10 ml of 0.01 N
potassium iodate (KIO3)) into a bottle, nearly fill with distilled water, add the
same volumes of reagents as for titrations (sulphuric acid (H2SO4), sodium
5
iodide-sodium hydroxide (NaI/NaOH) and manganous chloride (MnCl2)), and
start the standard determination.
ISO:
Dissolve approximately 0.5 g potassium iodide or sodium iodide (KI or NaI) in
100 to 150 ml pure water and add 5 ml sulphuric acid (H2SO4). Mix the solution
and add exactly 20 ml standard solution (KIO3, 10 mmol/l). Then fill up to 200
ml with pure water and start the standard determination.
2.3.2 Blank Determination
WOCE:
Blanks should be determined in pure water, according to the WOCE
recommendations and Carpenter (1965). To determine the blank value pipette
1 ml of your standard solution into a bottle, nearly fill with pure water, add the
same amount of reagents as for titrations, and start the first blank titration. Then
add another ml of standard solution into the solution and titrate the liberated
iodine. If you want to get a more precise result, repeat the last step one or more
times. The blank value is calculated by subtraction of the average of all
additional titer volumes from the first one.
ISO:
Blank determinations are not mentioned in the ISO standard, but the software
allows blank determinations even in ISO mode. They are handled in the same
way as for the WOCE standard.
2.3.3 Sample Titration
WOCE:
Fill and overflow the flask with at least three bottle volumes, add the reagents
(MnCl2 and NaOH/NaI; e.g. 1 ml of each) and stopper the flask. Shake the
bottle and allow the precipitate to settle. After settling, add the sulphuric acid,
place a magnetic stirring bar in the flask, place the bottle in the photometer and
start the titration. Take care to avoid the introduction of air bubbles.
ISO:
The software supports only whole bottle titrations. Fill the flask, add the
reagents (1 ml MnCl2 and 2 ml NaOH/NaI) and stopper the flask. Shake the
bottle and allow the precipitate to settle. Before titration, add 1.5 ml sulphuric
acid.
2.3.4 Duplicate Samples
WOCE:
The WOCE recommendations insist on the titration of duplicate samples to
provide a reliable estimate of analytical precision. They should be taken for at
least 10% of all samples from a data set. To make a duplicate sample, prepare
two flasks from one sample, enable the duplicate sample switch in the titration
menu (duplicate samples must be enabled in the configuration menu), and start
the titration. The reproducibility, calculated from all duplicates in a data set, is
stored in the data file together with other statistics.
ISO:
Procedures for duplicate samples are not described, but mentioned in the ISO
standard. The software handles duplicates in ISO mode in the same way as in
WOCE mode.
6
2.3.5 Titer Concentration
The concentration of the thiosulphate titer should be strong enough, to titrate nearly all
samples with a titer volume less than one burette volume. If the titer is not strong enough, the
burette has to be refilled during titration, producing less accurate results. Especially for
standardization the titer volume must be less than one burette volume, because an inexact
result will affect all following titration results. On the other hand the titer should not be too
concentrated, as this will lead to less accurate results and could, in the worst case, cause
failure of the titration.
2.4 Calculations
This chapter lists all equations, used by the program to calculate oxygen concentrations. All
calculations will match the WOCE (World Ocean Circulation Experiment) and the ISO
(International Standardization Organization) recommendations.
Titer concentration in mmol/l (ISO, 1983):
The original ISO equation is:
c=
6 * 20 * 1.6
V std
for 20 ml of 10 mmol/l iodate standard.
The used equation is:
c=
Vstd
VIO3
NIO3
V IO3 ∗ N IO3
V std
= thiosulphate titer of standard (ml)
= volume of iodate standard (ml)
= normality of iodate standard (mmol/l)
Oxygen mass concentrations in mg/l (ISO, 1983):
The original ISO equation for whole bottle titrations is:
O2 =
M r * V x * c* f 1
4* V bot
7
with
f 1=
Mr
Vx
c
Vbot
Vreg
V bot
V bot - V reg
= relative molar mass of oxygen (32)
= thiosulphate titer of sample (ml)
= titer concentration (mmol/l)
= volume of sample bottle (ml)
= volume of sample displaced by reagents (ml)
The used equation is:
O2 =
Vx
Vblk,dw
Vbot
Vreg
DOreg
((V x - V blk,dw )* c*
8
Mr
)
) - ( DOreg * 1000*
4
5.598
V bot - V reg
= thiosulphate titer of sample (ml)
= thiosulphate titer of pure water blank (ml)
= volume of sample bottle at the pickling temperature (ml)
= volume of sample displaced by reagents (ml)
= absolute amount of oxygen added with reagents (ml)
To match the original equation use the default values:
Vblk,dw = 0 ml
DOreg = 0 ml
Oxygen volume concentrations in ml/l (WOCE, 1991):
(V x - V blk,dw )* V IO3 * N IO3 * 5598
-1000* DOreg
(V std - V blk,dw )
O2 =
(V bot - V reg )
Vx
Vblk,dw
Vstd
Vbot
Vreg
VIO3
NIO3
DOreg
= thiosulphate titer of sample (ml)
= thiosulphate titer of pure water blank (ml)
= thiosulphate titer of standard (ml)
= volume of sample bottle at the pickling temperature (ml)
= volume of sample displaced by reagents (ml)
= volume of iodate standard at temperature of standardization (ml)
= normality of iodate standard at temperature of standardization
= absolute amount of oxygen added with reagents (ml)
Oxygen weight concentrations in µM/kgsw (WOCE, 1991):
8
O2 ( µ M/ kgsw )=
44.660
O2(ml/l)
ρsw
44.660* O2(ml/ l)
ρ sw
= 1000/molar volume of oxygen gas at STP (Weiss, 1981)
= O2 volume concentration (ml/l)
= density of seawater at the sample temperature (g/cm3)
Percentage O2 saturation (Weiss, 1970):
O2sat =
C
T
S
100(%)* O2(ml/ l)
e
C
= -173.4292 + 249.6339 * (100 / T) + 143.3483 * ln(T / 100) 21.8492 * (T / 100) +
S * (-0.033096 + 0.014259 * (T / 100) - 0.0017 * T2 / 10000)
= sample temperature (Kelvin)
= salinity (psu)
Density of pure water in g/cm3 (Bigg, 1967):
ρ w = 0.999842594 + 6.793952∗10 −5 ∗ T − 9.095290∗10 −6 ∗ T 2 +
1001685
.
∗10 −7 ∗ T 3 − 1120083
.
∗10 −9 ∗ T 4 + 6.536332∗10 −12 ∗ T 5
T
= temperature (°C); range 0 - 40 °C
Density of seawater in g/cm3 (Millero and Poisson, 1981):
ρ sw = ρ w + A∗ S + B∗ S 1.5 + C∗ S 2
ρw
S
T
A
B
C
= density of pure water (g/cm3)
= salinity (psu); range 0.5 - 43 psu
= temperature (°C); range 0 - 40 °C
= 8.24493*10-4 - 4.0899*10-6 * T + 7.6438*10-8 * T2 8.2467*10-10 * T3 + 5.3875*10-12 * T4
= -5.72466*10-6 + 1.0227*10-7 * T - 1.6546*10-9 * T2
= 4.8314*10-7
Volume corrections (WOCE, 1991) for bottles and pipettes:
V = V( 20) ∗ (1 + α ∗ (T − 20))
V(20)
α
T
= volume at 20 °C
= cubical coefficient of thermal expansion (1/°C)
= actual temperature (°C)
9
Standard normality correction (WOCE, 1991):
N IO 3 = N IO 3( 20) ∗
ρ w(T )
ρ w ( 20)
NIO3(20)
= normality of iodate standard at 20 °C
ρw(T) = density of pure water at temperature T (g/cm3)
ρw(20) = density of pure water at 20 °C (g/cm3)
T
= temperature (°C)
Titer volume correction:
V x = V x ( Ttit ) ∗
ρ dw ( Tstd )
ρ dw ( Ttit )
Vx(Ttit) = titer volume at current temperature Ttit
ρw(Tstd) = density of pure water at standardization temperature Tstd (g/cm3)
ρw(Ttit) = density of pure water at current temperature Ttit (g/cm3)
10
Chapter 3
The DO Analyser Software
3.1 Convert Bottle File
The software includes a file named CONVBOT.EXE. It is used to convert bottle files created
with older software versions to the 3.x format. To convert old bottle files select the drive and
directory containing the old file and type "CONVBOT <Enter>". The program will create a
version 3.x binary file (DOA.BOT) from the old text files (BOTTLE.TXT or FLASCHEN.TXT),
without deleting them.
3.2 Calibration Program
The software package includes a calibration program DOACAL.EXE for the 2-channel
system. For a detailed description of the calibration procedure see the Technical Reference
Manual. Note that the system is calibrated by the factory and that a new calibration should
only be done by qualified technical personnel if it is really necessary.
3.3 Hercules Graphic Utility
To use the Graph command with Hercules graphic cards, you must install the terminate-andstay-resident program MSHERC.COM before starting the DOA program.
3.4 Command Line Syntax
Usage:
DOA
[/{MCL}] [/{ED}] [/X] [/Zname] [/Fname] [/{H?}]
DOADEMO [/{MCL}] [/{ED}] [/X] [/Zname] [/Fname] [/1] [/{H?}]
Command line parameters:
M
C
L
E
D
X
Z<name>
F<name>
1
H, ?
Monochrome display mode (default is auto detection)
Colour display mode (default is auto detection)
LCD display mode (not yet implemented; use colour table)
English language (default setting)
German language
Write all titration data to log file (default is off)
Set log file name to 'name' (default name is DOA.LOG)
Use configuration file 'name' (default is DOA.CFG)
Demo for one channel system (only for DOADEMO.EXE; default is two
channels)
Display help screen with command line parameters
The options are selected by typing a switching character ('/' [slash] or '-' [minus]) followed by
the option character (upper-case or lower-case). Each option must be separated from another
by a white-space character (e.g. space or tab).
All options will overwrite the current settings (from the configuration file DOA.CFG or the
default settings if no configuration file is found). The options 'M', 'C', 'L', 'E' and 'D' are saved in
the configuration file. Thus the settings will be valid until they are overwritten by other settings.
11
The options 'X', 'Z' and '1' (for DOADEMO.EXE) are only valid for the current program
execution. The default settings (no configuration file found) are English language and
auto-detection for the display mode (monochrome or colour, depending on video card).
If you select the X-option the titration steps (transmission values and dispensed titer) of every
titration will be written to an ASCII log file. This may be of interest to you, if you want to create
your own graph of the titration curve. Even if the X-option is not specified you can save the
data after each titration with the Log command.
The F-option is useful if you have more than one exchange unit with different titer
concentrations. So the program must only be restarted when changing the unit instead of
starting new standard and blank determinations. The distribution disk includes an example
batch file for the use of different configuration files.
3.5 Demo Program
The demo program DOADEMO.EXE works like the program DOA.EXE. However, the results
of titrations, standardizations and blank determinations may sometimes be rather improbable
because they are produced by a random number generator. In particular, the curves will fit the
theoretical curves of light absorptions. In addition to the full version you can select a
demonstration mode for the old 1-channel hardware by the command line option '/1'.
3.6 File Formats
All files created by the software are stored in binary format, so you cannot read them with an
editor or word processor. To produce readable text files use the Print to File option in the Print
Menu. The Print Menu is available at many points inside the menu system. Text files contain
only ASCII characters including the IBM PC graphics and national characters (codes 128 255). All system and data files contain an identification string, to ensure that only valid files will
be used. The system uses four types of data files with identical file format, but with differences
in the mode (WOCE or ISO) and replication data (duplicates enabled or disabled). The
standard extension for data files is "DAT", but other extensions may be used.
Besides the data files, the software uses some system files with reserved names:
- DOA.CFG:
The configuration file, holding all configuration data, the data of the last
titration, standardization and blank determination, the file name of the
last used data file etc.
At the start, the program first tries to load this file from the drive and path
of the program, and if this fails to load the configuration file from the
current drive and directory. If no configuration file is found, the program
will ask if the file should be created with the default data.
- DOA.BOT:
The bottle file, holding all bottle data. If the configuration file exists, this
file is loaded from or created in the drive and path of the configuration
file, otherwise the current drive and directory will be used.
- DOA_*.HLP:
The help text files. The program tries first to locate these files in the
program path. If this fails, the program searches for the files in the
12
current directory. Note that no error or warning message is produced, if
no file is found.
- DOA_*.NDX:
The help index files.
- DOA_*.MSG:
The message text files.
- DOA_*.STM:
The status message files.
Please do not modify the data or system files, because this could produce unpredictable
results.
13
Chapter 4
The Menu System
4.1 Help System
To call up Help, press <F1>. The Help window details the functions of the item on which
you're currently positioned. To get to the Help Index press <F1> again once you're in the Help
system. Inside the index list you can choose your desired help index to get the attached help
text. For more information about the help system see section 4.3.30, Help Menu.
4.2 Status Line
The Status Line at the bottom of the screen contains some short information about the current
item you're on.
4.3 Menu Commands
For use of the keyboard and the mouse inside the menu system, see the tutorial.
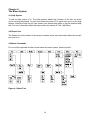
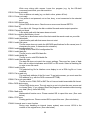
Figure 4.1 Menu Tree
14
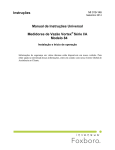
4.3.1 Main Menu
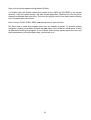
Figure 4.2 Main Menu
At the top of the main screen is the main menu bar, offering nine selections and displaying the
current time at the right:
≡ (About)
File
Bottle
Titration
BlankValue
Standard
Graph
Options
Help
Displays the product version information.
Handles files, invokes DOS and quitting the program.
Handles bottles (viewing, adding, deleting, printing).
Determination of the dissolved oxygen from a sample.
Blank Value (view or print current value, determination of blank value).
Standardization (view or print current data, determination of new data).
Display the graph of the last titration.
Allows you to configure your system and lets you check the hardware.
Invoke the help system (Help On Help, Help Index)
15
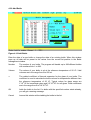
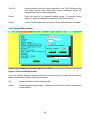
4.3.2 File Menu
Figure 4.3 File Menu
The File pull-down menu allows you to view and print existing data files, view and edit text
files, temporarily go to the DOS shell, or exit the program.
View Data
Allows you to view and print existing data files. After activation of View Data the
File Select window will pop up, prompting for input of a file name.
Text File
Lets you load an ASCII file vor viewing and editing. This command is only
available if an external editor is installed with the External item in the Options
menu.
OS Shell
Leaves the program temporarily and takes you to the DOS prompt. To return to
the program, type "EXIT <Enter>". This is useful when you want to run a DOS
command without quitting the program.
Quit
Quits the program and returns you to the DOS prompt. There is no verifying to
exit from the program, because all important data are saved automatically
before the program terminates.
16
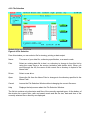
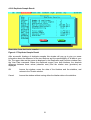
4.3.3 File Selection
Figure 4.4 File Selection
From this window you can select a file for viewing, printing or data output.
Name
The name of your data file, a directory specification, or a search mask.
Files
Select an existing data file to load, or a directory to change to from this list by
using the cursor keys or the mouse (activation with double click). When you
move through the list, the name of the current file or directory is copied to the
Name field.
Drives
Select a new drive.
Open
Opens the file from the Name Field or changes to the directory specified in the
Name Field.
Cancel
Leaves the File Selection Window without changing the current file name.
Help
Displays the help screen about the File Selection Window.
The file list contains only directories and files of the currently required types. At the bottom of
the window the current drive, path and search mask and the file size, date and time of the
currently selected file or directory are displayed.
17
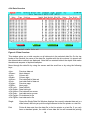
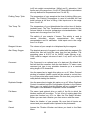
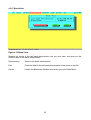
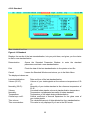
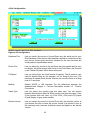
4.3.4 Data Overview
Figure 4.5 Data Overview
This window gives you a total overview on all data sets in the selected data file. On the top
border of the window the name of the data file, together with the drive where it is stored and
the determination method are displayed. Note that an asterisk behind the depth field marks
the data sets as parts of duplicate samples.
Move through the data file by using the mouse and the scroll bar or by using the following
keys:
<Up>:
Previous data set
<Down>:
Next data set
<Left>:
Column left
<Right>:
Column right
<Home>:
First data field of data set
<End>:
Last data field of data set
<PgUp>:
Previous page
<PgDn>:
Next page
<Ctrl-Left>: Data field left
<Ctrl-Right>: Data field right
<Ctrl-Home>: First data set on screen
<Ctrl-End>: Last data set on screen
<Ctrl-PgUp>: First data set in file
<Ctrl-PgDn>: Last data set in file
Single
Opens the Single Data Set Window, displays the currently selected data set in a
wide format, and lets you print the single data set to the line printer or a text file.
Print
Prints all data sets from the data file to the line printer or a text file. If you only
have a standard printer, the width of one data set line will exceed the printing
18
width of your printer. To get a readable output you can select the Split Printing
option in the Configuration window (see Options Menu).
Deviation
Displays statistics (precision, reproducibility) about the titration data from the
current data file. This option is only available if the data file contains duplicate
samples (see Duplicate Sample Control in the Options Menu / Configuration
Window).
Cancel
Leaves the Data Overview Window and returns you to the Files Menu.
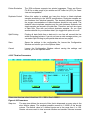
4.3.5 View Single Data Set
Figure 4.6 View Single Data Set
Displays a single data set in a wide, screen filling format.
Print
Prints the single data set to line printer or text file.
Cancel
Leaves the Single Data Set Window and returns you to the Data Overview
Window.
19
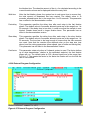
4.3.6 View Replication And Precision
Figure 4.7 View Replication and Precision
Displays statistics about the titration data from the selected data file.
Description of the statistic data:
Number of replicates:
The total number of duplicate samples in the data file.
Number of single samples: The total number of single samples in the data file.
Replication ratio:
The percentage ratio of the number of duplicates to the sum of
the number of duplicates and the number of single samples.
Max O2 concentration:
The maximal measured O2 concentration from this data file.
Standard deviation:
Standard deviation of differences from all duplicate samples.
Reproducibility:
Percentage reproducibility (2σ) of all duplicates relative to the
maximal O2 concentration.
Print
Prints the statistics to line printer or text file.
Cancel
Leaves the Replication And Precision Window and returns you to the Data
Overview Window.
20
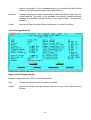
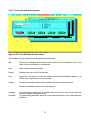
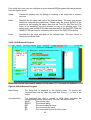
4.3.7 Print Menu
Figure 4.8 Print Menu
The Print Menu can be activated by many program items to print the currently selected and/or
displayed data to your line printer or to a text file.
Text File Name
The name and optional drive and/or path of the file, to which the output
should be written. If the output file exists already, you will get a warning
message, giving you the choice of overwriting the existing file, appending
the data to the file or leaving the Print Menu. Note that also the DOS
device names PRN, AUX, LPTn and COMn are valid names and that the
output will be directed to the specified DOS device instead of a file. By
pressing the function key <F2> you may open the File Select window to
choose an existing file or to change the drive or directory.
Text File
Prints the data to the file or device specified in the Text File Name field.
The output will be done without any control characters except the
carriage return and line feed sequences.
Printer
Prints the data to the selected parallel printer. For parallel printer
selection, open the Configuration Window in the Options Menu.
Cancel
Leaves the Print Menu and returns you to the previous menu or window.
21
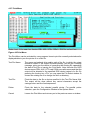
4.3.8 Bottle Management
Figure 4.9 Bottle Management
The Bottles Window contains the data management for your bottles.
View
A sorted list of all bottles. You can move through the list using the <Up>,
<Down>, <PgUp> and <PgDn> key, or by using the scroll bar with the mouse.
Add
To add a new bottle to the list or change the data of an existing bottle.
Delete
Removes the currently selected bottle from the list.
Print
Prints the complete list of bottles to line printer or text file.
Save
Leaves the Bottles Window and saves all data on disk.
Cancel
Leaves the Bottles Window without saving data.
22
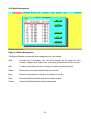
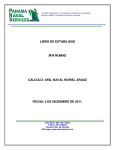
4.3.9 Add Bottle
Figure 4.10 Add Bottle
Enter the data of a new bottle or change the data of an existing bottle. When this window
pops up, all data will be preset to the values from the current list position in the Bottle
management window.
Number
The number of your bottle. The program will handle up to 999 different bottles
with numbers from 1 to 999.
Volume
The volume of your bottle in ml at the reference temperature of 20 °C. Valid
volumes are in the range from 8 to 600 ml.
α
The cubical coefficient of thermal expansion for the glass of your bottle. The
coefficient is used to calculate the bottle volume for temperatures different from
the reference temperature of 20 °C. Typical values for glass wares are
1*10-5/°C for borosilicate glass and 2.5*10-5/°C for soft glass. Valid coefficients
are in the range from 0 to 9.9*10-5/°C.
OK
Adds the bottle to the list. If a bottle with the specified number exists already,
you will get a warning message.
Cancel
Leaves this window without adding the bottle to the list.
23
4.3.10 Titration
Figure 4.11 Titration
Use this window to measure the dissolved oxygen in a sample.
Date
The date of the titration. The Date is an optional part of a data
set. By default this field will hold the current date. To enter a new
date, use the format dd.mm.yy or dd.mm.yyyy.
Time
The time of the titration. The Time is an optional part of a data
set. By default this field will hold the time when opening the
Titration Window. To enter a new time, use the format hh:mm.
Station
The Station name is an optional part of a titration data set. Before
starting a titration you can enter the name (max. 15 characters) of
your station. By default this field holds the station name from the
last titration.
Depth
The Depth is an optional part of a data set. Before starting a
titration you can enter the depth of your sampling (max. 5 digits).
By default this field holds the depth from the last titration.
Bottle Number
The number of your sampling bottle. Before you can start any
titration you have to enter a valid bottle number. For new bottle
numbers see the Add Bottle Window in the Bottles Window. If a
bottle with the specified number is not part of the bottle list, you
cannot leave this entry filed (except by closing the Titration
window) and an error message is displayed.
Sample Temp. Tsw
The temperature of your sample at the time of sampling. This
temperature is used to convert volumetric oxygen concentrations
24
(ml/l) into weight concentrations (µM/kg) and O2 saturation. Valid
inputs are in the range from -2 to 40 °C (Note that the calculations
are only defined for temperatures from 0 to 40 °C).
Pickling Temp. Tpick
The temperature of your sample at the time of pickling (filling your
bottle). The Pickling Temperature is used to calculate the real
bottle volume at the time of filling. Valid inputs are in the range
from -2 to 40 °C.
Titer Temp. Ttit
The temperature of your thiosulphate titer at the time of titration
(probably now). The Titer Temperature is used to correct the titer
volume relative to the titer temperature at standardization. Valid
inputs are in the range from 0 to 40 °C.
Salinity
The salinity of your sample, if known. The salinity is used to
convert volumetric oxygen concentrations into weight
concentrations and O2 saturation. Valid inputs are in the range
from 0 to 43 psu.
Reagent Volume
The volume of your sample in ml displaced by the reagents.
Abs. Reag. Oxygen
The absolute amount of oxygen in ml added with the reagents. By
default this field will hold the value from the last titration. The
presetting value is 0.0017 ml for WOCE mode (Murray et al.,
1968, valid for reagent volumes of each 1 ml) and 0 ml for ISO
mode.
Comment
The Comment is an optional part of a data set. By default this
field will hold the comment from the last titration. To enter a new
comment just type in any printable character up to a maximal
string length of 18 characters.
Protocol
Use the space bar to toggle this option on or off. When Protocol
printing is enabled, titration results will be printed in a short form
to your line printer after each titration. Be sure that your printer is
ready before starting the titration.
Duplicate Sample
Use the space bar to toggle this option on or off. When Duplicate
Control is enabled (see the Configuration Window in the Options
Menu) you can specify that this titration will be a duplicate one.
This option is not available if Duplicate Control is disabled.
File Name
The name (and optional drive or path) of the file to which the
titration results will be written. To get a list of existing data files
press the function key <F2> to open the File Select Window.
Before you can start a titration you must enter a valid file name.
Start
Starts the titration of your sample. Be sure that all inputs are
correct and your sample bottle is placed in the photometer.
Cancel
Leaves the Titration Window and takes you back to the Main
Menu.
25
4.3.11 Input Maximal Transmission
Figure 4.12 Input Maximal Transmission
This window exists only if you are working with a 2-channel photometer.
Blue Transmission
This value cannot be changed; it is the current percentage
transmission of the blue beam.
Red Transmission
This value cannot be changed; it is the current percentage
transmission of the red beam. The Estimated Endpoint entry field
below will hold a value calculated from the red transmission and a
correction factor.
Estimated Endpoint
The estimation of the percentage transmission value of your
sample after titration. If your sample is turbid, this value may be
too high. So you can change the value to avoid an over titration.
Note that decreasing the estimated endpoint results in increasing
titration times. Normally the Estimated Endpoint is calculated from
the red transmission, a correction factor, and a general offset.
Turbid samples, especially samples with photosynthetic microorganisms, will have a higher blue than red light absorption.
Therefore, it is better to decrease the presetting in such a case.
OK
Starts the titration using the above specified estimated endpoint.
Help
Displays the help text about the endpoint estimation.
Cancel
Aborts the starting of titration and returns you to the Titration
Window.
26
4.3.12 Titration Running
Figure 4.13 Titration Running
During titration the current titration values (titer amount, percentage transmission, estimated
endpoint and titration time) are displayed continuously in the Titration Running Window. If you
want to interrupt the titration, just press <Esc> and confirm the User Break Message with OK.
Note that you can go on with the titration by selecting Cancel, but if you are already in the
slow titration phase the results may be inexact for longer (more than two seconds) delay
times.
The displayed values are:
Titer:
Transmission:
Est. Endpoint:
Time:
Status:
Total amount of dispensed titer.
Percentage transmission of the blue beam.
Estimated percentage transmission after end of titration.
Total time in seconds since starting the titration.
Current titration step.
The status line can contain the following titration steps:
Dispense:
Read:
Wait:
Titer is dispensed into sample.
System reads transmission from photometer.
Delay cycle to ensure the chemical reaction of the titer.
27
4.3.13 Titration Finished
Figure 4.14 Titration Finished
This window will pop-up after a successful titration to display the titration results.
OK
Leaves the Titration Finished Window, saves the results in the specified data
file and returns you to the Titration Window. If you had selected a duplicate
sample and the first titration was just finished, the results will not yet be saved
and you will not return to the Titration Window. Instead another window will pop
up, prompting you for the bottle number of the second bottle. After the second
titration, this window will pop up again and the data of the duplicate sample will
be saved after leaving this window.
Graph
Displays the graph of the titration curve. For more information see The Graph
Window in the Main Menu.
Log
Opens the Log menu to write the titration data (titer-transmission pairs) to an
ASCII file or to print them on a line printer.
Print
Prints the complete data of the titration to line printer or text file. The print format
will be the same when printing a single data set from a data file.
The displayed values are:
Accuracy:
Titer volume:
This value is calculated during the approximation of the titration curve
and gives you information about the accuracy of the endpoint
calculation. It is the percentage standard deviation relative to the
calculated titer volume. If there are many titration steps and little noise
the accuracy may be very good (better than 0.01 %), because of the
optimization algorithm.
The calculated titer volume at the titration endpoint.
28
O2 concentration:
Titration time:
The O2 concentration in ml/l, mg/l, µM/kg and the percentage O2
saturation.
The total time for the titration.
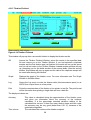
4.3.14 Log Menu
Figure 4.15 Log Menu
After each titration, regardless of the conditions (oxygen, standard or blank determination),
the Log Menu can be activated to write the pure titration data to an ASCII file or to print them
on a line printer. These titration data consist of a header, the titration data table with titertransmission pairs, and the calculated endpoint with intermediate results from the titration
algorithm. The data may be used to plot titration curves or check the titration algorithm. The
Log menu is similar to the Print menu. If you have specified the command line option '/X' (see
chapter 3, item 3.4 Command Line Syntax) the titration data will be written automatically to
the log file after each titration.
Text File Name
The name and optional drive and/or path of the file, to which the output
should be written. If the output file exists already, you will get a warning
message, giving you the choice of overwriting the existing file, appending
the data to the file or leaving the Log Menu. Note that also the DOS
device names PRN, AUX, LPTn and COMn are valid names and that the
output will be directed to the specified DOS device instead of a file.
output will be directed to the specified DOS device instead of a file. By
pressing the function key <F2> you may open the File Select window to
choose an existing file or to change the drive or directory.
29
Text File
Logs the data to the file or device specified in the Text File Name field.
The output will be done without any control characters except the
carriage return and line feed sequences.
Printer
Prints the data to the selected parallel printer. For parallel printer
selection, open the Configuration Window in the Options Menu.
Cancel
Leaves the Print Menu and returns you to the previous menu or window.
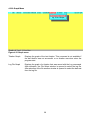
4.3.15 Second Bottle Number
Figure 4.16 Second Bottle Number
If you are inside a duplicate sample titration this window will pop up after the first titration,
asking for the bottle number of the second sample.
OK
Starts the titration of the second sample.
Cancel
Stops duplicate sample titration. The data of the first titration will be treated as a
normal titration.
30
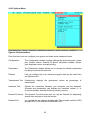
4.3.16 Duplicate Sample Result
Figure 4.17 Duplicate Sample Result
After successful titrations of duplicate samples this window will pop up to give you some
information about the difference of the two titrations and the reproducibility of all data in your
file. The upper data are the same as displayed in the Replication and Precision window from
the View Data command. Below the dissolved oxygen from both titrations, the absolute
difference between these values (absolute error) and the relative error (precision) are
displayed.
OK
Leaves the window, saves the data of the titrations and the statistics, and
returns to the Titration window.
Cancel
Leaves the window without saving either the titration data or the statistics.
31
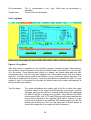
4.3.17 Blank Value
Figure 4.18 Blank Value
Displays the results of the last blank determination, lets you print them, and gives you the
choice to start a new blank determination.
Determination
Starts a new blank determination.
Print
Prints the data of the last blank determination to line printer or text file.
Cancel
Leaves the Blankvalue Window and returns you to the Main Menu.
32
4.3.17.1 First Blank Determination
Figure 4.18.1 First Blank Determination
This window will pop up after the first blank titration.
Next
Starts the next blank titration.
Graph
Displays the curve of the last titration.
Log
Opens the Log menu to write the titration data (titer-transmission pairs) to an
ASCII file or to print them on a line printer.
Cancel
Interrupts the blank determination without saving data.
33
4.3.17.2 Additional Blank Determination
Figure 4.18.2 Additional Blank Determination
This is the window after some additional blank titrations. Note that the window contains
another push button and that the blank value is now calculated from the first and the
additional titrations. After each blank titration, the window contains one line more to display
the results of all titrations. The maximum number of blank titrations is limited to eight.
Therefore, the 'Next' button is not available after the eighth titration.
OK
Leaves the blank determination and saves the new blank value.
Next
Starts the next blank titration. This button does not exist after the last (eighth)
titration.
Graph
Displays the curve of the last titration.
Log
Opens the Log menu to write the titration data (titer-transmission pairs) to an
ASCII file or to print them on a line printer.
Cancel
Leaves the blank determination without saving the blank value.
2...8
Enable or disable the result of the corresponding titration. Note that the first
value cannot be disabled, because it is necessary to calculate the blank value.
34
4.3.18 Standard
Figure 4.19 Standard
Displays the results of the last standardization, lets you print them, and gives you the choice
to start a new standardization.
Determination
Opens the Standard Parameter Window to enter the standard
parameters and start a new standardization.
Print
Prints the data of the last standardization to line printer or text file.
Cancel
Leaves the Standard Window and returns you to the Main Menu.
The displayed values are:
Last standardization:
Volume (20 °C):
Normality (20 °C):
Volume:
Normality:
Temperature:
Cubical exp. coeff.:
Titer volume:
Titer concentration:
Date and time of the last standardization.
Volume of your iodate pipette at the reference temperature of 20
°C.
Normality of your iodate standard at the reference temperature of
20 °C.
Corrected iodate pipette volume at standardization temperature.
Temperature compensated normality of iodate standard.
Temperature of the iodate during standardization.
Cubical coefficient of thermal expansion for the glass ware of
your iodate pipette.
The calculated amount of thiosulphate titer from standardization.
This value is only displayed if you are in the ISO mode.
35
4.3.19 Standard Parameters
Figure 4.20 Standard Parameters
Enter the data for a new standardization and start standardization. The ISO standard does
not support different parameters for standardizations. Therefore all parameters are set to the
default values when this window pops up, but you may enter any other value.
If you are in WOCE mode the fields will contain the data from the last standardization or the
default values if this is the first standardization.
Volume
The volume of your iodate standard at the reference temperature of 20
°C. Default volumes are 10 ml for the WOCE standard and 20 ml for the
ISO standard.
Normality
The normality of your iodate standard (= 6 molarity) at the reference
temperature of 20 °C. The default values are 0.01 N for the WOCE
standard and 10 mmol/l for the ISO standard.
Temperature
The current temperature of your chemicals. Note that all reagents and
the thiosulphate titer should have the same temperature. The default
temperature is 20 °C for WOCE and ISO standard.
Cub. Exp. Coeff.
The cubical coefficient of thermal expansion for the glass of your iodate
pipette. The default value is zero for WOCE and ISO standard.
Start
Starts the new standardization. After standardization you will return to
the Standard Window which will display the new results, if the
standardization was successful.
Cancel
Leaves the Standardization Window and returns you to the Standard
Window.
36
4.3.19.1 First Standard Determination
Figure 4.20.1 First Standard Determination
This window will pop up after the first standard blank titration.
OK
Leaves the standard determination and saves the new standard value if the
result of the first titration is not disabled.
Next
Start another standard titration.
Graph
Displays the curve of the first titration.
Log
Opens the Log menu to write the titration data (titer-transmission pairs) to an
ASCII file or to print them on a line printer.
Cancel
Leaves the standard determination without saving the standard value.
1
Enable or disable the result of the first titration.
Average:
The resulting average from all marked titrations (the titer volume after the first
titration if enabled, otherwise zero).
The percentage standard deviation of all marked titrations (zero if less than two
titrations).
Accuracy:
37
4.3.19.2 Additional Standard Determination
Figure 4.20.2 Additional Standard Determination
This is the window after some additional standard titrations. Note that the average is now
calculated from all marked titrations. After each standard titration, the window contains one
line more to display the results of all titrations. The maximum number of standard titrations is
limited to ten. Therefore, the 'Next' button is not available after the tenth titration.
OK
Leaves the standard determination and saves the new standard value if it is not
zero (all titrations disabled).
Next
Starts another standard titration. This button does not exist after the last (tenth)
titration.
Graph
Displays the curve of the last titration.
Log
Opens the Log menu to write the titration data (titer-transmission pairs) of the
last titration to an ASCII file or to print them on a line printer.
Cancel
Leaves the standard determination without saving the standard value.
1...9, 0
Enable or disable the result of the corresponding (first to tenth) titration.
Average:
Accuracy:
The resulting average from all marked titrations.
The percentage standard deviation of all marked titrations (zero if less than two
titrations).
38
4.3.20 Graph Menu
Figure 4.21 Graph menu
Titration Graph
Displays the graph of the last titration. This command is not available if
the last titration was not successful or no titration was done since the
program start.
Log File Graph
Displays the graph of a titration that was saved with the Log command.
After activation, the File Select window is opened to select the log file.
After selection of the file another window is opened to select the data set
from the log file.
39
4.3.21 Select Data Set from Log File
Figure 4.22 Select Log File Data Set
Select the data set for display of the titration curve.
Graph
Displays the titration curve of the currently selected data set. After leaving the
graphics display you are returned to this window for another selection.
Cancel
Leaves the selection window.
Note that the displayed date and time stamp is not the time of titration, but the time of data
logging.
40
4.3.22 Titration Curve
Figure 4.23 Titration Curve
Displays the graph of a titration.
<Esc>
<G>rid
<L>in/Log
<D>ata field
<P>rint
Leaves graphic mode.
Graphics display with or without grid.
Graphics display with linear or logarithm transmission values.
Displays/removes data field.
Prints graph to line printer (your printer must be EPSON-FX compatible for
printing in graphic mode).
Zoom <I>n Enlarges view port.
Zoom <O>ut Reduces view port.
Left
Moves graph view port to left.
Right
Moves graph view port to right.
At the bottom right of the graph some important values relating to the curve are displayed.
These include the current date and time, the calculated endpoint and the accuracy of the
endpoint calculation. The graph itself will mark the beginning of the slow titration, the inflection
point of the approximation function and the calculated endpoint. If an approximation was
possible this function will be drawn from the slow point to the end line and the corresponding
e-function will be drawn from the inflection point to the endpoint.
41
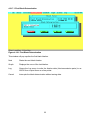
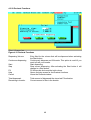
4.3.23 Options Menu
Figure 4.24 Options Menu
From this menu you can configure your system and make some hardware checks.
Configuration
The Configuration window contains settings like photometer port, printer
port, burette volume, Dosimat fill speed, calculation method, monitor
type, duplicate control, and split printing.
Parameters
The Parameters window allows you to change the titration parameters
like delay times and titer amounts.
External
Lets you configure up to ten external programs that can be called from
the Options menu.
Transmission Test
Continuously displays the photometer values as percentage of
transmission.
Hardware Test
Checks the connection between your computer and the hardware
(Dosimat and photometer) and displays the hardware version (1- or
2-channel system), and the remaining memory amount.
Dosimat Functions The Dosimat Functions menu lets you use the Dosimat for dispensing
specific titer volumes or flush the burette.
Readme File
An example for an external program call. The example calls the DOS
program EDIT.COM with the file README.DOC.
42
4.3.24 Configuration
Figure 4.25 Configuration
Hardware Port
Lets you select (by mouse or Up and Down key) the serial port for your
DOA hardware. Note that no other hardware should be connected to this
port and no device driver should be installed for this port, because this
could produce unpredictable results.
Printer Port
Lets you select (by mouse or Up and Down key) the parallel port for your
line printer. All printer output (see Printer in the Print Menu and Protocol
in the Titration Window) will be done to this port.
Fill Speed
Lets you select from four fixed burette fill speeds. The fill speed is only
valid for burette filling by the program, not for filling by the user. The
maximum fill speed (three burette volumes per minute) results in a filling
time of 23 seconds.
Method
Selects WOCE or ISO standard. For the differences between the
standards see Chapter 2 - Function Description, section 2.3 - Titration
Procedures.
Video Type
Lets you select your monitor type and video card. You can choose
between Monochrome (Black & White monitor with Hercules card), Color
(Color monitor with color card, e.g. CGA, EGA, VGA) and LCD (Liquid
Crystal Display or grey scale monitor).
Burette Volume
Lets you select (by mouse or Up and Down key) the cylinder volume of
your burette. Be sure to have the correct volume (it is printed in front of
the exchange unit), because all titration results are based on the burette
volume.
43
Printer Emulation
The DOA software supports two printer languages. These are Epson
FX-80 for a wide range of pin writers and HP Laser Jet (PCL) for Laser
Jets and compatibles.
Duplicate Control
When this option is enabled you have the choice to titrate duplicate
samples according to the WOCE specifications. Duplicate samples are
two titrations from identical samples. The absolute difference between
the oxygen concentrations of these titrations should be very small. The
statistics about duplicate samples and the ratio between duplicate and
single samples are stored in the data files. Therefore, we have two types
of data files: Files with and without duplicate samples. So you need
another data file for your titration data if you toggle this option on or off.
Split Printing
Printing all data fields from a data set in one line will exceed the line
width of standard printers. If you do not have a wide carriage printer, you
can select Split Printing to print partial data sets on two pages.
Save
Saves the settings in the configuration file, leaves the Configuration
Window and returns you to the Options Menu.
Cancel
Leaves the Configuration Window without saving the settings and
returns you to the Options Menu.
4.3.25 Titration Parameters
Figure 4.26 Parameters
Step size
The step size defines the amount of titer that is dispensed on every step in the
slow titration phase. The smallest possible amount is 1/10000 of the burette
volume. The default value is 5; allowed inputs are in the range from 1 to 100.
Greater volumes result in less accurate titration and smaller volumes increase
44
the titration time. The absolute amount of titer in µl is calculated according to the
current burette volume and is displayed behind the entry field.
Wait time
After the fast titration phase, the system has to wait some time to ensure that
the total amount of dispensed titer has reacted. The default value is 10
seconds; allowed inputs are in the range from 1 to 60 seconds. This parameter
has no effect in the demonstration version.
Fast delay
This parameter specifies the delay time after each step in the fast titration
phase. The default value is 2 seconds; allowed inputs are in the range from 1 to
60 seconds. If the delay time is too short, it could occur that the sample is over
titrated. Greater times result in longer titration times. This parameter has no
effect in the demonstration version.
Slow delay
This parameter specifies the delay time after each step in the slow titration
phase. The default value is 2 seconds; allowed inputs are in the range from 1 to
60 seconds. The time has to be long enough to ensure that the titer amounts
can react. Note that the reaction time depends also on the step size (see
above) and the mixing parameters (stirrer speed, type of bottle and stirring bar).
This parameter has no effect in the demonstration version.
Fast factor
This parameter exists only when a 2-channel system is used. The factor defines
up to what transmission, relative to the estimated endpoint, the fast titration
phase will run. The default value is 0.92; allowed inputs are in the range from
0.01 to 1.0. The greater the factor is, the faster the titration will run but with the
risk of over titration.
4.3.26 External Program Configuration
Figure 4.27 External Program Configuration
45
From within this menu you can configure up to ten external DOS programs that can be started
from the Options menu.
Select
Choose an existing entry for editing or removing or an empty line to create a
new one.
Editor
Specifies the file name and path of the external editor. The entry may contain
additional command line parameters. Please insert the macro '@FILE' at the
position for the working file name. Note that the Text File item from the File
menu is not available if this field contains no entry to an existing editor. The
default entry uses the MS-DOS editor and requires that the files EDIT.COM and
QBASIC.EXE are stored in a directory that is part of the DOS PATH setting.
Lister
Specifies the file name and path of the external lister. The input format is
identical to the Editor field.
4.3.26.1 Edit External Program
Figure 4.28 Edit External Program
Menu String
The string that is displayed in the Options menu. To remove this
command from the list, clear this input field. Place a ‘^’ in front of the
hotkey.
Command Line
The command line that is passed to DOS when activating the
corresponding Options menu entry. You may use these macros:
@LIST
The external lister
@EDIT
The external editor
@D
The current data file name
@L
The current log file name
@T
The current text file from the Print menu
46
Status Line
The status message that is displayed when the cursor is on the
corresponding line in the Options menu.
Restore/Save
When enabled, the old DOS screen is restored before executing the
external program and saved after return. Otherwise the external program
is started in a blank screen.
Internal Command If the command is not an executable (BAT, COM or EXE) but an internal
DOS command (e.g. DIR, TYPE) you must enable this option.
Wait Key
If this option is enabled, the program waits for a keystroke after
executing the external command. This option is useful to have a look at
the external program output before returning to DOA.
4.3.27 Transmission Test
Figure 4.29 Transmission Test
In this window the photometer values of the blue and red (for 2-channel systems) beams will
be displayed continuously. The output is in percentage transmission relative to an absolute
transmission value of 30,000. Note that greater values than 100% are possible and valid.
47
4.3.28 Hardware Test
Figure 4.30 Hardware Test
Checks the hardware (Photometer, Dosimat), the hardware version, and displays the
amount of free memory.
The status displayed for each test means:
Detected:
Not Detected:
1-/2-channels:
OK (nnn %):
Too high (nnn %):
Too low (nnn %):
No errors (Photometer and Dosimat)
Hardware not found (Photometer, Hardware Version and Dosimat)
The hardware version. If you are working with a 2-channel system and
the program detects only a one channel system, check the cable
between computer and titrator.
The transmission is in the correct range.
Transmission is too high, calibration necessary
Transmission is too low, calibration necessary
If the transmission is too low or too high, a message will be displayed that a new
calibration is necessary. If the transmission is too high you can still use the titrator
providing the transmission for a bottle with pure water is below 93.4 % and the
transmission without bottle is below 109 %. If the transmission is too low (less than 93.4%
without bottle) the system will not work.
Note that the photometer has a warmup time of about five minutes and that the
transmission values in the warmup phase could be out of range.
48
4.3.29 Dosimat Functions
Figure 4.31 Dosimat Functions
Dispensing Volume
Fill
Help
Cancel
Entry field for the volume that will be dispensed when activating
the Start button.
Continuously dispense and fill burette. This option is useful if you
want to flush your burette.
Start dispensing.
Stop current dispensing. After activating the Start button it will
change to a Stop button.
Fill the burette and reset the total volume.
Opens the help screen for the Dosimat functions.
Leave the Dosimat window.
Total dispensed:
Remaining in burette:
Total amount of dispensed titer since last Fill activation.
Current amount of titer in the burette.
Continuous dispensing
Start
Stop
49
4.3.30 Help Menu
Figure 4.32 Help Menu
Get Help on some specific items.
Help on Help
Displays the help text about the usage of the help system.
Help Index
Displays the Help Index list.
Figure 4.33 Help Index
50
To select an item use the <Up>, <Down>, <PgUp> or <PgDn> key and press return or use
the scroll bar with the mouse and double click on the left button at the desired item.
51
Chapter 5
Printings
5.1 Printers
To produce readable printer output your printer must be able to print the IBM PC character
set. For printing complete data files, titration protocols or titration curves, your printer must be
EPSON-FX or HP PCL compatible.
If you don't have a compatible printer, you may use a screen capture program to send the
graphics screen image to your printer. Some capture programs make it possible to merge
screen images into documents produced by some word processors. These programs are
useful with any program including DOA, from which you want to capture a graphics screen
image.
Most screen capture programs are resident programs that must be run before you start DOA.
They are usually activated by pressing the <PrintScreen> key.
5.2 Printing Formats
This section will give you an overview of the printing formats produced on line printer or text
file output. The frames are not part of the printings.
Figure 5.1 Bottle List
No.
63
64
65
77
79
80
93
98
99
Volume
59.710
59.540
59.500
59.560
58.990
59.920
59.090
59.790
59.710
ml
ml
ml
ml
ml
ml
ml
ml
ml
a
1.0E-5
1.0E-5
1.0E-5
1.0E-5
1.0E-5
1.0E-5
1.0E-5
1.0E-5
1.0E-5
1/°C
1/°C
1/°C
1/°C
1/°C
1/°C
1/°C
1/°C
1/°C
Figure 5.2 Standard data (WOCE mode)
Last standardization
Volume (20°C)
Normality (20°C)
Volume (Tstd)
Normality (Tstd)
Temperature Tstd
Cubical expansion coeff.
Titer volume
: 03.12.1992 11:42
:
10.0000 ml
:
0.0100
:
10.0000 ml
:
0.0100
:
20.000 °C
:
1.0E-5 1/°C
:
0.8844 ml
52
Figure 5.3 Blank Data
Last blank determination
Blank value
: 01.12.1992 11:21
:
-0.0002 ml
Figure 5.4 Single Data Set (WOCE mode)
Method
Date
Time
Station
Depth
Bottle number
Bottle volume (Tp)
Bottle volume (20°C)
Cubical expansion coeff.
Sample temperature Tsw
Pickling temperature Tp
Titer temperature Ttit
Salinity
Burette volume
Blank volume
Standard volume
Iodate volume
Iodate normality
Reagent volume
Abs. oxygen from reagents
Accuracy of endpoint
Titer volume
O2 concentration
O2 concentration
O2 concentration
O2 concentration
Comment
:
:
:
:
:
:
:
:
:
:
:
:
:
:
:
:
:
:
:
:
:
:
:
:
:
:
:
WOCE
01.02.93
13:27
SiS
0
m
64
59.531 ml
59.540 ml
1.0E-5 1/°C
3.200 °C
4.100 °C
19.100 °C
31.400 psu
1
ml
-0.0016 ml
0.7223 ml
10.0000 ml
0.0100
2.0000 ml
0.0017 ml
0.029 %
0.3794 ml
5.0918 ml/l
7.2765 mg/l
221.853 mM/kg
67.091 %
Demo measurement
Figure 5.5 Deviation Data
Replication and precision
File
Number of replicates
Number of single samples
Replication ratio
Max O2 concentration
Standard deviation s
Reproducibility
: C:\DOA\DEMO\WOCE_D.DAT
:
3
:
32
:
8
%
:
8.980 ml/l
:
0.017
:
0.37 %
53
Figure 5.6 Log File
Titration logged 22.05.1995 09:05
Date
: 22.05.95
Time
: 09:04
Station
: station
Depth
:
0
Bottle number
:
99
1
0.0
5007 1
2
54.7
6602 1
3
103.3
8453 1
4
144.8 10451 1
5
178.6 12423 1
6
204.8 14197 1
7
224.2 15694 1
8
237.9 16853 1
9
247.1 17684 1
10
253.1 18266 1
11
256.9 18637 1
12
259.3 18895 1
13
260.7 19059 1
14
261.4 19181 1
15
261.9 19258 0
16
262.4 19338 0
17
262.9 19405 0
18
263.4 19483 0
19
263.9 19558 0
20
264.4 19645 0
21
264.9 19721 0
22
265.4 19795 0
23
265.9 19880 0
24
266.4 19957 0
25
266.9 20036 0
26
267.4 20107 2
27
267.9 20199 0
28
268.4 20272 0
29
268.9 20355 0
30
269.4 20448 0
31
269.9 20521 0
32
270.4 20597 2
33
270.9 20690 0
34
271.4 20776 0
35
271.9 20857 0
36
272.4 20940 0
37
272.9 20947 0
38
273.4 20945 0
39
273.9 20948 0
40
274.4 20932 0
41
274.9 20943 0
42
275.4 20937 0
43
275.9 20937 0
44
276.4 20944 0
45
276.9 20937 0
Slow titration index:
14
Inflection point index:
35
Optimize end point index:
35
End transmission:
20941
Used end point:
272.39 µl
No poly end point:
272.35 µl
Inflection point titer:
271.90 µl
Inflection point ln(transmission):
9.9455
Slope at inflection point:
0.00809627
Accuracy of endpoint detection:
0.011
Polynomial coefficient A:
1.46378098E+001
Polynomial coefficient B:
-6.57695760E-002
Polynomial coefficient C:
2.63590955E-004
Polynomial coefficient D:
-3.13248045E-007
54
Figure 5.7 Complete Data File Part 1
File: C:\DOA\WOCE_D.DAT
Date
Time Station
01.02.93 13:24 SiS
01.02.93 13:27 SiS
01.02.93 13:31 SiS
01.02.93 13:34 SiS
01.02.93 13:37 SiS
01.02.93 13:41 SiS
01.02.93 13:44 SiS
01.02.93 13:47 SiS
01.02.93 13:50 SiS
01.02.93 13:53 SiS
01.02.93 13:55 SiS
01.02.93 13:59 SiS
01.02.93 13:59 SiS
01.02.93 14:06 SiS
01.02.93 14:10 SiS
01.02.93 14:14 SiS
01.02.93 14:17 SiS
01.02.93 14:20 SiS
01.02.93 14:24 SiS
01.02.93 14:27 SiS
01.02.93 14:31 SiS
01.02.93 14:35 SiS
01.02.93 14:40 SiS
01.02.93 14:40 SiS
05.02.93 12:38 SiS
09.02.93 10:59 SiS
09.02.93 11:07 SiS
10.02.93 13:37 SiS
10.02.93 13:42 SiS
10.02.93 14:07 SiS
10.02.93 14:10 SiS
10.02.93 15:52 SiS
10.02.93 15:56 SiS
03.03.93 09:49 SiS
03.03.93 09:55 SiS
03.03.93 10:58 SiS
19.04.93 11:07 SiS
19.04.93 11:07 SiS
Depth Bo# BotVol BVol20
Botα
Tsw Tpick Ttit Sal. Bur
0 63 59.71 59.71 1.0E-5 14.30 14.70 19.10 0.00 1
0 64 59.53 59.54 1.0E-5 3.20 4.10 19.10 31.40 1
0 65 59.49 59.50 1.0E-5 -0.40 1.20 19.10 33.70 1
0 77 59.56 59.56 1.0E-5 17.30 17.45 19.10 17.60 1
0 79 58.99 58.99 1.0E-5 23.40 23.35 19.10 18.10 1
0 80 59.92 59.92 1.0E-5 17.30 17.30 19.10 23.80 1
0 93 59.08 59.09 1.0E-5 6.70 7.10 19.10 27.10 1
0 98 59.79 59.79 1.0E-5 18.30 18.30 19.10 31.40 1
0 99 59.71 59.71 1.0E-5 12.10 12.40 19.10 33.90 1
0 63 59.70 59.71 1.0E-5 4.50 4.90 19.10 28.60 1
0 64 59.54 59.54 1.0E-5 17.20 17.25 19.20 28.00 1
0* 65 59.50 59.50 1.0E-5 15.60 16.10 19.20 27.50 1
0* 77 59.56 59.56 1.0E-5 15.60 16.10 19.20 27.50 1
0 79 58.99 58.99 1.0E-5 13.20 13.40 19.20 33.90 1
0 80 59.92 59.92 1.0E-5 23.90 23.80 19.20 31.70 1
0 93 59.08 59.09 1.0E-5 2.20 2.80 19.20 29.80 1
0 98 59.79 59.79 1.0E-5 16.80 17.00 19.20 28.10 1
0 99 59.71 59.71 1.0E-5 18.10 18.10 19.20 21.80 1
0 63 59.71 59.71 1.0E-5 18.20 18.10 19.20 31.35 1
0 64 59.53 59.54 1.0E-5 3.20 4.10 19.20 18.90 1
0 65 59.49 59.50 1.0E-5 8.70 9.30 19.20 27.87 1
0 77 59.56 59.56 1.0E-5 14.30 14.70 19.20 29.20 1
0* 98 59.79 59.79 1.0E-5 15.40 15.80 19.20 24.20 1
0* 99 59.71 59.71 1.0E-5 15.40 15.80 19.20 24.20 1
0 63 59.71 59.71 1.0E-5 15.30 15.50 18.70 16.20 1
0 63 59.71 59.71 1.0E-5 17.60 17.70 18.30 28.30 1
0 99 59.71 59.71 1.0E-5 17.60 17.70 18.30 23.15 1
0 63 59.71 59.71 1.0E-5 12.30 12.50 18.90 31.05 1
0 64 59.54 59.54 1.0E-5 17.10 17.20 18.90 26.90 1
0 65 59.49 59.50 1.0E-5 8.60 8.90 18.90 18.50 1
0 77 59.56 59.56 1.0E-5 11.70 11.90 18.90 16.70 1
0 79 58.99 58.99 1.0E-5 17.10 17.10 19.10 28.30 1
0 99 59.71 59.71 1.0E-5 17.10 17.10 19.10 27.95 1
0 63 59.71 59.71 1.0E-5 17.10 17.10 18.40 20.60 1
0 64 59.54 59.54 1.0E-5 17.10 17.10 18.40 21.10 1
0 65 59.49 59.50 1.0E-5 10.20 10.70 18.60 16.50 1
0* 64 59.53 59.54 1.0E-5 10.20 10.70 18.60 31.25 1
0* 65 59.49 59.50 1.0E-5 10.20 10.70 18.60 31.25 1
55
Figure 5.8 Complete Data File Part 2
Page: 1
Blank
-0.0016
-0.0016
-0.0016
-0.0016
-0.0016
-0.0016
-0.0016
-0.0016
-0.0016
-0.0016
-0.0016
-0.0016
-0.0016
-0.0016
-0.0016
-0.0016
-0.0016
-0.0016
-0.0016
-0.0016
-0.0016
-0.0016
-0.0016
-0.0016
-0.0016
-0.0016
-0.0016
-0.0026
-0.0026
-0.0026
-0.0026
-0.0002
-0.0002
-0.0002
-0.0002
-0.0002
-0.0002
-0.0002
StdVol
0.7223
0.7223
0.7223
0.7223
0.7223
0.7223
0.7223
0.7223
0.7223
0.7223
0.7223
0.7223
0.7223
0.7223
0.7223
0.7223
0.7223
0.7223
0.7223
0.7223
0.7223
0.7223
0.7223
0.7223
0.7223
0.7223
0.7117
0.7117
0.7117
0.7117
0.7117
0.7806
0.7806
0.7410
0.7410
0.7410
0.8409
0.8409
IOVol
10.000
10.000
10.000
10.000
10.000
10.000
10.000
10.000
10.000
10.000
10.000
10.000
10.000
10.000
10.000
10.000
10.000
10.000
10.000
10.000
10.000
10.000
10.000
10.000
10.000
10.000
10.000
10.000
10.000
10.000
10.000
10.000
10.000
10.000
10.000
10.000
10.000
10.000
ION
0.0100
0.0100
0.0100
0.0100
0.0100
0.0100
0.0100
0.0100
0.0100
0.0100
0.0100
0.0100
0.0100
0.0100
0.0100
0.0100
0.0100
0.0100
0.0100
0.0100
0.0100
0.0100
0.0100
0.0100
0.0100
0.0100
0.0100
0.0100
0.0100
0.0100
0.0100
0.0100
0.0100
0.0100
0.0100
0.0100
0.0100
0.0100
RegVol
2.0000
2.0000
2.0000
2.0000
2.0000
2.0000
2.0000
2.0000
2.0000
2.0000
2.0000
2.0000
2.0000
2.0000
2.0000
2.0000
2.0000
2.0000
2.0000
2.0000
2.0000
2.0000
2.0000
2.0000
2.0000
2.0000
2.0000
2.0000
2.0000
2.0000
2.0000
2.0000
2.0000
3.0000
3.0000
3.0000
3.0000
3.0000
DOReg
0.0017
0.0017
0.0017
0.0017
0.0017
0.0017
0.0017
0.0017
0.0017
0.0017
0.0017
0.0017
0.0017
0.0017
0.0017
0.0017
0.0017
0.0017
0.0017
0.0017
0.0017
0.0017
0.0017
0.0017
0.0017
0.0017
0.0017
0.0017
0.0017
0.0017
0.0017
0.0017
0.0017
0.0017
0.0017
0.0017
0.0017
0.0017
TitVol
0.0107
0.0292
0.0137
0.0215
0.0143
0.0165
0.0141
0.0136
0.0128
0.0081
0.0131
0.0248
0.0265
0.0149
0.0294
0.0175
0.0137
0.0125
0.0148
0.0191
0.0166
0.0146
0.0131
0.0105
0.0108
0.0110
0.0270
0.0223
0.0151
0.0135
0.0116
0.0164
0.0090
0.0140
0.0147
0.0216
0.0114
0.0212
Acc.
0.3678
0.3794
0.3138
0.5678
0.6080
0.4517
0.4775
0.2796
0.3611
0.4103
0.4462
0.4477
0.4478
0.2785
0.2792
0.3881
0.4247
0.4298
0.2122
0.4326
0.3780
0.3023
0.3694
0.3702
0.6707
0.3536
0.4294
0.3137
0.4239
0.5037
0.4822
0.4349
0.4587
0.5173
0.5075
0.6736
0.5608
0.5609
56
ml/l
4.921
5.092
4.213
7.620
8.242
6.023
6.461
3.733
4.831
5.491
5.989
6.013
6.008
3.771
3.720
5.250
5.675
5.751
2.836
5.807
5.076
4.054
4.935
4.953
8.980
4.730
5.832
4.266
5.780
6.872
6.572
5.444
5.672
6.862
6.752
8.978
6.574
6.580
mg/l
7.03
7.28
6.02
10.89
11.78
8.61
9.23
5.34
6.90
7.85
8.56
8.59
8.59
5.39
5.32
7.50
8.11
8.22
4.05
8.30
7.25
5.79
7.05
7.08
12.83
6.76
8.33
6.10
8.26
9.82
9.39
7.78
8.11
9.81
9.65
12.83
9.40
9.40
µM/kg
219.9
221.9
183.2
336.2
364.0
264.5
282.5
163.1
210.3
239.8
262.2
263.3
263.1
164.2
162.7
229.0
248.4
253.0
123.9
255.5
221.9
177.2
216.6
217.4
396.5
207.1
256.3
186.2
253.2
302.6
289.9
238.3
248.3
302.1
297.1
396.0
286.7
287.0
%
68.8
67.1
51.4
126.2
153.9
103.6
90.1
68.5
79.5
73.4
105.4
102.2
102.1
63.5
75.8
66.7
99.2
99.3
51.9
70.4
74.6
67.8
81.9
82.2
141.6
84.1
100.5
69.2
100.9
94.8
96.2
95.8
99.6
115.3
113.8
126.9
102.1
102.1
Comment
Demo measurement
Demo measurement
Demo measurement
Demo measurement
Demo measurement
Demo measurement
Demo measurement
Demo measurement
Demo measurement
Demo measurement
Demo measurement
Demo duplicate
Demo duplicate
Demo measurement
Demo measurement
Demo measurement
Demo measurement
Demo measurement
Demo measurement
Demo measurement
Demo measurement
Demo measurement
Demo duplicate
Demo duplicate
Demo measurement
Demo measurement
Demo measurement
Demo measurment
Demo measurement
Demo measurement
Demo measurement
Demo measurement
Demo measurement
Demo measurement
Demo measurement
Demo measurement
Demo duplicate
Demo duplicate
Chapter 6
Messages
6.1 Warning Messages
W0010: Hardware not detected
This warning message will be displayed after starting the program if the
photometer and/or the Dosimat are not ready. Remember that the photometer
has a warmup time of about five minutes. Ignore the warning if you don't want
to make a titration (e.g. if you only want to view data from previous titrations).
W0011: Dosimat not powered or not connected
The Dosimat is not powered (red mains switch at the rear side) or there is no
connection between the interface box and the Dosimat (mains cable or data
link cable). Ignore this warning if you only want to view or print data from
previous titrations.
W0020: Configuration file not found
The configuration file could not be found. The program will use the default data.
Note that you cannot start a titration, because the standard data will be set to
zero.
W0021: No bottle file
The program could not find the bottle file. Before starting any titration you have
to create the bottle file.
W0030: Too many directory entries
The selected directory contains more entries than the internal buffer can hold.
The file list will not display all entries. Ignore this warning if the files you want
are in the list or use a search mask to display a subset.
W0040: Bottle number has not changed. Start titration?
You did not enter a new bottle number before starting the new titration. Choose
'Yes' to start the titration or 'No' to go back to the Titration Parameter window.
W0050: Duplicate sample ratio below 10%
If duplicate control is enabled, this warning message will be displayed each time
you are starting a normal titration (no duplicate) if the ratio of duplicates to all
data sets in the current data file is below 10%.
W0060: Burette was filled during titration
The burette has to be refilled during titration (the dispensed titer volume was
greater than the burette volume). Therefore, the titration result may be
inaccurate.
W0071: Approximation failed
The endpoint calculation algorithm fails. Therefore, the results may be inexact.
To decide if the detected endpoint is correct use the Graph command to display
the titration curve for examination. This warning is produced when the endpoint
calculation by polynomial approximation is not possible. But the endpoint is still
calculated by a simpler method (linear regression).
W0072: Titration is too fast
At the end of the fast titration phase there is too many titer that has not reacted.
To avoid this warning increase the stirrer speed, use bigger stirrer bars and / or
increase the fast delay time.
W0073: Not enough steps inside slow titration phase
There are not enough titration steps during the slow titration phase. Therefore,
an approximization of the titration curve is not possible and the result may be
inexact. To avoid this warning, decrease the fast factor for 2-channel systems
or decrease the primary shot or percentage endpoint for 1-channel systems.
57
W0074: Zero concentration detected
The system detected a zero concentration for the sample. If there is really a
zero concentration choose OK. Choose Cancel if the zero concentration is
sourced by an error (e.g. burette tip not inside sample bottle).
W0080: Too many data sets in log file
The selected log file for titration curve display contains more data sets than the
internal buffer can hold. Therefore, the list box contains only the oldest data
sets from the file. To select all data sets, the log file must be splitted into two or
more files (e.g. with an ASCII editor).
W0090: File not saved; Save ?
The contents of the file has changed since the last saving or loading. Choose
'Yes' to save the file contents.
W0100: Bottle exists already; overwrite ?
There is already a bottle with the specified number in your bottle file. You can
overwrite the old data or cancel the input.
W0110: File exists already
A file with that name exists already. You can choose from overwriting,
appending data, or cancelling the operation.
6.2 Error Messages
E1010: Not enough memory
There is not enough memory to execute the selected option. To get more free
memory leave the program and remove resident programs.
E1020: Graphics error
The program could not identify your graphic system. Therefore, the Graph
command is not available. If you have a Hercules graphic card, this error will
occur if the terminate-and-stay-resident program MSHERC.COM is not
installed.
E1040: Internal error
Internal (menu system) error. Please contact SiS to report this error. (See note
below).
E1050: User break
A running titration was interrupted by pressing the <ESC> key. Choose 'OK' to
stop the titration or 'Cancel' to resume. Note that resuming could produce less
accurate results if the titration was interrupted during the slow titration phase.
E1060: Input out of range
The entered value is out of range. The range for valid input is generally
displayed at the status line.
E1070: Cannot execute command processor or child process
The command processor (COMMAND.COM) was not found or the argument
list exceeds 128 bytes. The program tries to locate the command processor by
the environment variable COMSPEC. If this fails, the shell command is not
available. For further information see your DOS manual.
E2010: No bottle data available
The bottle file could not be found or it is empty. Before starting any titration you
have to enter a valid bottle number. Therefore, you must create a bottle file first.
E2020: No data available
This error occurs when you select the Graph command and no titration was
done since program start or the last titration was not successful.
E2030: Missing standardization data
58
Before starting any smaple titration you have to standardize your titer.
E2040: Unknown bottle number
There is no bottle with the specified number in your bottle file. Check if you
entered the correct number or tell the program the new bottle by using the Add
Bottle command in the Bottles Menu.
E2050: Transmission not decreased with bottle
Before starting a titration the system has to know the red and blue transmission
values without and with a bottle. If the blue transmission with bottle is not below
the transmission without bottle minus 5 percent, this error occurs. So choose
OK to restart the calibration procedure or Cancel the titration.
E2060: It seems that there is no bottle in the photometer
Before starting an additional titration for blank or standard determination the
system checks the blue transmission value. If this value is greater than the
transmission without bottle from the first titration minus 5 percent, there is
probably no bottle in the photometer.
E3010: Photometer/Dosimat not detected
Before any titration the program will check if the photometer and the Dosimat
are connected to the computer and powered. If the check fails, you will get this
error message.
E3020: Time out reading photometer
The connection to the photometer is interrupted. If this error occurs inside a
titration, cancel the process and check the hardware.
E3030: Time out sending to Dosimat
The connection to the Dosimat is interrupted. If this error occurs inside a
titration, cancel the process and check the hardware.
E3050: Invalid port number
Your computer has no interface with the specified number. Use the
configuration menu to select a valid port.
E3060: Mouse active at selected hardware port
There is an active mouse driver at the serial port. Change the hardware port or
leave the program and disable the mouse driver.
E4000: Too many titration steps
The titration was interrupted, because the number of titration steps is greater
than the internal buffer can hold (1000). This error can occur when you enter a
very low estimated endpoint (or percentage transmission start value for 1channel systems) or your titer concentration is very small. In these cases a
greater buffer would not be an advantage, because the titration results would be
too inexact.
E4010: Titration failed
The titration was not successful. The frequent source for this error is an over
titration. To avoid over titrations enter a lower estimated endpoint (or primary
shot for 1-channel systems) or use a smaller titer concentration.
E5000: Can't open file or device
Reading: The device is an output device.
Writing: The file or disk is write protected or the device is an input device.
E5001: Seek error
Seek error during disk access. Leave the program (e.g. by the OS-shell
command) and check your disk and drive.
E5002: Read error
Read error during disk access. Leave the program (e.g. by the OS-shell
command) and check your disk and drive.
E5003: Write error
59
Write error during disk access. Leave the program (e.g. by the OS-shell
command) and check your disk and drive.
E5010: Device not ready
Drive or device not ready (e.g. no disk in drive, printer off line).
E5011: Printer not ready
Your printer is not powered, not on line, busy, or not connected to the selected
port.
E5012: DOS device error
Critical DOS device error. Clear the error source and choose RETRY.
E5020: Disk full
Your disk is full. Change the disk or delete files and restart output operation.
E5030: File/path not found
A file and/or path with that name does not exist.
E5040: No matching file/directory found
There are no directories and no files that match the search mask on your disk.
E5050: Invalid drive/path
A drive and/or path with that name does not exist.
E5051: Invalid file name
The file name does not match the MS-DOS specifications for file names (max. 8
characters for name, 3 characters for extension).
E5060: Invalid configuration file
The file is not a valid DOA configuration file.
E5061: Invalid data file
The file is not a valid DOA data file.
E5062: Invalid bottle file
The file is not a valid DOA bottle file.
E5063: Invalid data file type
The data file does not match the current settings. There are four types of data
files: with or without duplicates and WOCE or ISO mode. Select a matching file
or enter a new file name.
E5064: Invalid log file
The selected log file for titration curve display is not a DOA log file or it was
modified.
E5070: File is read only
The read only attribute of the file is set. To get write access, you must reset the
R/O attribute (e.g. with the DOS command ATTRIB).
E5080: File is not executable
The file is not a COM, EXE or BAT file or it has an invalid executable-file format.
E60xx: DOS device error
Critical DOS device error. The only way to go on is to clear the error source and
to choose 'Retry'. If you choose 'Abort' the program will terminate without saving
any data! (Sorry, that's MS-DOS).
E700x: Math error
Mathematical function error. Please contact SiS to report this error. (See note
below).
E800x: FP87 error
Floating point error. Please contact SiS to report this error. (See note below).
EXXXX: Internal error in error function
During error handling an internal (menu system) error occurs. XXXX is the
number of the original error. (See note below).
60
Note to all errors that appear during titration (E40xx):
If a titration fails, the titration data will be written to the ASCII file DOA.ERR in the current
directory. If the file exists already, the data will be appended. Therefore the file should be
renamed or deleted after some time. The error file may be useful if too many titration failures
occur to detect the error sources.
Note to errors E1040, E700x, E800x and Internal error in error function:
We have tried to make this program error free, but nobody is perfect. To prevent system
'hangups', resulting in lost data, we have included many error checks for critical errors to save
all data before leaving the program. If one of these errors occurs, please report the error and
the circumstances (current program step, menu level) to us.
61
Chapter 7
Customer Service
Warranty:
SiS warrants this instrument to the original purchaser to be free of defects in material
or manufacturing for a period of one year. Liability is limited to repair or replacement of
the defective part which will be done without charge if the instrument is returned to our
factory prepaid. This warranty does not apply to any glass or plastic parts or to
instruments subjected to misuse or tampering. No responsibility or warranty for
consequential damage is included in the sale of this instrument.
Software updates:
SiS guarantees a free of charge software update for one year.
Please report errors or make suggestions in writing or phone us for questions, that can only
be answered by phone.
SiS Sensoren Instrumente Systeme GmbH
Mühlenkoppel 12
D-24222 Schwentinental
Germany
Tel.: +49 431 79972 0
Fax: +49 431 79972 11
Email: [email protected]
WWW: http://www.sis-germany.com
62
References
Bigg, P. H., 1967. Density of water in S.I. units over the range 0-40°C. British Journal of
Applied Physics, 18, 521-537.
Carpenter, J. H., 1965. The Chesapeake Bay Institute technique for the Winkler dissolved
oxygen method. Limnology and Oceanography, 10, 141-143.
Culberson, C. H., 1991. Dissolved oxygen. WOCE Operations Manual, Part 3.1.1 : WHP
Operations and Methods, WHP Office Report WHPO 91-1, WOCE Report No. 68/91.
Deutsches Institut für Normung, 1992. Wasserbeschaffenheit; Bestimmung des gelösten
Sauerstoffs; Iodometrisches Verfahren (ISO 5813 : 1983). Deutsche Fassung EN 25
813 : 1992.
European Committee for Standardization, 1992. Water quality; Determination of dissolved
oxygen; Iodometric method (ISO 5813 : 1983). ES 25 813.
International Standardization Organization, 1983. Water quality - Determination of dissolved
oxygen - Iodometric method. ISO 5813 : 1983.
Millero F. J. and A. Poisson, 1981. International one-atmosphere equation of state of
seawater. Deep Sea Res., 28, 625-629.
Murray, C. N., J. P. Riley, and T. R. S. Wilson, 1968. The solubility of oxygen in Winkler
reagents used for the determination of dissolved oxygen. Deep Sea Res., 15, 237-238.
Weiss, R. F., 1981. Oxygen solubility in seawater. UNESCO Technical Papers in Marine
Science. No. 36:22.
Winkler, L. W., 1888. Die Bestimmung des im Wasser gelösten Sauerstoffes. Ber. dtsch.
chem. Ges., 21, 2843-2855.
WOCE. See Culberson, C. H.
63
Index
Beer, de.......................................................................................................................................2
Bigg .............................................................................................................................................9
blank
determination ........................................................................................................ 6; 33; 34
bottle
file............................................................................................................................. 11; 12
list ............................................................................................................................. 22; 52
number ............................................................................................................... 23; 24; 28
volume............................................................................................................................ 23
burette
fill speed.......................................................................................................................... 43
volume........................................................................................................................ 5; 43
calibration ..................................................................................................................................11
Carpenter ................................................................................................................................5; 6
command line............................................................................................................................11
CONVBOT.EXE ........................................................................................................................11
delay
fast.............................................................................................................................. 1; 45
slow ............................................................................................................................ 2; 45
density
pure water.........................................................................................................................9
seawater ...........................................................................................................................9
DOA.BOT ............................................................................................................................11; 12
DOA.CFG............................................................................................................................11; 12
DOA.ERR..................................................................................................................................61
DOA.EXE ..................................................................................................................................12
DOA.LOG..................................................................................................................................11
DOA_*.HLP ...............................................................................................................................12
DOA_*.NDX ..............................................................................................................................13
DOADEMO.EXE .......................................................................................................................12
Dosimat functions......................................................................................................................49
duplicate
control....................................................................................................................... 25; 44
sample........................................................................................................................ 6; 25
endpoint...................................................................................................................................1; 5
fast factor...............................................................................................................................1; 45
file
formats............................................................................................................................ 12
hardware test.............................................................................................................................42
help......................................................................................................................................14; 50
installation....................................................................................................................................1
ISO ................................................................................................. 5; 6; 7; 12; 25; 35; 36; 43; 63
log file ........................................................................... 11; 12; 28; 29; 33; 34; 37; 38; 39; 40; 54
menu
file................................................................................................................................... 16
graph .............................................................................................................................. 39
log................................................................................................................................... 29
main................................................................................................................................ 15
options ............................................................................................................................ 42
print ..........................................................................................................................21; 30
64
titration..............................................................................................................................6
Millero ..........................................................................................................................................9
OS shell.....................................................................................................................................16
oxygen
from reagents.................................................................................................................. 25
saturation ..........................................................................................................................9
volume concentration ........................................................................................................8
weight concentration .........................................................................................................8
Poisson........................................................................................................................................9
port
hardware......................................................................................................................... 43
printer ............................................................................................................................. 43
print
all data sets......................................................................................................... 18; 55; 56
blank data ................................................................................................................. 32; 53
bottle list....................................................................................................................22; 52
deviation data............................................................................................................ 20; 53
graph .............................................................................................................................. 41
single data set..................................................................................................... 19; 28; 53
standard data ............................................................................................................ 35; 52
printing
emulation ........................................................................................................................ 44
formats............................................................................................................................ 52
protocol........................................................................................................................... 25
split ........................................................................................................................... 19; 44
README.DOC............................................................................................................................1
reagent volume .........................................................................................................................25
salinity........................................................................................................................................25
standard
determination ............................................................................................................ 37; 38
normality ......................................................................................................................... 36
standardization ............................................................................................................................5
station name..............................................................................................................................24
status line ..................................................................................................................................14
step size ..........................................................................................................................2; 44; 45
temperature
pickling............................................................................................................................ 25
sample............................................................................................................................ 24
standard.......................................................................................................................... 36
titer ................................................................................................................................. 25
titration
accuracy ...........................................................................................................................5
curve................................................................................................................. 2; 5; 39; 40
date ................................................................................................................................ 24
end condition.....................................................................................................................4
parameters...................................................................................................................... 44
procedures........................................................................................................................5
process .............................................................................................................................1
sample..............................................................................................................................6
time................................................................................................................................. 24
transmission test .......................................................................................................................42
video type ..................................................................................................................................43
65
volume correction........................................................................................................................9
wait time ................................................................................................................................2; 45
Weiss.......................................................................................................................................8; 9
window
file select................................................................................................................... 16; 17
single data set................................................................................................................. 18
WOCE .............................................................................................................5; 6; 7; 8; 9; 44; 63
66