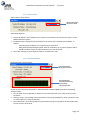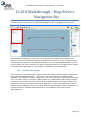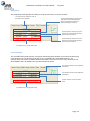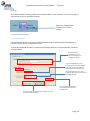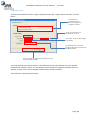
1
Ensuring your software and business critical applications achieve optimum performance JAR:Emulate Installation & Operating Manual 2U Rack Mountable WAN Emulator Declaration of Conformity Established following the Directive 2006/95/EC We, hereby, certify that JAR Technologies JAR:Emulate WAN Emulator complies with the dispositions of the European Community Directive for harmonized standards within the Member States related to low voltage (Directive 2006/95/EC). Page | 1 Contact Information If you need to contact JAR Technologies regarding the installation or use of the JAR:Emulate WAN Emulator, please do so using the following channels: Online support: please visit our website www.jartechnologies.com, and select ‘chat online now’ Telephone Technical Support: +44 (0) 2890 233322 E-mail: [email protected] Our offices are located at: JAR Technologies Ltd. Howard House, 1 Brunswick Street, Belfast, BT2 7GE Reproduction No part of this publication is permitted to be transmitted by any means, whether electronically, mechanically or otherwise, reproduced or stored in a retrieval system without the express written consent of JAR Technologies Ltd. © Copyright 2009-13 by JAR Technologies. All rights reserved. Warranty All information is believed to be true and correct at time of print. Information in this document is subject to change without notice and does not represent a commitment on the part of JAR Technologies Ltd. JAR Technologies makes no warranties, expressed or implied of any kind with regards to this material or its products, including the implied warranties of merchantability and fitness for a particular purpose. JAR Technologies shall not be liable for errors contained herein or for incidental or consequential damage in connection with the furnishing, performance or use of this material or supplied products. Please note: changes/additions/deletions of user information (which is displayed, for example, to users via pop up boxes in the GUI) are not covered by JAR Technologies warranty, and JAR Technologies accepts no responsibility for incorrect or inaccurate translations and any impact that results from this. Please note: there are no internal serviceable parts in any equipment supplied by JAR Technologies. Opening the hardware voids all warranties. Page | 2 Trademarks JAR:Emulate WAN Emulator® is a registered trademark of JAR Technologies Ltd. Other trademarks are the property of their respective owners. Page | 3 Table of Contents Table of Contents Contact Information ................................................................................................................................ 2 Reproduction ........................................................................................................................................... 2 Warranty ................................................................................................................................................. 2 Table of Contents .................................................................................................................................... 4 1. Safety Notices .................................................................................................................................. 7 2. Company Profile .............................................................................................................................. 9 3. Unpacking and Installation ............................................................................................................ 10 4. JAR:Emulate at a glance ................................................................................................................ 11 6. Getting Connected ........................................................................................................................ 14 6.1. Pre-installation Notes ................................................................................................................ 14 6.2. Tools and Cables Required ........................................................................................................ 14 6.3. Installation ................................................................................................................................. 14 6.4. Hardware: .................................................................................................................................. 14 6.5. Installing the GUI Software: ...................................................................................................... 15 6.6. Installing your license key ......................................................................................................... 15 6.7. First time access to JAR:Emulate ............................................................................................... 16 7. Positioning JAR:Emulate Hardware ............................................................................................... 18 8. JAR:Emulate Graphical User Interface: Overview ......................................................................... 21 9. JAR:Emulate Web User Interface .................................................................................................. 29 9.1 Introduction............................................................................................................................... 29 9.2 Features ..................................................................................................................................... 29 9.3 Accessing the Web UI ................................................................................................................ 29 9.4 Emulation Status Page ............................................................................................................... 30 9.5 Emulation Configuration Page................................................................................................... 31 10. Creating Your First Emulation Run ............................................................................................ 32 10.1 Introduction............................................................................................................................... 32 10.2 Step 1 – Changing a map name ................................................................................................. 33 10.3 Step 2 – Adding an impairment ................................................................................................. 33 10.4 Step 3 – Adjusting an impairment’s settings ............................................................................. 34 10.5 Step 4 – Running an emulation ................................................................................................. 35 10.6 Step 5 - Stopping an emulation run........................................................................................... 37 10.7 Step 6 – Emulating a congested network .................................................................................. 37 Page | 4 10.8 Step 7 – Viewing Results............................................................................................................ 39 10.9 Summary ................................................................................................................................... 41 11. GUI Walkthrough- Master Menu Bar ........................................................................................ 42 11.6. Master Menu Bar .................................................................................................................. 42 11.7. View Menu - Unit Information .............................................................................................. 42 11.8. Tools Menu ............................................................................................................................ 44 11.8.1. GUI Settings ....................................................................................................................... 44 11.8.2. Administration ................................................................................................................... 45 11.8.3. Help Menu ......................................................................................................................... 51 11.8.4. About ................................................................................................................................. 51 11.8.5. Activate Product ................................................................................................................ 51 11.8.6. Save Map XML / Show Map XML ...................................................................................... 51 12. Routed and Bridged Operations Overview................................................................................ 52 12.6. Introduction........................................................................................................................... 52 12.7. Selecting the required operation .......................................................................................... 52 12.8. Visualisation of operation ..................................................................................................... 52 13. GUI Walkthrough - Map/Device Navigation Bar ....................................................................... 53 13.6. Contents and Settings ........................................................................................................... 53 13.7. Adding, renaming or removing hardware ............................................................................. 54 13.8. Maps ...................................................................................................................................... 55 13.9. Device Settings ...................................................................................................................... 58 13.10. Captured Traffic Files............................................................................................................. 62 14. Network Toolbox Overview ....................................................................................................... 63 14.6. 15. Tool and Impairments - General Settings.......................................................................... 64 Network Toolbox ....................................................................................................................... 65 15.6. Bridged vs Routed mode ................................................................................................... 65 15.7. Licensed Tools ................................................................................................................... 65 15.8. Network Emulation Tools Available .................................................................................. 65 15.9. Network Ports.................................................................................................................... 66 15.10. Packet delay....................................................................................................................... 70 15.11. Jitter ................................................................................................................................... 75 15.12. Bandwidth Throttling ........................................................................................................ 77 15.13. Ethernet Fragmentation .................................................................................................... 81 15.14. Background Traffic Generation ......................................................................................... 82 15.15. Drop Packets...................................................................................................................... 84 15.16. Packet Sinkhole ................................................................................................................. 87 15.17. Packet Corruption.............................................................................................................. 88 15.18. Packet Duplication ............................................................................................................. 91 Page | 5 15.19. Merge Point ....................................................................................................................... 95 15.20. Null Point (TAP Extender) .................................................................................................. 97 16. Filter Tools Overview ................................................................................................................. 97 16.6. Packet Counting Filter ....................................................................................................... 98 16.7. UDP/TCP Filters ............................................................................................................... 100 16.8. Ethernet MAC Address Filter ........................................................................................... 104 16.9. Ethernet Payload Filter .................................................................................................... 106 16.10. IP Address Filter ............................................................................................................... 108 16.11. IP Protocol Filter .............................................................................................................. 110 16.12. VLAN Protocol Filter ........................................................................................................ 112 16.13. MPLS Protocol Filter ........................................................................................................ 113 16.14. Output Switching Filter.................................................................................................... 114 1.7 Virtual Routers............................................................................................................................... 116 16.15. Introduction......................................................................................................................... 116 16.15.1. Features set ......................................................................................................................... 116 16.16. Basic Virtual Routing (BVR).................................................................................................. 117 Introduction..................................................................................................................................... 117 16.17. Edge Virtual Routing (EVR) .................................................................................................. 118 Introduction..................................................................................................................................... 118 Creating your EVR’s ......................................................................................................................... 118 Configuring your EVR’s .................................................................................................................... 119 Understanding the EVR Settings ..................................................................................................... 120 Configuring our example EVR’s ....................................................................................................... 121 Connecting up the EVR’s (creating the WAN) ................................................................................. 121 Forward Table Changes ................................................................................................................... 121 Adding WAN impairments............................................................................................................... 122 EVR - Real-time information ............................................................................................................ 123 17.6. Statistical Graph TAP ........................................................................................................... 125 17.7. Root Cause Analysis - Wireshark Capture ........................................................................... 128 17.8. Traffic Capture and Replay .................................................................................................. 130 18. Auto Impairment Generation of Live Network Conditions ..................................................... 135 Page | 6 1. Safety Notices Caution TO PREVENT THE RISK OF ELECTRIC SHOCK, DO NOT REMOVE ANY PART OF THE PRODUCT’S CASING. THERE ARE NO USER-SERVICEABLE PARTS INSIDE THIS UNIT. SERVICING MUST ONLY BE CARRIED OUT BY QUALIFIED JAR TECHNOLOGIES SERVICE PERSONNEL. Important Safety Notice To ensure safe operation and to guard against potential shock hazard or risk of fire, the following must be observed: Ensure any fuses fitted are the correct rating and type. If unsure, please contact JAR Technologies for support. The unit must be earthed by connecting to a correctly wired and earthed power outlet. The power cord supplied with the unit must be wired as follows: Green/Yellow = Earth Blue = Neutral Brown = Live The green/yellow coloured wire must be connected to the supply plug terminal marked with the letter E or by the earth symbol (I) and is coloured green or green/yellow. The blue coloured wire must be connected to the supply plug terminal marked with the letter N or coloured black or blue. The brown coloured wire must be connected to the supply plug terminal marked with the letter L or coloured red or brown. At any time the unit should not be exposed to excess moisture, dripping or splashing. No objects filled with liquids, such as coffee cups, should be placed on or near the equipment. Page | 7 General Precautions Elevated Operating Ambient - If installed in a closed or multi-unit rack assembly, the operating ambient temperature of the rack environment may be greater than room ambient. Therefore, consideration should be given to installing the equipment in an environment compatible with the maximum ambient temperature (Tma) of 30c. Reduced Air Flow - Installation of the equipment in a rack should be such that the amount of air flow required for safe operation of the equipment is not compromised. Mechanical Loading - Mounting of the equipment in the rack should be such that a hazardous condition is not achieved due to uneven mechanical loading. Circuit Overloading - Consideration should be given to the connection of the equipment to the supply circuit and the effect that overloading of the circuits might have on overcurrent protection and supply wiring. Appropriate consideration of equipment nameplate ratings should be used when addressing this concern. Reliable Earthing - Reliable earthing of rack-mounted equipment should be maintained. Particular attention should be given to supply connections other than direct connections to the branch circuit (e.g. use of power strips). DO NOT COVER VENTILATION HOLES OR REDUCE AIR FLOW Slots, fan vents and openings on the JAR:Emulate WAN Emulator are provided for ventilation that is needed to ensure reliable operation. To avoid overheating and loss of warranty please ensure that the ventilation slots are not blocked, place the JAR:Emulate unit on a smooth, hard surface that has at least five cm (two inches) of clearance around the unit and adequate air circulation. If the equipment is place in a closed area, such as a rack or a case, ensure that proper ventilation is provided and that the internal rack operating temperature does not exceed the maximum rated temperature (30c) at the position of the JAR:Emulate unit. Page | 8 1. Introduction Thank you for purchasing the JAR:Emulate WAN Emulator- an advanced, user friendly and powerful hardware based Wide Area Network emulation device. This manual guides you through the simple installation process and explains how to gain the maximum benefit from the rich feature set provided for emulation. It is recommended that all new users of this product read this manual prior to switching the unit on for the first time. 2. Company Profile JAR Technologies offers affordable, easy to use WAN emulation tools for the application performance and quality assurance market. These are designed to reduce the need for costly rework, recalls and damaged reputations, whilst also ensuring service level targets are met. We provide early visibility to IT professionals of issues that would impact performance post release, through the simulation of a comprehensive range of real world network impairments including jitter, pack loss, bandwidth throttling, data corruption and many more. It has been proven that up to 75% of application development costs are incurred in the latter stages of development or post deployment - primarily through costly re-works to applications. JAR Technologies’ WAN emulators provide the ability to identify and eliminate WAN related issues early in the development lifecycle – thereby pulling much of that 75% back into your company’s margins. WAN emulation is now an indispensable tool for any application designer, tester, QA manager or IT executive, and ensures that applications in development will perform in a WAN environment prior to their release on the market, and data and system architecture redeployments will perform as expected when operational. Page | 9 3. Unpacking and Installation After carefully unpacking the unit, please: Check the unit for any damage they may have occurred during transit. JAR Technologies protects all its products with industry standard packing but damage can still occur. Check that the contents supplied match the following list: 1. One 2U mountable hardware rack. 2. Cabling : a. One mains cable (connector subject to destination country) b. Ethernet cables for connection to the ports on the front of the hardware unit 3. One hard copy of the Quick Start Guide 4. Hardware configuration (if application) 5. Hardware warranty and product information If the equipment supplied does not match all the above components, please contact JAR Technologies immediately using the contact details found at the start of this user manual. Page | 10 4. JAR:Emulate at a glance JAR:Emulate is a hardware based Wide Area Network Emulator, designed to accurately replicate conditions that applications and systems could experience when making WAN traversals. JAR:Emulate is used in the test lab to test applications, protocols and end user experience under real word conditions before and after deployment. JAR:Emulate can emulate the following WAN links: Satellite Microwave 3G 4G GPRS E1/T1 ISDN Modems And others The customised version of JAR:Emulate WAN emulator that has been shipped to you has come installed with the following impairment tools, filtering tools and reporting: Virtual Router Simulation o Simulate routers for WAN environment simulations o Support multiple ports, DHCP and ARP Packet corruption o Bitflips and byte overwrites Drop packets (packet loss) o Drops a variable number of packets Packet Sinkhole o Drops all packets received Packet Duplication o Single, timed or complex (delay and multiple duplication) Packet delay o Delays packages by static amount (with variable jitter) or by a dynamic range Bandwidth throttling o Throttles bandwidth to a set amount, various options. Ethernet fragmentation o MTU min/max range Page | 11 Jitter o Constant or ranged Background traffic Generation o Emulates link usage – fixed or percentage of available link Filters o TCP, UDP, IP address, IP, MAC (Ethernet filtering), packet count, ethernet payload Null Point Object o Allows the creation of more TAP device points for reporting purposes Traffic Capture o Record live traffic to JAR:Emulate’s hard drive, for analysis via Wireshark .pcap files Traffic Replay o Replay previously recorded traffic (either traffic captured on the emulator or remotely) Statistical Graphs o Bandwidth Graph – Showing bandwidth in various units (bits, megabytes, etc.) o Packets per second – reports the number of packets Wireshark o Provides root cause analysis and packet capture/replay capability Please see section “Network Impairment Tools” for more information on each impairment tool and how to use these in your emulation, and the section titled ‘Reporting – TAP devices’ on how to view the output of your emulation. The JAR:Emulate unit provides either two or four 1Gbps physical interface ports, and is positioned between any two compatible devices, so that it acts as an ‘intermediary’ between these attached devices. Using the GUI, users can inject common WAN impairments onto this connection and analyse the results, either through viewing the resultant input to the destination device, or through the GUI’s reporting system (if available / licensed). JAR:Emulate is based around a 2U (3.5 inch height) standard chassis which is designed to be rack mounted. The ports marked ‘1’ and ‘2’ are the network interface ports, which are used to place the emulator onto the user’s LAN network. The port marked ‘C’ is the Control port which is used by JAR:Emulate to manage the exchange of communications between the GUI and the hardware. Please see the graphic below detailing the front panel components on the unit: Page | 12 JAR:Emulate Front Panel Orientation gure 2: Front LED group Ethernet RJ45 or SFP/SFP+ ports – used to connect JAR:Emulate onto the LAN via the supplied Ethernet cables Ethernet RJ45 Control port – used to provide communication between JAR:Emulate hardware and the GUI Power LED: Lights when the unit is connected to a power source Running LED: Lights when the unit is performing an emulation run Forwarding LED: Lights when the unit is not performing an emulation run (data packets are automatically being forwarded without any impairment, this may be disabled in settings) Fault LED: Lights when the unit is experiencing a fault during an emulation run – consult GUI for more information Overload LED: Lights when the unit is experiencing high load, Network packets may be dropped. Reset IP Address ‘pin hole’: Inserting and holing in a non-metallic object (when unit is running) will results in the IP address being reset to its default. Page | 13 6. Getting Connected 6.1. Pre-installation Notes Please note: Avoid cable interconnection length in excess of 1 meter (3.3 feet) in strong RF environments. All network interface ports (Ethernet) and mains power connection must be externally protected from lightning strikes – damage from lightning strikes is not covered by the warranty. The network interfaces ports do not support Power over Ethernet, attaching PoE enabled devices may result in failure of the product – damage from PoE devices is not covered by the warranty. 6.2. Tools and Cables Required In addition to the content of the packing list, the following items are necessary to complete the installation (if mounting). Tools: One flat or Phillips screw driver suitable for M 6 rack mounting bolts. A basic electronics toolkit is useful for individual cabling. Rack mounting hardware: Four M 6 bolts with plastic protection washers. 6.3. Installation Installing both the JAR:Emulate hardware and software is an intentionally simple exercise. To start, please follow the instructions below: 6.4. Hardware: 1. Select the chosen physical location on the LAN most appropriate for the unit to be positioned. 2. Connect the supplied power supply cable to the AC input socket at the rear of the machine, and connect to a power source. The unit will power up after short circuit and overload protection mechanisms has verified the power supply. 3. Connect a CAT 5E or CAT6 Ethernet cable from the device under test (or the switch/router with visibility of the device under test) to port 1 on the JAR:Emulate unit 4. Connect a second CAT 5E or CAT6 Ethernet cable from the chosen destination device (or the switch/router with visibility of the destination device) to port 2 on the JAR:Emulate unit 5. Connect a third supplied CAT 5E Ethernet cable from the port marked ‘C’ (the control port) to a switch or router on the LAN (or direct to the machine running the GUI), ensuring the JAR:Emulate hardware unit can communicate with the computer that the GUI will be installed on (see section “6.7 First time access to JAR:Emulate”) Page | 14 6.5. Installing the GUI Software: Please follow these steps to install the JAR:Emulate software: 1. Determine which computer the GUI should reside on. Please note, the GUI can be installed onto multiple machines without licensing restrictions, and can be loaded onto physically remote computers (and will be able to control and receive information from the JAR:Emulate hardware as long as the Local Area Network configuration permits visibility). 2. Insert the DVD marked ‘JAR:Emulate Installation’ into the computer’s DVD drive 3. The disk should auto load. If it does not, please open your computer’s file navigation system, and manually find the appropriate drive. Please manually launch the disk (often by right clicking the drive and pressing ‘play’ or ‘autorun’). Alternatively, please execute the ‘setup.exe’ file found on the root folder of the DVD. 4. The JAR:Emulate GUI set up screen will appear 5. Follow the onscreen instructions to install the GUI. Please note: when the JAR:Emulate hardware unit is turned on, it is common for the hardware to take up to 30 seconds to initialise and provide communication with the software. Make sure that windows firewall allows connections to / from JAR:Emulate GUI. The JAR:Emulate GUI icon is shown below: 6.6. Installing your license key Once the installation has completed the GUI will prompt you for a license key, this must be entered before the GUI will operate. You will find your license key on the separate license key sheet supplied with your product. Your license key is in the form of a string similar to the following: Page | 15 353E-705D-5EE3-DA68-0884-D8FF-7379-422F (please note this is not a valid key) Please keep your license key safe at all times, please contact JAR Technologies if you have lost your license key or wish to activate any additional features. 6.7. First time access to JAR:Emulate Your JAR:Emulate unit has shipped with a default IP address of “192.168.1.100”, unless you have indicated before delivery that you require a different default IP address. Most users will need to modify this IP address so that JAR:Emulate is given a static IP address visible on their LAN. This process involves temporarily changing your computer’s (the one designated as running the GUI) IP address to match the “192.168.1.x” range to gain access to JAR:Emulate via the GUI. Once the GUI can see JAR:Emulate you can freely assign the correct IP address to JAR:Emulate before reverting your computer’s IP address back to its original IP address. For the GUI to communicate with the JAR:Emulate unit you must change your computer’s IP address to be within the same subnet range as JAR:Emulate. In this example we will set your computer’s IP address to “192.168.1.50”. This process should only be attempted by network administrators or knowledgeable users. This example is for Windows 7; please consult your operating system’s guide or network administrator for all other OS’s. 1. Ensure the device running the GUI is connected via Ethernet cable to ‘Port C’ on the front of the JAR:Emulate hardware 2. Open the Windows control panel on the device running the GUI and ensure the view is set to ‘category view’ 3. Select ‘View network Status and tasks’ under the ‘Network and Internet’ section 4. On the left menu, select ‘Change adapter settings’ 5. Right click on the adapter that JAR:Emulate is connected to - usually this is ‘Local Area Connection’. Select the ‘properties’ option 6. The ‘Local Area Connection properties’ window should open 7. Select ‘Internet Protocol Version 4 (TCP/IPv4)’ and click ‘properties’ 8. The ‘Internet Protocol Version 4 (TCP/IPv4)’ window will open 9. Select the ‘Use the following IP address’ field 10. In the following fields enter IP Address = 192.168.1.50 Subnet Mask = 255.255.255.0 Leave default gateway empty 11. Select OK and exit 12. Your computer will now be assigned a static IP address of 192.168.1.50 13. If Windows reports any problems please contact your system administrator Verify your computer can see JAR:Emulate by opening a DOS console and enter ‘ping 192.168.1.50’ – If you cannot ping the unit please contact your system administrator. At this point your computer Page | 16 will be on the same IP range as JAR:Emulate. The GUI will start communicating with JAR:Emulate and you will gain full access to the unit. Please see the “control port network settings” section on how to change JAR:Emulate’s IP address to your desired value. After you have changed JAR:Emulate’s IP address you should revert back your computers IP settings (the device which will run the GUI and control the hardware unit). Under certain circumstances it may be necessary for you to reset JAR:Emulate’s IP address back to the default “192.168.1.100”, please see the section under “Hardware Reset” under “control port network settings” Page | 17 7. Positioning JAR:Emulate Hardware JAR:Emulate can emulate a wide range of WAN links and conditions, but in order to act as a WAN, the positioning of the JAR:Emulate hardware on your LAN is an important consideration. JAR:Emulate is a ‘transparent’ entity on the LAN – aside from the Control Port (for the sending and receiving of control information to/from the unit and the GUI), the hardware unit’s network ports do not have a MAC or IP address. JAR:Emulate sits between the devices attached on port 1 and port 2 (or port 3 and 4 for 4 port model) transparently emulating your chosen WAN. JAR:Emulate supports Ethernet automatic cross over detection, thereby allowing a device under test (or the device running the application under test) to be directly connected to ports 1 or 2. This negates the need for a network switch or router in two DUT (Device under test) operations. Using Network Interface Devices (e.g. switches or routers) The Ethernet cables connected to port 1 and 2 cannot physically terminate at the same switch, router or bridge. If the cables connected to port 1 and port 2 end at the same switch, the switch (or router, etc.) will detect that the packets intended for WAN emulation need not be sent to JAR:Emulate, as the intended destination is simply another port on the same switch. If using routers/switches, please therefore ensure that the Ethernet cables attached to ports 1 and 2 terminate at different routers or switches. JAR:Emulate allows data to be sent bi-directionally with data in each direction made subject to different impairments i.e. data sent in one direction can be subject to different impairments and settings from the data returning. Page | 18 7.1 LAN Configuration Walk Through For ease of understanding, the following example is used – please note this focused on the 2 port models, the same process can be applied to 4 or 8 port models. Device A is a desktop PC which is either under test or is running an application under test. Device B is the destination device that is physically located on the LAN, but is being simulated as a remote device on the other side of a WAN. Device A can be connected via Ethernet cable directly to port 1 on JAR:Emulate’s front panel Alternatively, device A can be connected to a network interface (such as switch or router), and an Ethernet cable connected from the network interface to port 1 Similarly, device B can be either directly connected to port 2 via a single Ethernet cable, or with a network interface acting as an intermediary Please note: The same device cannot be connected to both port 1 and port 2. The same switch/router/hub or any other network interface device cannot be connected to both ports 1 and port 2. o A switch or router will ‘switch’ away traffic before JAR:Emulate can introduce impairments. o A hub may cause a circular loop resulting in an overload condition. The following graphic displays how JAR:Emulate can be added to a LAN. Page | 19 Network Interface e.g. switch or router OR Single computer or IP device on LAN Device running JAR:Emulate GUI (either directly connected or via a network interface device) Network Interface e.g. switch or router (must be a different network interface device from the one that is connected to port 1) OR Single computer or IP device on LAN KEY = Ethernet /Fibre cable Page | 20 JAR:Emulate Installation and User Manual July 2013 8. JAR:Emulate Graphical User Interface: Overview JAR:Emulate Emulator is designed to be inherently simple to set up, understand and use. Once installation is complete, please navigate to the GUI (in the location defined during software set up). The GUI allows users to visually create the network which is to be emulated, by dragging and dropping components/impairments onto the screen. These are then linked together with onscreen connections (so the user can control the ‘flow’ of data between emulated devices), and simple ‘play’, ‘pause’, ‘stop’ options provide overall control. The following screenshot shows how the user interface will appear on first start up: Page | 21 JAR:Emulate Installation and User Manual July 2013 Figure 4 – JAR:Emulate GUI Overview 1) Master Menu Bar – provides application wide control 7) Status Bar – displays CPU load and status of connection with hardware unit (e.g. connected, paused or disconnected) 2) Map Menu Bar – enables high level control over an individual network map (such as start emulation, pause, stop and recentre emulation map) 3) Device / Map Navigation Bar – provides a logical listing of all JAR:Emulate hardware units installed, and the network emulation maps that have been created for each unit 4) Wizards Bar (dependent on configuration – not available on all versions) provides pre-defined common network maps and impairments, which can then be amended as required. 5) Design pane – provides graphical representation of the WAN under test (populated using Wizards to left or network toolbox to right) 6) Network Toolbox – provides drag and drop facility to create network maps and their conditions for emulation Page | 22 JAR:Emulate Installation and User Manual July 2013 The Design pane (number 5 in the diagram above) is where the emulation map is designed – these maps are graphical representations of the WAN which are to be simulated, and therefore form the core of the JAR:Emulate Emulator’s operation Each map will contain: Input / Output points - Physical port start and end points, network routing start / end points, or the captured traffic replay tool. WAN impairment tools between these input / output points Any reporting required from TAP points. Any traffic capture required The WAN impairments are available to be ‘dragged and dropped’ from the ‘Network Toolbox’ (number 6 on the diagram above) onto the Design pane. Reporting is accessed by right clicking a ‘TAP point’ – these appear when a link is made between network start/end points and any WAN impairments (please see section 12.10 ‘Reporting – TAP devices’ for more information). Once an emulation map has been designed, the user simply presses on the ‘play’ button in the map menu bar to initiate emulation. It is highly recommended that first time users follow the instructions in the section “Creating your first emulation run”, as this will provide quick experience and demonstrates JAR:Emulate’s key features. Edit Mode v.s Run Mode The GUI has two separate modes of operation, an edit mode and a run-mode. Whilst selfexplanatory we should note some key differences between these modes. Switching modes To enter the edit mode please select the ‘Switch to Edit Mode’ button on the toolbar: It should be noted that this button will disappear and be replaced with a ‘Switch to Normal mode’ button: Important differences 1. In normal mode you cannot change the position of any impairment tool, or add and remove any impairment tool. You can still change an impairments settings and enable/disable its operation if required. 2. The system will automatically switch to normal mode if an emulation is run. Page | 23 JAR:Emulate Installation and User Manual July 2013 Map Menu Bar The map menu bar is shown below: Enable / Disable Timeline feature (for current map) Toggle tool on / off feature (for current map) Add blank map Add New HW Wizard Take a Snapshot report Center map on all tools Add new impairment tool Toggle Tool (on/off) When selected, the toggle tool allows the user to disable (or re-enable) impairment tools added to an emulation map. Any traffic that encounters a tool that has been disabled will pass it unimpeded. The following screenshots show how impairment tools are represented when this feature is enabled: Jitter Tool active (‘on’) Bandwidth Throttle Tool disabled (‘off’) Impairment tools can be toggled on or off while an emulation is being executed i.e. in real time. It should be noted that when an impairment tool that buffers packets (such as delay or jitter) is disabled, it will ‘dump’ all buffered packets immediately. This can result in a small but inevitable spike in traffic as the packets are released back onto the link. TimeLine (Auto-Change) Feature This feature allows the user to create an emulation scenario which (once started) changes parameters without any manual input from the user. The following icon in the Master Menu Bar provides this functionality: Page | 24 JAR:Emulate Installation and User Manual July 2013 TimeLine (Auto-Change) Feature – Creating a timeline Once selected, the timeline feature will first ask the user to set a total duration that the emulation should run for (which can be changed later if required). This can be up to a maximum of 240 hours (10 days). The following screenshot shows this dialog box: Entire the total duration of the emulation run, then click ‘Add Timeline’ to present the timeline on screen If set the time-line will continuously loop until the emulation map is stopped Once ‘Add Timeline’ has been pressed on the screen above, a timeline will be displayed at the bottom of the user interface - please see the diagram below: Page | 25 JAR:Emulate Installation and User Manual July 2013 Click on the ‘ Timeline' feature to display the timeline at the bottom of the user interface The timeline allows the user to set waypoints, each of which allows the user to change any impairment settings and/or turn impairments on and off. The large blue arrows (see left as well) allow the user to move quickly between any waypoints that have been created on a timeline The above screenshot shows an existing emulation map with four impairments (two active, two turned off using the Toggle on/off feature) and an empty timeline. It is normal practice to design an emulation map before enabling the timeline and creating waypoints on it. Please note: Any timeline created is specific to an individual emulation map Turning off the timeline feature (by clicking the Timeline icon again) will not destroy any waypoints created or their settings. They will be available when the timeline is next turned on. TimeLine (Auto-Change) Feature – Creating a waypoint The following dialog box will appear once the user clicks anywhere on the timeline: Page | 26 JAR:Emulate Installation and User Manual July 2013 Enter a title to make the waypoint recognisable – this will appear on the timeline immediately above the waypoint for easy identification The waypoint time (i.e. when the changes will take place) is an offset from the start of the emulation. The user can enter the exact time (to the second) when the changes required will be implemented Select the ‘Create Waypoint’ button to create the waypoint. The user can now edit the settings of any impairment tool on the emulation map as required, or turn any on/off (using the toggle on/off feature available from the Map Menu Bar). These changes are automatically stored by the user interface against the waypoint. The process of creating waypoints can be repeated as many times as is required by the user across the timeline – the screen below shows an emulation map set up with multiple waypoints: In the above example the map will execute and then, at 11 minutes 15 seconds from the start of the emulation, the jitter will change to 2ms (as per the user defined title of this waypoint). The jitter will remain at 2ms until 22 minutes and 20 seconds into the emulation, when it will automatically change to 4ms, and so on. Page | 27 JAR:Emulate Installation and User Manual July 2013 TimeLine (Auto-Change) Feature – Running an emulation The user can then press the ‘Play’ button on the top left of the user interface to start the emulation. At this point the timeline cannot be edited and a red vertical bar will begin scrolling across the timeline showing the time elapsed. As time passes the red vertical bar will encounter each waypoint created by the user, and the new emulation parameters will instantly and automatically become active. TimeLine (Auto-Change) Feature – Editing the waypoint A waypoint’s settings can be changed by hovering over any waypoint and clicking it (the waypoint will be highlighted with a purple box). The user can then amend any impairment tool’s settings for that waypoint as required. Please note that deleting a waypoint will cause all impairment settings for that waypoint to be lost. Snapshot Report This feature allows the user to take a visual snapshot of the current network map and save this to a user defined location. To generate a snapshot please click the following icon: The report consists of a bitmap contains the current network map; a bitmap for each statistical graph and a XML file containing the structure of the current network map. The system will automatically create a date / time folder for each snapshot. To change the location in which the snapshot is places please see the options under “GUI Settings” for more information. Page | 28 JAR:Emulate Installation and User Manual July 2013 9. JAR:Emulate Web User Interface 9.1 Introduction Please note: The Web UI is an option on the JAR:Emulate units. Whilst the JAR:Emulate WAN emulator ships with a comprehensive user interface from time to time you may require the ability to quickly upload emulation maps and start/stop the emulator from your web browser. Whilst the Web UI and standard user interface can be operated at the same time the accuracy of the port statistics will be reduced if both are connected to the same hardware unit. Please Note: The Web UI is only supported on Google Chrome and Mozilla Firefox web browsers, operation under Microsoft Internet Explorer is not tested or guaranteed. 9.2 Features The Web UI is designed to provide three basic features; the ability to start and stop maps, view statistics on throughput and packet rates and ability to supply a network map (as XML). It should be noted that the Web UI performs limited error checking on the supplied XML, if there are invalid values in the XML the unit may fail to start the emulation map or require a power cycle to regain access. 9.3 Accessing the Web UI Please open Google Chrome or Mozilla Firefox and enter the IP address of the WAN emulator into the title bar, the default IP address is “192.168.1.100”. Page | 29 JAR:Emulate Installation and User Manual 9.4 July 2013 Emulation Status Page The emulation status page provides information the hardware status, emulation control and port based statistics. Hardware status, including CPU load and memory usage The emulation start and stop buttons directly control the emulation run. Current real-time information on thepacket and bandwidth rates Page | 30 JAR:Emulate Installation and User Manual 9.5 July 2013 Emulation Configuration Page The configuration page allows you to paste in the emulation XML, usually acquired from the standard user interface. If you wish to generate XML please open the required emulation map in the standard GUI and select “Show Map XML” under the “Help” menu. You may select and copy the XML from this window, and paste it into the text box located on the Web UI configuration page. Emulation Map XML The web page provides no other functionality. Page | 31 JAR:Emulate Installation and User Manual July 2013 10. Creating Your First Emulation Run 10.1 Introduction This section will explain the process involved in the creation of an example emulation run, following the installation of both software and hardware. Please note that this chapter provides an overview and is not designed to be a comprehensive walkthrough of the GUI or its features and settings. The objective of this chapter is to serve as a quick start guide to emulation using the JAR:Emulate product. Please note: This section describes the “bridged mode” operation of the unit. Bridged mode places JAR:Emulate as a “dump in the wire” allowing all packets entering the unit to be impaired. Please see the “Routed and Bridged mode operations” section for more information. Prior to step 1, please ensure the hardware is connected and positioned as per the guidance in section 7 ‘Positioning the JAR:Emulate Hardware’. For this example, we are going to create a relatively simple wired internet simulation on a port 2 model. When the GUI is launched you will find a default network map named “Vanilla Connections” under the left menu titled ‘map/device navigation’. Please double click on this network map to show it. The arrows between the ports represent the logical direction that data will follow once the emulation is started. Data from Port 1 will flow to Port 2, and visa-versa. A basic network map For ease of understanding, the Port 1 objects (on the left of the graphic above) can be thought of as the device connected to port 1 on the front of the JAR:Emulate hardware. Similarly, the port 2 objects (on the right of the above graphic) can be logically considered as the device connected to port 2 of the JAR:Emulate hardware. JAR:Emulate can impair and manipulate traffic in both directions, hence the use of two connections (as shown in the diagram above) for each physical connection that traffic is sent down and received from. Page | 32 JAR:Emulate Installation and User Manual July 2013 If the ‘return’ connection between port 1 and port 2 on the Design pane is removed, then no traffic will be returned. It is important to remember that, in order to emulate and collect accurate information regarding an emulation run, all maps should have at least one connection made between ports 1 and 2 and one made between ports 2 and 1. 10.2 Step 1 – Changing a map name 1. Locate the ‘Map/Device Navigation’ window on the left side of the screen. 2. The current map (called ‘Vanilla Connections’) and its location within the JAR:Emulate device navigation hierarchy will be highlighted in blue, as shown below Note: depending on the JAR:Emulate hardware installed, your view of the Device/Map navigation hierarchy may be different – this screenshot is for general guidance only 3. Locate and right click on the map titled ‘Vanilla Connections” and select ‘rename map’. 4. Enter a new name for this emulation map e.g. “Test 1” 5. The title of this map will change, both on the map/device navigation bar and on the tab header which displays this map on the Design pane. As the number of maps created increases, or more JAR:Emulate hardware units are added, it will become increasingly important to name your maps intuitively. 10.3 Step 2 – Adding an impairment We will start by adding a bandwidth throttle impairment to both the upstream and downstream connections, to emulate a bandwidth limit common on a wired internet connection. For this example, we will limit downstream bandwidth to 1 Mb/s and upstream to 256 kb/s. 1. Locate the network toolbox window on the right side of the screen. 2. Locate the bandwidth throttle icon, which looks like this : 3. Holding down the left mouse key over this icon, drag the tool unto the main Design pane and release your finger 4. The icon will drop onto the design pane and will now look like this: 5. Hover the cursor over this icon, press and hold down the left mouse button 6. Drag the icon up to the connection between Ports 1 and 2 - the link will turn blue to indicate the tool can be snapped onto it: Page | 33 JAR:Emulate Installation and User Manual July 2013 Once the connection link changes to this blue colour, release your finger 7. The bandwidth throttle tool will snap onto the connection, and will remain on this connection - regardless of where other objects on it are moved to - until it is deleted 10.4 Step 3 – Adjusting an impairment’s settings Viewing the summary information on the bandwidth throttle tool (displayed on the tool), you can see the default setting is 64 Mb/s. This represents the bandwidth limit of traffic moving from the device connected to port 1 on the JAR:Emulate hardware, to the device connected to port 2. We will now change this to emulate a typical ADSL connection of 1 Mb/s downstream. 1. Right click the bandwidth throttle icon in the Design pane and select ‘settings’ 2. The following screen will appear: 3. Change the Bandwidth Limit field (highlighted in red above) from 64.0000 to 1 4. Once any change is made, the ‘Confirm Changes’ button will become active – click on this 5. You will be returned to the Design pane, and you can see that you have now set the bandwidth limit to 1 Mb/s on all traffic moving from the device on port 1 to the device on port 2 Page | 34 JAR:Emulate Installation and User Manual July 2013 6. Repeat this exercise for the other connection (upstream from port 2 to 1) – drag and drop the bandwidth throttle icon from the network toolbox, and snap this tool onto the ‘port 2 to port 1’ connection 7. Right click and change this second bandwidth throttle to a bandwidth limit of 256 KB/s (using the drop down list in the ‘Throttle Settings’ section to change the measurement to Kilobits per second). 8. Click on ‘confirm changes’ 9. The Design pane should now appear as follows: 10.5 Step 4 – Running an emulation You have successfully created the basic conditions of an ADSL connection (although with further WAN impairments such as packet drop and delay a more accurate emulation is possible). Any traffic sent to and from the devices connected to port 1 and port 2 will be subject to this bandwidth restriction. We are now going to run this map to demonstrate some of the real time information that is displayed during emulation. The emulation map that has been created has been designed in Editor Mode, which provides the ability to create, design and alter emulation maps. Editor mode is easily recognisable by the blue grid lines on the Design pane. When a map is run (and emulation therefore begins) the GUI switches to Run Mode, which prevents any changes to the existing map until emulation is stopped. 1. To run the map, simple click on the ‘play button’ in the top left of the GUI: 2. Arrows denoting the flow of network traffic will be shown moving between each port Page | 35 JAR:Emulate Installation and User Manual July 2013 Data Flow Arrows When an emulation run is started, arrows denoted traffic direction will be shown flowing between ports. In some instances, these arrows may not appear immediately or may be limited to only a portion of the emulation map. This is a simple result of the rendering engine adjusting to your screen’s display settings, and has no effect whatsoever on the data flowing or results obtained. 3. Please note: you cannot edit the settings of any tool or impairment while a map is being executed. 4. We are going to view some of the real time data displayed when an emulation is being undertaken. To the top right of the Port 1 network start point, you will see a small ‘I’ icon. Click on this and the following window will appear: 5. The window displayed contains real time information relating to the physical layer for each Port on an emulation map, and provides the user with details of any collisions, packet errors or control (XON/XOFF) packets received. 6. Real time packet flow information is also available for any impairment added to an emulation map. These can be accessed by hovering the cursor over the small grey icon at the bottom right of any tool on a map, as shown below: Page | 36 JAR:Emulate Installation and User Manual July 2013 Moving around an emulation map Please note that you can navigate around a map, in both Editor and Run Mode, by holding down the space bar and left mouse button, then moving the cursor. 10.6 Step 5 - Stopping an emulation run The above example is of a simple, perfect quality bandwidth limited connection. We are now going to add some packet delay onto the connection, to simulate the conditions that may be experienced when sending data over a long distance at a busy time of day. We will also add in some advanced reporting to demonstrate JAR:Emulate’s built in reporting functionality. 1. As the map is executing in Run Mode, we must stop the emulation before we can edit the map in the Design pane. On the top left of the GUI, click on the ‘stop’ button, as shown below: 2. The emulation will stop and you will be returned to the Editor Mode. 10.7 Step 6 – Emulating a congested network We are going to add another tool to the emulated network map, to simulate a connection that is suffering from fluctuating high latency. 1. As before, pull out the Network Toolbox from the right side of the GUI 2. Click and drag onto the Design Pane the following icon for packet delay : 3. The following icon will appear on the Design Pane: 4. As before, drag it onto the connection between Port 1 (network start point) and Port 2 (network end point), as shown below: Page | 37 JAR:Emulate Installation and User Manual July 2013 5. Right click the Delay Packet icon, and select ‘settings’. 6. Using the drop down menu against the ‘Mode’ field, select ‘Range (x to x milliseconds)’, as shown below: 7. Set the minimum latency to 300 milliseconds, and the maximum latency to 500 milliseconds (this is very high latency but we will use it for illustrative purposes in this example): 8. Press ‘confirm changes’ The emulation will now act as an ADSL line which is suffering from very significant congestion, ranging from delays to packets of anything from 300 to 500 milliseconds. This would evidently interfere with the delivery and resulting quality of application traffic sent across this link. Page | 38 JAR:Emulate Installation and User Manual July 2013 10.8 Step 7 – Viewing Results JAR:Emulate provides a range of reporting tools, which vary from ‘real time’ on screen reporting to reports produced once an emulation run has been completed. For this overview, we will add a statistical graph to demonstrate some of the real time information available. 1. Locate the TAP (Test Access Point) icon between the Delay Packet tool and the Port 2 network end point: 2. Right click on this icon and select ‘add statistics graph tap’. 3. The statistics graph should be added as shown below: 4. The default graph attached is the ‘packet per second’ graph, which will show the number of packets passing this TAP point following the bandwidth throttle and the packet delay that were added previously 5. Click on the ‘Play’ button as described in step 3 above, in order to begin emulation 6. The emulation map will execute as before, and a new screen at the bottom of the GUI will appear, showing the statistics graph we have now added: Page | 39 JAR:Emulate Installation and User Manual July 2013 7. The grey section shows a simple line graph of the number of packets being sent past the TAP icon every second. 8. Options on how to change this view, as well as how to export the data, are located on the top left of the stats graph pane, as shown below: The stats graph allows various operations on the received information. Play/Pause, Save to Clipboard, Save to CSV File, Show Average, Show Peak, Smart Labelling on/off and the ability to adjust the visible time domain. Page | 40 JAR:Emulate Installation and User Manual July 2013 10.9 Summary This completes the walkthrough of the example emulation run. Please note that most of the control and functionality of JAR:Emulate was not shown here – the sections below provide more information on JAR:Emulate’s rich feature set and reporting options. JAR:Emulate Sandbox JAR:Emulate’s inbuilt sandbox (located in the GUI’s left navigation bar ‘device/map navigation’) is an ‘offline’ area for designing emulation maps. Maps can be built and stored here, then copied over to a ‘live device’ by right clicking the map you wish to move. The sandbox can be beneficial to save time when another user is performing an emulation, or it can act as a safe area for new users to practise the creation of emulation maps. Page | 41 JAR:Emulate Installation and User Manual July 2013 11. GUI Walkthrough- Master Menu Bar This section will describe JAR:Emulate’s GUI in detail, including its features and functionality. 11.6. Master Menu Bar The Master Menu bar provides general settings for the JAR:Emulate GUI as follows: 11.7. View Menu - Unit Information Under the ‘View’ menu there is one option available, titled ‘ Toolbar Windows’, which itself holds one further option, titled ‘ Unit Information’. The unit information is a selectable option (off/on) which, when selected (as denoted by a tick icon) will display the hardware unit information. The Unit Information window is only visible when an emulation is being performed, and provides visibility on hardware performance throughout the duration of an emulation. Its main purpose is to show real time JAR:Emulate hardware diagnostic information so that the user can understand if an emulation run is highly taxing on the hardware and therefore whether mitigating actions need to be taken. It also supplies quick view data on the routing of packets during an emulation (if network routing is licensed), so a user can quickly see the volume of packets received by the hardware, the number routed or unhandled, the total number of ARP packets forwarded etc. The Unit Information Window has three display settings, depending on the level and type of hardware information required (please note these are only accessible during an emulation run) Page | 42 JAR:Emulate Installation and User Manual July 2013 11.7.1. Basic Mode Basic mode is shown below: Using the drop down menu, select ‘basic’ Basic Mode displays: Control IP address: the IP address of the machine connected to the Control Port (port C on the JAR:Emulate front panel) Hardware Status: displays brief information on the status of the JAR:Emulate hardware, as follows: o Executing map: hardware unit is performing an emulation o Map paused packets being dropped: when an emulation run is paused, packets which would have been subject to selected impairments are discarded CPU Load: showing in percentage the load on the hardware’s CPU 11.7.2. Standard Mode Standard mode is shown below: Using the drop down menu, select ‘standard’ The graph displays recent CPU load activity, with a red line intersecting at 90%. As well as the information displayed for the Basic Mode, Standard Mode provides the following additional data: Current Map: the user defined (or default if none entered) name of the map currently under emulation Memory usage: A percentage of the total memory remaining available for other operations such as traffic capture or replay (if licensed) CPU Load History: provides a graphical representation using a line graph of the CPU load history for the previous 20 seconds Page | 43 JAR:Emulate Installation and User Manual July 2013 11.8. Tools Menu Returning to the Master Menu Bar, the next option is ‘tools’. Under this heading are two further options: ‘GUI Settings’ and ‘Administration’, as shown below. 11.8.1. GUI Settings The GUI Settings menu provides the user with options to change the layout and functionality of the user interface, as follows: 11.8.1.1. General Tab Please see below for a visual description of the GUI Settings ‘General’ tab: Automatically maximize the GUI on start-up Checkbox to enable or disable the auto closing of the side windows (navigation and tool box windows) Change the size of the arrows shown on the Design pane when an emulation is being performed Change the size of the connections in the Design pane If Wire Shark live capture is enabled on your release (and is slow to start) increase this delay so JAR:Emulate does not abort trying to establish a connection to it Select if pop up information should be shown in the GUI, and if so, how long it should be displayed. Pop up information is shown for informational purposes only Please note that for many of the settings above to take effect, a GUI restart is required. Page | 44 JAR:Emulate Installation and User Manual 11.8.1.2. July 2013 Map Settings Tab Please see below for a visual description of the GUI Settings ‘Map Settings’ tab: Define what should be created when a new map is created (by right clicking on the ‘Map/Device Navigation bar’ and selecting ‘Create new Map’ from the popup menu. A blank map can be created by selecting “Create blank map” from the pop-up menu. Define if, and by how much, objects added to the Design pane should be snapped to an underlying grid. To select complete free form positioning, uncheck the ‘lock to grid’ checkbox 11.8.2. Administration The second option on the Tools menu is ‘Administration’, which contains three further menus as shown below: 11.8.2.1. Backup Configuration This is an important feature within the JAR:Emulate GUI, which provides the user with the ability to perform a complete back up of all emulation maps that have been designed, their settings and some current GUI settings. It is highly recommended that back-ups are performed on a regular basis to ensure there is no loss of data if the GUI or system it runs upon becomes unstable. Page | 45 JAR:Emulate Installation and User Manual July 2013 The back-up manager will display a default filename for the file using the current system date settings. You can change the filename and/or path by clicking in the “Destination File Path” field and amending, but the file extension (.ABS) must not be changed otherwise any restoration of this back up may fail. You can change the location where the back-up file is to be saved by clicking on the file navigator icon (highlighted in red above). Please Note: Always check you back-up file has been created. This facility may silently fail if you do not have privileges to write to the destination folder - it’s recommended you save back-ups to your “My Documents” folder if using Windows. Restore Configuration There may be instances when a restoration to a previous version of JAR:Emulate is required. To access back-ups select the ‘Restore Configuration’ option under the ‘Tools’ and ‘Administration’ menus, and navigate to the folder which contains the previously backed up file. To assist, the user can open the file navigation system by clicking on the icon highlighted in red below. Page | 46 JAR:Emulate Installation and User Manual 11.8.2.2. July 2013 Firmware Update JAR:Emulate supports the remote updating of its firmware. This process is largely automated but care should be taken when performing this operation: CAUTION – Possible loss of operation may occur. If the product is power cycled or interrupted during the firmware update it may fail to operation correctly and require shipping to JAR Technologies for reprogramming. This is not covered by JAR Technologies warranty. All network port cables MUST be disconnected during the firmware update process. Retrieving your firmware update JAR Technologies does not actively push firmware updates to customers, if you wish to receive the latest firmware for JAR:Emulate please e-mail [email protected]. The Firmware Package JAR:Emulate’s firmware is released in a ‘package’ file, with the extension ‘.pck’. As well as containing the new firmware, this package file contains version and validation information. This information allows you to see what version you are upgrading to and make sure the package has not been corrupted in transmission to you. Understanding your firmware package Each firmware package presents new features, bug fixes and improvements. You should carefully read the included release notes (available online) for any impacts these new features may have on your existing network maps - if any. By installing the firmware you agree to accept and be bound by any new or updated terms and conditions (available online). GUI implications Please refer to the release notes about any GUI implications. Normally major firmware updates are associated with major GUI updates. If you have received both a firmware package and GUI update, please install the firmware update from the current installation of the GUI. Once firmware has been successfully upgraded, immediately close the GUI, uninstall the existing GUI and launch the new GUI installation. Failure to upgrade your GUI will result in a possible reduction in functionality and incorrect operation. Firmware Update – Step One – Prerequisites Please ensure you have the required firmware package file located on your local hard-disk. This is usually named “Firmware.pck” or something similar. Ensure that your JAR:Emulate unit is powered on, and connected / visible in the GUI. You must not have any emulations running nor have any cables connected to the network ports (marked ‘1’ and ‘2’ on the front panel of the JAR:Emulate hardware unit). This is to ensure that the firmware process will not be interrupted by any unknown events such as heavy traffic forwarding. The update process Page | 47 JAR:Emulate Installation and User Manual July 2013 will not commence until these conditions are met. Ensure the Ethernet cable connected to the control port on the JAR:Emulate hardware (marked ‘C’ on the front panel) remains connected and in place. Firmware Update – Step Two – Opening the firmware update window As shown in the following screen-shot, open the firmware update window by navigating the following menu items - “Tools” > “Administration” > “Firmware Update”. Firmware Update – Understanding the firmware window The firmware window contains many important pieces of information that help assist you with the update process. The window looks as follows: Available hardware devices: This section shows a list of all available JAR:Emulate units, this allow for easy updating of multiple units. If you have only one JAR:Emulate hardware unit it will be selected by default. Hardware Status: This displays the availability of the unit, including any problems (highlighted in red) that must be rectified before continuing. Page | 48 JAR:Emulate Installation and User Manual July 2013 Current Firmware Version: This shows the current firmware version. This is also available from the ‘settings’ window on each JAR:Emulate unit (in the Map/Device Navigation Bar on the right of the main GUI). Firmware Path / Open Dialog: This path allows you to type the location of the firmware package file. If you wish to locate the firmware package please click the “Open Dialog” button on the right side of the firmware path. Firmware Version: When a firmware package is chosen this information shows the new version of the firmware that is about to be installed. It also displays the date when the firmware package was created - this should be used to ensure you are upgrading to the correct version. Update Progress information: During the firmware update procedure this section will display information on progress. Firmware Update – Step Three – Selecting your hardware As the GUI can upgrade all your available JAR:Emulate hardware units, please select from the drop down combo-box your required device. The “hardware status” line will indicate the availability of the hardware unit and may show one of the following messages: “Firmware update available (Device is idle)” – The device is OK and ready for update “2 network ports are connected” – Please disconnect all cables going to the network ports, this is to ensure that heavy traffic forwarding does not interrupt the process. “Device is disconnected...” – The device has been disconnected or not visible from the GUI (please ensure an Ethernet cable is attached to the control port (marked ‘C’ on the front of the JAR:Emulate hardware unit), which is visible on the network to the computer running the GUI.) “Firmware unavailable (Device is executing map)” – The device is currently executing a map, please stop the map before selecting the device for upgrade. As mentioned above, any Ethernet cables attached to ports 1 and 2 on the JAR:Emulate hardware unit should be disconnected as well. “Firmware unavailable (Device is currently paused)” – The device is currently paused, please stop the map before selecting the device for upgrade. As mentioned above, any Ethernet cables attached to ports 1 and 2 on the JAR:Emulate hardware unit should be disconnected as well. “Firmware unavailable (Device is in error state)” – The device is not currently available as it is in an error state, please remove this error state before selecting the device for upgrade. Firmware Update – Step Four – Selecting your firmware package Please enter the path and filename of your firmware package into the “firmware path” field. You can search your hard disk for the firmware by using the open dialog - click the button marked with two dots (“..” ) Once you have located your firmware please select it. Information about the firmware package will be displayed as follows (please note the information in the screenshot below is an example): Your firmware version and build information will change for each new version of firmware. Please ensure this has occurred. Please note that the GUI will not allow you to install old versions of firmware. Page | 49 JAR:Emulate Installation and User Manual July 2013 Firmware Update – Step Five – Starting the update Click on the ‘Begin Update’ button located in the ‘Update Progress’ section. If this button is not available please ensure that you have correctly selected a valid firmware package and no problems exist (as listed in the “hardware status” field) You will be presented with two messages informing you of the process, you must accept each of these before continuing. At this point the firmware update process is underway. It is of critical importance that you do not interrupt this process, power cycle the unit or close the GUI. Firmware Update – Step Six – Update process The progress section, as shown below, provides information on each step of the operation. The update operation will take around 30 to 360 seconds (depending on your computer) to complete and should require no user intervention. If you do receive an error message that the firmware update process has encountered a problem, please reattempt the firmware update. If you have any further issues please contact [email protected]. Firmware Update – Step Seven – Finalisation After the unit has received the firmware package it will verify that the package is correct and contains no errors. If there are no problems the system will commit the new firmware and reboot itself. The GUI will keep you updated on each of these steps through information presented in the progress section. When the unit has rebooted the GUI will check to make sure the unit is at the correct firmware version and report successful completion. You are free to update multiple JAR:Emulate hardware units by selecting them in the drop-down combo box and starting the process again. Firmware Update – Step Eight – Optional GUI Update Major firmware updates are usually accompanied by an updated GUI to allow the user to access new features or functionality. If you have received a new GUI update, it’s important to close the existing GUI down and uninstall it (If the update is minor, you’re network maps will be preserved). Please install the update. This usually involves clicking the “JAR:Emulate_GUI_setup.exe” application which will guide you through the process. Page | 50 JAR:Emulate Installation and User Manual 11.8.3. July 2013 Help Menu Returning to the main Master Menu bar, the last sub menu is ‘Help’, which contains three options: ‘About’, ‘Activate Product’ and ‘Dump XML’. 11.8.4. About Within this option are the terms and conditions relating to the JAR Technologies, JAR:Emulate WAN emulator and its operation, alongside information on the license agreement. By using Central GUI you are deemed to have accepted the terms and conditions present within the GUI (including any updated terms and conditions) 11.8.5. Activate Product Upon installation, the GUI should prompt the user to activate the product using the activation key supplied with the JAR:Emulate hardware box. If for any reason this screen does not appear, the user can open the activate product window from the master menu bar, and follow the onscreen instructions (or those found in section 6.6 of this manual). If you have licensed additional tools, you will receive a new license key – this should be entered here. 11.8.6. Save Map XML / Show Map XML The underlying protocol between JAR:Emulate and the GUI is XML over TCP. This option allows you to dump the XML from the current map in order to assist with automated testing. Please contact JAR Technologies if you would like more information on placing JAR:Emulate within your automated test environment. Page | 51 JAR:Emulate Installation and User Manual July 2013 12. Routed and Bridged Operations Overview This section details the differences between the routed and bridged mode operations of the unit. For information on using Virtual Routers please see the “Routed mode tool box” section. 12.6. Introduction Bridged mode provides a “bump in the wire” WAN emulation; the JAR:Emulate unit will sit invisibly between the various systems under test and inject impairments as created by the user. Routed mode provides Virtual Routers (VRs) that are attached to each physical port, which allows each physical port to act as a different subnet on a larger WAN. Each Virtual Router has the ability to handle DHCP requests, ICMP messages and provide statistics on DHCP leases, physical and WAN packets. In Routed mode impairments are placed between each Virtual Router to simulate the required WAN. Filtering is not supported in routed mode. 12.7. Selecting the required operation Locate the “‘Map/Device Navigation” window on the left side of the GUI. Right click on the hardware you wish to add the map to, and select the required operation “new routed mode map” or “new bridged mode map”. 12.8. Visualisation of operation The “‘Map/Device Navigation” window shows all available network maps, the routed and bridged maps have the words “(Bridged)”and “(Routed”) appear next to their names. The icon used to represent the network map also changes to show the map’s operational mode. Routed Icon Bridged Icon Tool Differences Given the nature of Routed mode and Virtual Routers, the available tools are different. The first major difference is routed mode provides ‘Virtual Routers’ which can be added to the network map. Please note that Routed mode does not currently support filters. Page | 52 JAR:Emulate Installation and User Manual July 2013 13. GUI Walkthrough - Map/Device Navigation Bar Located on the left of the GUI is the ‘Map/Device Navigation’ bar, as highlighted in red below: The map/device navigation bar allows the user to logically group JAR:Emulate hardware units (known as ‘devices’) and maps that have been designed for each device. It also provides access to settings which are specific to each JAR:Emulate device. If only one JAR:Emulate hardware unit has been purchased, this view is limited to one device, although please note a ‘sandbox’ will also appear in the map/device navigation bar. The ‘sandbox’ is explained in more detail below. 13.6. Contents and Settings Upon installation, your JAR:Emulate hardware unit will be visible in the Device/Map navigation bar, titled “JAR:Emulate WAN Emulator”. Also present in this pane will be a virtual device titled ‘Sandbox’. The sandbox is an offline, ‘design-only’ area where new maps can be designed if another user is currently running an emulation. Offline devices (e.g. JAR:Emulate hardware units which are currently not connected or turned on) will be denoted with a red icon, and the device from which emulations can be performed will be denoted by a green icon. In the screenshot below, both the Sandbox and the ‘R&D Box 1’ devices are offline, while the ‘Work Machine’ device is online and can perform emulations. Multiple JAR:Emulate devices can be added to each instance of the JAR:Emulate GUI. Page | 53 JAR:Emulate Installation and User Manual July 2013 By default and to aid recognition the IP address of each device is shown in brackets after the device’s name. Each device holds the network emulation maps that have been created or copied to it, alongside device specific settings. Optionally there is the device’s routing table and captured traffic lists (if licensed). By clicking on the ‘+’ expander icon beside each device, the user can view these options, as shown below: Expanded device titled ‘Work Machine’, showing 4 further options: ‘Maps’, ’Settings’, ‘Routing Table’ and “Captured traffic” - Your configuration may differ from this example 13.7. Adding, renaming or removing hardware The ‘Device/Map Navigation’ pane provides the ability to add new hardware (i.e. another JAR:Emulate hardware device), rename existing hardware devices and delete unwanted devices. By right clicking on the title of any hardware device (in the above screenshot, for example, the user would right click on ‘Work Machine (192.168.1.234)’, three options are displayed. These are: Add hardware: Adds a new piece of hardware using its IP address Rename hardware: Changes the title of the hardware Delete hardware: selecting this option will remove the device, all it’s setting and all maps assigned to it from the GUI. It is strongly recommended that a back-up is undertaken prior to deleting a device from the JAR:Emulate GUI. Page | 54 JAR:Emulate Installation and User Manual July 2013 13.8. Maps Maps are at the core of JAR:Emulate emulator and its operation. These are the visual representations of the intended WAN and each is stored against a JAR:Emulate device in the ‘Map/Device Navigation’ pane. JAR:Emulate ships with a series of default emulation maps, these are accessed by expanding the ‘+’ icon as highlighted in red below: Please note: depending on your software configuration, your view may be different. The graphic to the left is for illustrative purposes only By double clicking on any of these maps, they will each appear on a new tab within the main Design pane, and are then ready for modification or emulation. Please note: once a map is modified in any way, the changes are saved automatically- it is recommended that if a user is unsure if they wish to make any changes, they should make a copy of the map and rename it before proceeding. Creating a new map for emulation Creating new maps is simple: within the map sub-menu, right click on the ‘Maps’ title (or any actual map listed) and select which type of map you want to create as your starting canvas: Ensure you are creating the new map against the appropriate device – in this example we are creating a new map for the ‘Work Machine 192.168.1.234’ device Page | 55 JAR:Emulate Installation and User Manual July 2013 New Bridged Mode Map - Create blank map: creates a new bridged mode map, called ‘(Bridged) untitled’ in the Design pane, with no WAN impairments or start/end points. These are then added via the ‘Network Toolbox’ menu to the right of the GUI New Bridged Mode Map - Create basic map : creates a new bridged mode map, called ‘(Bridged) untitled’ in the Design pane. The network map is created blank, with just network start/end points. The choice of which map is created is decided by the “Map Settings” panel on the ‘GUI Settings’ window New Routed Mode Map - Create blank routed map : creates a new routed mode map, called ‘(Routed) untitled’ in the Design pane. The network map is created with no virtual routers, physical ports or impairments. New Routed Mode Map – Routed Mode Wizard : This option will show the routed mode wizard, allowing you to select IP and DHCP information for each Virtual Router. The network map will then be created to represent the supplied information. You will note that the map is stored against the device in which it was created. Options for moving maps between devices are explained below. Amending Maps Maps that are created can be duplicated (within the same JAR:Emulate hardware device), copied (to a different device), renamed or deleted. This is achieved by right clicking on the map that is to be amended, which will display the following sub-menu: Right clicking on the map you wish to edit brings up a series of options, as explained below Copy: the selected map, its name and all its setting are copied into the clipboard. Use this feature when you wish to copy a map from one device (such as the sandbox) to another (such as a connected JAR:Emulate hardware device, ready for emulation). Paste: this option will be greyed out (as shown above) until another map has been copied to the clipboard. Once selected, it will transfer the copied map to the chosen location, including a different JAR:Emulate hardware device from the one in which it was created Page | 56 JAR:Emulate Installation and User Manual July 2013 Duplicate: this copies the selected map, its name and all its settings, and pastes an exact replica within the same device. The duplicate is recognisable by its title, which will be the same as the original except it will be post fixed with an underscore. Create blank map, create new map: these options create a blank map or a basic map with options chosen from the “Map Settings” panel on the “GUI Settings” window. Rename map: this option allows the user to rename the map, and can be relevant when copying or duplicating maps Delete map: this removes the selected map from the device, including all its settings. Please note that this deletion is normally permanent, contact JAR Technologies if you accidently delete an important network map. Saving and storing The JAR:Emulate GUI automatically saves all changes made to any map or JAR:Emulate hardware device. However, we highly recommend, particularly in a multi-user environment, that regular back- ups are performed and the copying/pasting of maps (as back-ups) into the sandbox is undertaken. Page | 57 JAR:Emulate Installation and User Manual July 2013 13.9. Device Settings Each device in the ‘Device/Map Navigation’ pane will have a ‘settings’ option, as highlighted in red below: The settings option for each device allows the user to define and change the JAR:Emulate hardware device’s configuration. By default it opens on the ‘general settings’ tab, as described below: Please note that most of the settings are only visible when the unit is connected. General Settings Shown below is the general settings tab – please note that some units will be supplied with a ‘unit date and time’ field. This allows the user to set the local time of the hardware if desired, but its main purpose is to timestamp captured traffic files. Page | 58 JAR:Emulate Installation and User Manual July 2013 1 2 1 3 Unit Naming Name: Change the name of the JAR:Emulate hardware device if required - use this field to intuitively name each JAR:Emulate device, which becomes increasingly important when more than one JAR:Emulate device is in operation Description: Provide a description of the JAR:Emulate device, if required, for intuitive identification 2 Idle traffic flow settings: Only allow traffic to flow when map is executing: No packets will be sent over the physical link between the devices connected to the JAR:Emulate hardware, unless an emulation is being performed. Actively route traffic whilst unit is idle [Default Setting]: This option allows data sent from any devices connected to JAR:Emulate to be routed through the JAR:Emulate hardware unit while no emulation is being performed. In this instance JAR:Emulate acts as a network switch. 3 Unit Time (for WireShark Captures) This option allows you to change the units date/time as reflected in WireShark captures. Auto-forwarding By default the JAR:Emulate hardware device will act as switch between any devices connected to it (via ports 1 and 2) and will automatically forward traffic when an emulation is not being performed. This allows for network traffic to flow as normal, with no WAN impairments introduced. When traffic is being forwarded, the LED titled ‘Forwarding’ on the front of the hardware unit will be lit. Page | 59 JAR:Emulate Installation and User Manual July 2013 Routed Mode – caution If you are executing routed mode network maps, you may wish to disable automatic forwarding when the unit is Idle. When a network emulation map is stopped, the virtual routers cease to function and are therefore not available to answer DHCP, ARP or ICMP requests from any clients. If you allow forwarding when the unit is idle (i.e. not executing a routed network map) any clients may still continue to communicate for an undetermined length of time. Communication between clients will usually start to fail when they attempt to communicate with the (ceased) Virtual Router (i.e. for ARP requests). It is therefore recommended that you do not use automatic forwarding as this can lead to undesired results. Page | 60 JAR:Emulate Installation and User Manual July 2013 Control Port Network Settings The control port is located on the front right of the JAR:Emulate hardware unit (marked ‘C’), and is connected to a LAN that the computer running the GUI is located on. Please note: if these settings are changed without the hardware turned on or connected to the GUI then all you will change is the IP address at which the GUI looks for the device. The JAR:Emulate hardware’s IP address will not be changed and the GUI will lose communications with it until the units IP address is restored. IP Address: this uniquely identifies the device running the GUI. Subnet mask: Provides the subnet mask for the unit, please ensure the IP address is within this subnet range. Gateway: Gateway IP address. The ‘Version Information’ tab provides non-editable versioning data, which may be asked for by JAR Technologies technical support. The information will be automatically updated if new firmware is sent to the unit following, for example, a new release of features/functionality. Hardware Reset Under certain circumstances you may wish to reset the JAR:Emulate hardware to its default IP address when you are unable to communicate with it due to limitations on your network. To reset the IP address to “192.168.1.100” please insert a small and long non-metallic object into the reset hole as indicated the following picture. Page | 61 JAR:Emulate Installation and User Manual July 2013 Reset IP Address “Pin hole” switch. When the reset button is depressed the front panel LED’s will flash, continue to hold down the button for 10 seconds. At this point the unit will reset and then become available on “192.168.1.100”. You will have to adjust the settings on the GUI so that it can communicate with the JAR:Emulate unit now located on “192.168.1.100” – Please see section above (11.4.2 – Control Port Network Settings) 13.10. Captured Traffic Files On the Map/Device Navigation bar, the user will also see an option titled ‘Captured Traffic Files’ (if available/licensed). This is where traffic that has been recorded is made available for download to a local hard drive or where previously recorded traffic can be uploaded for emulation. Please see section titled ‘stored traffic’ for full information. Page | 62 JAR:Emulate Installation and User Manual July 2013 14. Network Toolbox Overview Located on the right of the GUI, the network toolbox contains the objects and impairments required to construct network maps for emulation. Icons in this toolbox can either be ‘dragged and dropped’ onto the main Design pane, or can be double clicked and then dragged into position. The following diagram displays an example of how the network toolbox will appear and provides guidance on its navigation: As JAR:Emulate tools are license based, you will have a sub-set of the tools shown in the screenshots here. This manual is also modified per customer to list only the supplied impairments, if you require other tools please contact JAR Technologies Ltd. The main Network Toolbox pane provides access to all the tools and impairments required to construct network maps for emulation. Users can drag and drop required icons onto the main Design pane, or double click to add them to the centre of the Design pane. Please note: depending on the version of JAR:Emulate being used, certain configurations are not permitted (a warning will notify the user). For example, when using a 2 port version of JAR:Emulate hardware there can be no more than 2 incoming and 2 outgoing ports added to any single emulation map. Routed mode vs Bridged mode: If the current network map is a routed mode map, the shown tools will be different than a bridged mode map. Tools can be sorted as follows: By group i.e. grouping all objects relating to ports together, grouping all impairment tools together etc. Alphabetically Page | 63 JAR:Emulate Installation and User Manual July 2013 14.6. Tool and Impairments - General Settings All tools and impairments within JAR:Emulate have individual settings to allow powerful control over the exact conditions which require emulation - these settings are described in detail below. However, it should be noted that all tools in the Network Toolbox contain user accessible general settings which allow all tools to be re-named and their description changed, if required for ease of use or understanding by third parties. Once a tool is added to the Design pane, right clicking will show an option titled ‘settings’ (only available in Edit mode). When clicked on, the settings menu will appear and the first fields displayed allow the tool’s name and/or description to be amended. Below is an example screenshot, showing the general settings section of the ‘delay packet’ tool: If the user wishes to name the tool to better suit its specific use on any given network emulation map, they can change the above fields. In this example, the user may wish to change the “Delay Packet” name to reflect the true nature of the object such as “Outward Delay Path”. The name is then reflected in the representation on the design pane. The following section will step through the purpose, functionality and use of each tool available for designing and running emulation maps. Where possible, this has been limited to the tools provided for your configuration. Page | 64 JAR:Emulate Installation and User Manual July 2013 15. Network Toolbox 15.6. Bridged vs Routed mode The available tools will change depending on the type of network map being displayed. For example on routed mode maps you will find a selection of “Virtual Routers” and “WAN Points” which are missing from the bridged mode. The usage of some tools will also be different in each mode, for example the network start and end points have different purposes in routed mode. For more information on routed mode and its tools please see the dedicated “Virtual Routers” section. 15.7. Licensed Tools Depending on your model and license requirements you may have some or all of the available emulation tools, if there is a tool you require please contact JAR Technologies and we will endeavour to activate the tool on your GUI. 15.8. Network Emulation Tools Available The following sections provide detailed information on all the impairments tools available in our JAR:Emulate units. Page | 65 JAR:Emulate Installation and User Manual July 2013 15.9. Network Ports Ports are fundamental in the operation of JAR:Emulate WAN emulation, as they represent the source and destination for data that is passed through JAR:Emulate, and which is therefore subjected to WAN impairment. In effect, the user should consider each port icon within the GUI’s Design pane as a network start or end point on the emulated WAN. Use in Bridged Mode Bridged Mode permits the flow of all packets from physical ports (2 , 4 or 8 ports depending model) to enter and leave the WAN emulation. All data received from a specific port will be passed to an opposite port (subject to the network port is used in the emulation map) and visa-versa. For example the bridged mode is most applicable when there are two (for 2 port unit) devices under test (DUT) physically linked to the JAR:Emulate network ports 1 and 2 (i.e. no switch or router before the DUT). Using bridged mode also removes some of the complexities associated with virtual routing (for example, they do not need to use DHCP to obtain IP addresses). Bridge Mode: Bi-directional Impairment JAR:Emulate can perform emulation bi-directionally i.e. data both sent and received by each device connected to the JAR:Emulate hardware unit can be subjected to WAN impairments. Within the GUI’s Design pane, this is represented by 2 network start points (i.e. port 1 and 2) and 2 network end points (again, ports 1 and 2). Data being sent from the device connected to port 1, to the device connected to port 2 Data being sent from the device connected to port 2, to the device connected to port 1 Page | 66 JAR:Emulate Installation and User Manual July 2013 Bridged Mode: Port 1 -> Port 8 – incoming traffic only Name : Description : Port 1 to Port 8 (depending on model)– incoming traffic only In physical terms these objects represents the incoming source of packets into the WAN emulation. Depending on the model this can present 2, 4 or 8 physical ports. Network Tool Box Icons : These icons represent the incoming traffic into the JAR:Emulate hardware unit (i.e. the simulated WAN) Emulation Design Pane Icons : Available Input(s) : Available Output(s) These icons (which appear when the above network toolbox objects are dropped onto the Design pane) represent the start points of your data to be emulated. None – these objects represent the start of the network under emulation 1 Output – any destination on a connection but for an emulation to work, the connection must terminate at a network end point (see below) Page | 67 JAR:Emulate Installation and User Manual July 2013 Bridged Mode: Port 1 -> Port 8– outgoing traffic only Name : Port 1 to Port 8 (depending on model) – outgoing traffic only Description : In physical terms these ports represents the network end point for data leaving the JAR:Emulate hardware unit via ports 1 and 2. Within the GUI, they can be thought of as the end points for data arriving at the ‘far end’ of the WAN. Network Tool Box Icons : Emulation Design Pane Icons : These icons (which appear when the above network toolbox objects are dropped onto the Design pane) represent the end points of your data which has been subject to WAN emulation. Available Input(s) : Available Output(s) 1 Input – a connection from any impairment or filter None – this is a network end point Page | 68 JAR:Emulate Installation and User Manual July 2013 Use in Routed Mode Routed mode provides virtual routers which are attached to each physical port, in this mode the network start and end points are used to attach a virtual router to a specific port. Please note that no impairments are allowed between the physical ports and the Virtual Router, you must place all impairments on the WAN link between Virtual Routers. Please see the Virtual Router section for further information. Routed Mode Rules for Traffic Flow Please refer to section 11.4.1 on this user manual to understand how to access overall settings for routed mode operations (including traffic flow rules and forwarding table settings). Page | 69 JAR:Emulate Installation and User Manual 15.10. July 2013 Packet delay Impairment Tool Overview: Name : Description : Packet Delay Introduces fixed and ranged delay to data Network Tool Box Icon : Design Pane Icon : Available Input(s) : Available Output(s) Options : Please note that summary information is indicated for this impairment on the Design pane icon – the example above shows a delay setting of 50ms 1 Input – Any source on same connection 1 Output – Any destination on same connection Linear/Constant delay with Jitter Range Delay Normal/Gaussian Ramp Sinusoidal Introduction The packet delay impairment introduces delays to any packets that enter it. The diagram below shows the delay tool connected between two routed connections, introducing a fixed delay of 50ms. Purpose The ‘Packet Delay’ impairment will receive data and ‘hold’ the received packets using the settings defined by the user. This tool replicates latency commonly found on corporate WANs and the Internet. It should be noted that there is always a delay associated with sending data (regardless of the distances to be covered), given the physical limitations in relation to the speed of light. Page | 70 JAR:Emulate Installation and User Manual July 2013 Mode overview The packet delay tool has a number of different impairment modes: Constant Constant delay is often used on fixed delayed links such as microwave or satellite, and can be useful for simulating the delays experienced by packets as they enter network equipment (routers, switches and other latency inducing devices). Packets can also be delayed simply because the network interface must undertake other actions first, before it can process and route the packet as required. Range Range delay is used to simulate a range of latencies that are experienced by most equipment on the public Internet or over long-hop private circuits. Normal / Gaussian This applies a normal or Gaussian distribution to packet delays, if plotted this would resemble the classic bell curve shape which quickly falls off from the mean point. Ramp This provides a linear ramp up from a starting latency to a finishing latency, the user can tweak the delays of this tool as well as the speed of ramp up. Sinusoidal Wave A standard sin wave of latency is produced within a given min/max latency and a time period in which to make the sweep. Mode Reset Please Note: If any delay tool is enabled or disabled (either through manual on/off selection, via the time-line or through “time constraints” options) it will reset its operation - I.e. On reset, Ramp mode will reset back to the start latency and will be ramped up in accordance to the user settings. Setting Once the packet delay impairment has been added to an emulation map, access its settings by right clicking on its icon, and selecting settings: Right click the Delay Packet icon to access settings Page | 71 JAR:Emulate Installation and User Manual July 2013 Overview and constant mode The default name and description of the object will be displayed. These can be edited, which will change how the tool appears on screen The packet delay has “time constraint” control allowing the tool to be enabled after a start delay, and disabled after the duration has passed. Please note this will “loop” The ‘Constant Latency’ field specifies how long each packet will be delayed before being released back onto the connection. This value can range from 1 millisecond to 10,000 milliseconds in 0.1ms steps Available within constant mode is the jitter option. When enabled, the user can select by how much, from the standard bandwidth available (or the limit placed on a connection by the bandwidth throttle impairment), the average jitter should be set to in percentage terms. Once any change is made to these settings, they must be confirmed or cancelled to take effect. Jitter can be added from within the packet delay impairment. Jitter is a variation in the delay experienced by packets as they traverse a network, with some packets moving unimpeded while others are subject to wide variations in their delay. Jitter impacts how software handles incoming data and can severely affect time critical applications (such as those found in the audio and video industry), with packets arriving out of order or dropped from the network. Page | 72 JAR:Emulate Installation and User Manual July 2013 Ranged Delay Mode The range delay mode allows the user to select a min and max latency to be applied to all received packets. The delay impairment tool will pick a new random delay for each packet that it receives. The minimum and maximum latency fields are shown within the Range Mode. These allow the user to specify the lowest and highest millisecond delays that data packets traversing the emulated network will experience. The delay imposed onto data packets will vary in a uniform / random manner between these two values Please see below for more information De-Sequencing of packets By default all advanced delay tools has the ability to reorder (or de-sequence) packets. Given each delay mode may apply a unique latency to a packet (for example the range delay will randomly pick a new latency between the min / max values) there is the likelihood that a later packet may be placed before an earlier packet, for example: Time 0ms – Packet A arrives, is delayed 25 ms, expected output at 25ms (from the beginning) Time 12ms – Packet B arrives, is delayed 5ms, expected output at 17ms (from the beginning) If this operation is not desired please select the option to prevent re-ordering, in the above example Packet B would be guaranteed to be placed on the wire after Packet B. Normal / Gaussian Mode The Gaussian delay mode allows the user to apply latency using a “bell curve” normal distribution. The distribution is controlled by the Mean latency and Standard Deviation, with the ability to set a minimum latency that the tool will never drop below. The minimum latency, if the value select by the normal distribution algorithm is below this value it is clamped to this minimum value. The mean latency to be used by the distribution algorithm. The amount of latency applied will be “around” this value subject to the standard deviation. Standard Deviation value See explanation in range delay mode Page | 73 JAR:Emulate Installation and User Manual July 2013 Ramp Mode The ramp delay mode provides the ability to ramp up the latency in a linear manner. The start latency is applied as soon as the delay tool is activated The start period defines how long the start latency should be applied for. After this period has expired the latency will begin to ramp up. The final latency required, this is the latency that the tool will reach after the rise time has expired The final latency required, this is the latency that the tool will reach after the rise time has expired See explanation in range delay mode Sinusoidal Mode The sinusoidal delay mode creates a constantly fluctuating delay between a min and max value using a sinusoidal curve. The duration of the full curve is supplied as the “Sinusoidal Duration”, for example if the user selects a 1000ms duration the latency will rise from min to max, the back to min after 1000ms. After the 1000ms the cycle will seamlessly repeat. The minimum latency to be applied to the packets The maximum latency to be applied to the packets. The full duration of the sinusoidal wave. See explanation in range delay mode Page | 74 JAR:Emulate Installation and User Manual 15.11. July 2013 Jitter Impairment Tool overview: Name : Jitter Description : Imposes constant or ranged jitter on traffic received Network Tool Box Icon : Design Pane Icon : Please note the jitter setting is indicated on the Design Pane icon - in range mode this display will be limited to one decimal place (for display purposes only) Available Input(s) : 1 Input – Any source on same connection Available Output(s) 1 Output – Any destination on same connection Options : o Constant jitter between 0.1ms and 100 ms, in increments of 0.01ms o Range jitter on uniform distribution between 0.1ms and 100ms in increments of 0.01ms Introduction The jitter tool is related to the packet delay tool, but presents the ability to inject jitter on a link differently. Purpose Jitter is a variation in the delay experienced by packets as they traverse a network, with some packets moving at an average delay rate while others are subject to wide variations in their delay. Jitter impacts how software handles incoming data and can severely affect time critical applications (such as those found in the audio and video industry), with packets arriving out of order or dropped from the network. Range jitter is used to simulate a range of latencies that are experienced by most equipment on the public Internet or over long-hop private circuits. Page | 75 JAR:Emulate Installation and User Manual July 2013 Settings There are two modes available for the jitter tool: Constant – delivering a constant jitter injection from 0.1ms to 100ms, in increments of 0.11ms Range – delivering jitter between a minimum and maximum value as specified by the user, between 0.1ms and 100ms, in increments of 0.01ms Please note, as standard the range mode uses uniform distribution to inject jitter onto the connection i.e. any value between the minimum and maximum is equally as likely to be injected onto to the link as all others. If other jitter distribution models are required, please contact JAR Technologies with your specific requirements for a remote upgrade. Page | 76 JAR:Emulate Installation and User Manual 15.12. July 2013 Bandwidth Throttling Impairment Tool overview: Name : Bandwidth Throttling Description : Imposes limits to available bandwidth on a connection between the input and output – the user defined setting will be the maximum average sent on from this impairment. Network Tool Box Icon : Design Pane Icon : Please note bandwidth setting is indicated on Design pane icon - the example above showing 64 Mb/s Available Input(s) : 1 Input – Any source on same connection Available Output(s) 1 Output – Any destination on same connection Options : Constant Bandwidth Range Bandwidth Introduction The Bandwidth Throttling impairment emulates user defined restrictions on available bandwidth on an emulated connection. The diagram below shows the Bandwidth Throttle tool connected between two physical ports, with a maximum bandwidth of 64 Mb/s. Purpose The Bandwidth Throttling impairment tool effectively reduces the bandwidth available, thereby emulating the real world limitations on data transfer speeds. On a WAN, the data transfer rates can vary greatly over the course of a data packet’s lifetime, depending on factors such as network infrastructure and software used. Page | 77 JAR:Emulate Installation and User Manual July 2013 Settings Once the Bandwidth Throttling impairment has been added to your emulation, access its settings by right clicking on its icon and select settings: Right click the Bandwidth Throttle icon to access settings Bandwidth Throttle Modes Constant Bandwidth If the bandwidth throttle is set into constant bandwidth mode it will throttle the bandwidth to a constant / linear value as supplied by the user. To place the bandwidth throttle in constant throttle please select the “constant throttle” tab sheet as shown below: As with all other emulation tools the general settings can be changed if required To set a bandwidth limit, enter numeric values into the Bandwidth Limit field and select the data size required from the drop down list. The bandwidth units, this can be changed to gain finer control over the bandwidth throttle. The constant delay feature has some advanced functionality, detailed below Once any change is made to these settings, they must be confirmed to take effect Page | 78 JAR:Emulate Installation and User Manual July 2013 Advanced Mode When the advanced checkbox is selected, the constant mode settings window will be extended to include further options, as shown in the diagram below: The advanced options provide finer control over the bandwidth throttle, allowing for simulation of certain bespoke networks and switchesrouters. The advanced settings should normally be left untouched with the “Auto-Size FIFO” enabled, if you should require a large burst of traffic at the start of any constant bandwidth throttle please disable this option and increase the buffer size as required. This will result in a “excess” of bandwidth being available on bursts of traffic. Page | 79 JAR:Emulate Installation and User Manual July 2013 Ranged Bandwidth To place the bandwidth throttle in range mode please select the “range throttle” tab sheet as shown below: As with all other emulation tools the general settings can be changed if required The min and max values the bandwidth can be set to. The duration of each random change in bandwidth. The bandwidth units, this can be changed to gain finer control over the bandwidth throttle. Once any change is made to these settings, they must be confirmed to take effect The range throttle will randomly select a new bandwidth throttle value between the user supplied minimum and maximum values. This bandwidth throttle value will be applied until the duration has expired, at which point a new bandwidth throttle will be randomly selected. This mode has no advanced functionality. Page | 80 JAR:Emulate Installation and User Manual 15.13. July 2013 Ethernet Fragmentation Impairment Tool overview: Name : Ethernet Fragmentation Description : Sets the maximum MTU value (in bytes), above which the packet will be fragmented Network Tool Box Icon : Design Pane Icon : Please note ethernet fragmentation setting is indicated on the Design pane icon - the example above shows a MTU setting of 1500 bytes (its default) Available Input(s) : 1 Input – Any source on same connection Available Output(s) 1 Output – Any destination on same connection Options : MTU value between 128 and 9000 bytes Introduction The ethernet fragmentation tool is used to set the maximum transmission unit parameter across an emulated link. Purpose In IPv4, different physical networks vary in the size and structure of their framing methods, represented by the MTU value. As packets traverse different networks and the MTU varies on interfaces, ethernet packets are fragmented to adapt to the changing MTU values. Settings Once the ethernet fragmentation impairment has been added to your emulation, access its settings by right clicking on its icon and selecting settings. The following screen will be displayed: Page | 81 JAR:Emulate Installation and User Manual July 2013 The MTU value is changed by either entering the desired value, or using the up/down arrows to select 15.14. Background Traffic Generation Tool overview: Name : Background Traffic Generator Description : Generates traffic on the link where inserted Network Tool Box Icon : Design Pane Icon : Please note the traffic generator setting is indicated on the Design pane icon - the example above showing 64Mb/s being generated (its default) Available Input(s) : 1 Input – Any source on same connection Available Output(s) 1 Output – Any destination on same connection Options : Fixed traffic generation rate Percentage of available bandwidth Generate broadcast packets Introduction The Background traffic generator produces packets at the point in which it is attached on the network map. The packets will leave the JAR:Emulate unit through a physical port if the user has Page | 82 JAR:Emulate Installation and User Manual July 2013 assigned the flow of the traffic generator to any physical port. It can generate a fixed amount of traffic or a percentage of the available bandwidth detected on that link. In order to test or place load on receiving equipment under test, the generated packets can be set to a broadcast destination MAC Address. By using the broadcast address all receiving equipment will process the packets, rather than dropping them. Purpose This tool emulates other users/applications sending traffic across a network, and is an important consideration for emulation. Unless fully dedicated, links should be expected to contain a certain amount of background traffic, which is delivered via this tool to an emulation. Settings Once the background traffic generator impairment has been added to your emulation, access its settings by right clicking on its icon and selecting settings. The following screen will be displayed by default: Select ‘fixed data rate’ to generate a traffic rate regardless of the bandwidth of the link the emulator is connected to Select the fixed rate of traffic, between 500 bytes and 128 MB/s This options sets the destination MAC address of all generated packets to FF:FF:FF:FF:FF:FF (Broadcast). By selecting ‘percentage of available link’ for the mode setting, the following screen will be displayed. This allows the user to select how much traffic will be generated based on a percentage of the link speed. Please note that the bandwidth is calculated as follows: 1. If a bandwidth throttle tool is inserted before the background traffic generator, the total bandwidth will be set to the bandwidth throttle value 2. If no bandwidth throttle is detected prior to the background traffic generator, the default setting will be 1 Gbps Page | 83 JAR:Emulate Installation and User Manual July 2013 Select the percentage of the available link’s transfer rate (from 1 to 99%). The data generation rate will be displayed to the right 15.15. Drop Packets Impairment Tool overview: Name : Drop Packets Description : Discards a user determined number of packets received Network Tool Box Icon : Design Pane Icon : Please note packet drop setting is indicated on the Design pane icon - the example above showing 5 packets dropped out of every 100 received Available Input(s) : 1 Input – Any source on same connection Available Output(s) 1 Output – Any destination on same connection Options : Standard (drop a specified number in every user defined total e.g. drop 2 packets for every 10 received) Drop a percentage of packets received Drop packets evenly Drop packets in groups Page | 84 JAR:Emulate Installation and User Manual July 2013 Introduction The Drop Packet impairment emulates the loss of packets experienced during communications over a WAN. This tool allows the user to define a set amount of dropped packets, or a percentage of the total number received. The diagram below shows the Drop Packet impairment on the Design pane, with 5 of every 100 packets dropped from the connection. Purpose The packet drop impairment simulates the loss of a proportion of the data that is sent over a WAN, a situation which can be caused for a wide variety of reasons. Insufficient buffering, firewalls, collisions on shared connections, damaged hardware, routing instability and so on can act independently or in combination to result in packet loss. Settings Once the Packet Drop impairment has been added to your emulation, access its settings by right clicking on its icon and selecting settings: Right click the Packet Drop icon to access settings Standard Packet Drop Mode The Packet Drop settings window will default to standard mode, as shown below: Page | 85 JAR:Emulate Installation and User Manual July 2013 If enabled it delays the starting of the tool and controls the duration the tool will be running Standard mode drops a specified number of packets received, from a specified total. The dropping of packets will continue until the emulation is paused or stopped. Enter a numeric value for the number of packets to be dropped, and the total from which that value should be applied. Alternatively, use the up/down scaling arrows to set these values. Percentage Packet Drop Mode “Drop packets evenly” means that the system will space out the dropping of packets. In the above example 5 in 100, would mean 1 packet every 20 packets. If the option for “drop all” was selected 5 packets (in a row) would be dropped every 100 packets. Using the drop down menu provided for the ‘Mode’ field, the user can select the Percentage Drop option, as shown below. Percentage mode drops a specified percentage of all packets received. The dropping of packets will continue until the emulation run is paused or stopped. The percentage of all packets received which are to be dropped from the emulation is set using this field Page | 86 JAR:Emulate Installation and User Manual 15.16. July 2013 Packet Sinkhole Impairment tool overview: Name : Packet Sinkhole Description : Drops all packets received Network Tool Box Icon : Design Pane Icon : Available Input(s) : 1 Input – Any source on same connection link Available Output(s) None available Options : None Available Introduction The Packet sinkhole impairment tool emulates the loss of all data on a WAN. There are no associated settings for this tool, as packets are effectively discarded once received. If a less than total drop rate is required, please refer to the Packet Drop impairment, which allows users to specify a level of data loss lower than 100%. The diagram below shows the Packet Sinkhole tool connected to a network start point, with no onward connection as no packets will remain once they enter the sinkhole. Purpose A packet sinkhole is commonly used to drop all packets after a filtering operation, or if packet duplicates are worked on/analysed but not then presented to the network (and thus dropped) Page | 87 JAR:Emulate Installation and User Manual 15.17. July 2013 Packet Corruption Impairment overview: Name : Packet Corruption Description : Introduces corruption (such as overwriting or rearranging data) into all packets received Network Tool Box Icon : Design Pane Icon : Please note packet corruption setting is indicated on the Design pane icon - the example above showing 1% corruption on all packets received Available Input(s) : 1 Input – Any source on same connection Available Output(s) 1 Output – Any destination on same connection Options : Bit flips (bits are rearranged) Byte overwrite (bytes are overwritten) Corruption on all packets or user defined corruption start and end points Corruption scale (percentage) Introduction The Packet Corruption impairment simulates the internal distortion that can occur to data held within packets on a WAN. This tool corrupts all packets received, through user defined settings. The diagram below shows the packet corruption tool connected between two routed connections, with 46% of each packet’s contents being distorted. Please note: All received packets are corrupted; therefore the ‘packet counting’ filter is usually required to allow a certain amount of packets to be corrupted. See below for more information. Page | 88 JAR:Emulate Installation and User Manual July 2013 Purpose Data corruption on a WAN can be the result of hardware errors, satellite or microwave link problems or faulty equipment. Normally any network port would automatically drop corrupt packets (as the checksum would fail), however JAR:Emulate correctly produces the corrupt packet on the wire allowing any down-stream devices to receive it. Settings Once the Packet Corruption impairment has been added to your emulation map, access its settings by right clicking on its icon and select settings. The following window will be displayed: There are two corruption modes available: Bitflips and Byte Overwrites, selectable using the drop down menu list. The user can select whether all contents of each packet received may be subject to corruption, or whether this should be limited to a start and end point within each packet (measured in bytes). The upper limit for the end location is 1500 bytes, as this is the byte size limit of standard data packets. The corruption scale sets the level of corruption within each packet: if set at 20%, for example, 20% of the packets contents will be manipulated to emulate corruption Bit Flips This option will flip the bits within the packet, the amount and location are dependent on the other settings selected - this could be on all bits within each packet or only on bits between the userdefined start and end point (measured in bytes within each packet received). If the user, for example, selected a start point of 50 and an end point of 60, then the 10 bytes between these two values will be subject to a rearranging of their data (in every packet received). Byte Overwrites Using this option will replace existing bytes within each packet with randomly generated data, thereby overwriting the byte’s information. Again, depending on the other settings selected, replacement could occur on all bytes within each packet, a certain percentage of bytes, or a certain percentage between start and end points. Page | 89 JAR:Emulate Installation and User Manual July 2013 Corrupting Less Than 100% of packets The packet corruption impairment subjects all packets to corruption – if the user requires less than 100% of packets on a connection to be corrupted, a ‘Packet Counting Filter’ should be inserted onto the Design pane before the Packet Corruption impairment, as follows: 3 2 The packet corruptor will distort these 10% and then release them back onto the connection 10% of the packets received from port 1 will travel along the ‘passed’ connection to the packet corruption tool 1 The Packet Counting Filter can be set to ‘pass’ 10% of packets, and ‘fail’ the remaining 90% of packets received 4 The device denoted as port 2 will receive the 90% of uncorrupted packets and the 10% corrupted packets sent from the device attached to port 1 Page | 90 JAR:Emulate Installation and User Manual 15.18. July 2013 Packet Duplication Impairment overview: Name : Packet Duplication Description : Subjects packets received to duplication Network Tool Box Icon Design Pane Icon : Please note packet duplication setting is indicated on the Design pane icon - the example above shows a simple 1-to-1 duplication of all packets received Available Input(s) : 1 Input – Any source on same connection Available Output(s) 1 Output – Any destination on same connection Options : Simple (all packets received are immediately duplicated once) Timed (packets are duplicated once every user defined number of milliseconds) Complex (packets are duplicated a specified number of times, at intervals set be user) Introduction The Packet Duplication impairment emulates the copying of packets experienced during communications over a WAN. This tool allows the user to define a wide variety of duplication scenarios, from single, immediate duplication through to multiple packet duplication at specified millisecond intervals. The diagram below shows the Packet Duplication impairment connected between ports 1 and 2, with a setting of ‘simple 1:1’ duplication: Purpose Page | 91 JAR:Emulate Installation and User Manual July 2013 The packet duplication impairment is designed to simulate the effects of router, switch or network infrastructure issues. Under normal conditions duplicate packets are relatively rare, but when they occur their effects can be exceptionally detrimental. This impairment is normally used to duplicate UDP or other non-guaranteed TCP/IP protocols. Certain protocols (such as TCP) automatically handle the duplication and mitigate most related application issues. Settings Once the Duplication impairment has been added to your emulation, access its settings by right clicking on its icon and selecting settings: Simple duplication On first use, this impairment’s settings are opened by default on Simple Mode, as shown in the diagram below. This configuration performs a simple 1 to 1 duplication of all data packets received, so that the original data, plus an exact copy, are sent on from this impairment. There are no further settings for this mode. Timed Duplication By changing the Delay mode to ‘Timed (simple duplication after time period)’ the user can delay the duplication of packets received by a specified time period. Please see the diagram below: Page | 92 JAR:Emulate Installation and User Manual July 2013 Selecting ‘Timed’ mode allows the user to delay the duplication of packets for a set period of time Delay intervals can range from 1 millisecond up to 10,000 milliseconds Timed mode performs a 1:1 copy of all packets received, but does not release this onto the connection immediately; instead the system waits for the time entered to pass before sending on the duplicate packet. Complex Timed Duplication The final setting available for the Packet Duplication impairment is ‘Complex Timed’ – please see the diagram below: Selecting Complex Timed mode allows the user to create multiple copies of all packets received A delay between multiple duplications is required, given processing time needed for this operation Choose the number of duplications required, up to a maximum of 10,000 Page | 93 JAR:Emulate Installation and User Manual July 2013 Complex Duplication & Time Considerations Please note that in Complex Timed duplication mode each duplication will be held and released sequentially. In the example screenshot above there will be a total of 10 duplications of every packet received, and each of these will be held for 10 milliseconds, before being released back onto the connection only after the previous copy was released. The total time for one packet’s duplication to be completed and sent on (in the example above) is therefore 1 (packet) x 10 (duplications) x 10 milliseconds (each duplicated packets delay). It would therefore take 100 milliseconds before the full duplication process was completed for this one packet. Users should therefore be aware that duplication may still be ongoing after the last packet of an emulation run has been sent from the source device. This is an important consideration when deciding when an emulation run is complete and can be stopped. Similar to other impairments, if the user does not wish all packets to be duplicated, a ‘Packet Count Filter’ should be placed on the connection before the ‘Packet Duplication’ impairment, thus allowing the user to define how many (or what percentage) of packets received should be subject to any form of duplication. Page | 94 JAR:Emulate Installation and User Manual 15.19. July 2013 Merge Point A merger point is used to merge together different inputs streams into a single output stream. There are some important rules governing the use of TAP devices after a merge point, please see below for details. Name : Merge Point Description : This tool merges together all input packets into a single output stream. Network Tool Box Icon Design Pane Icon : Available Input(s) : Unlimited Inputs Available Output(s) 1 Output Options : None required Usage Below is sample usage of the merge tool This sample usage shows the merging of 3 input streams into a single output stream using the merge tool. The merge tool guarantees the order of packets. If a packet was received from the top path first it will be guaranteed to be delivered to the output stream first, this ensure no desequencing or reordering of your packets. Page | 95 JAR:Emulate Installation and User Manual July 2013 TAP Device Considerations The output of the merge tool does not support any TAP device, whilst the TAP symbol is showed you should not attach any TAP device to this TAP point – you will receive inaccurate results. The following example shows an invalid Statistical Graph: If you require to add a add a TAP device it is recommended you add a dummy impairment (i.e. a Bandwidth Throttle set higher than you’re required bandwidth or a fragmentation tool set to 9000) The following example shows a valid Statistical Graph, using a Ethernet Fragmentation dummy tool: In future revisions this limitation will be lifted or show a disabled TAP device on the GUI. Page | 96 JAR:Emulate Installation and User Manual 15.20. July 2013 Null Point (TAP Extender) The null point is used to extend the visual aspects of the GUI and has no effects on the data traversing the emulated map. It assists visualisation and creates more TAP points for reporting purposes. Name : Null Point (TAP Extender) Description : Provides an extra TAP which can be used to insert further TAP devices (such as more statistics graphs, reports or Wireshark instances) Network Tool Box Icon Design Pane Icon : Available Input(s) : 1 Input – Any source on same connection Available Output(s) 1 Output – Any destination on same connection Options : None required 16. Filter Tools Overview Network filters allow the user to specify what data, or how much data, should traverse an emulation map. These are powerful tools that provide a significant degree of control to the user as they design the WAN to be emulated. Page | 97 JAR:Emulate Installation and User Manual July 2013 16.6. Packet Counting Filter The packet count filter provides the user with control over how much data should be sent to other impairments on an emulation map, and is one of the most commonly used filters within JAR:Emulate. The user decides how much data should be ‘failed’ (either as a percentage or ‘X in every Y packets’ format) with the ‘failed’ data taking a different route than the ‘passed’ data. Name : Packet Counting Filter Description : Separates packets received into 2 new streams of data, one that has ‘passed’ and one that has ‘failed’ depending on the number of packets received. Network Tool Box Icon Design Pane Icon : Available Input(s) : 1 Input – Any source on same connection Available Output(s) 2 Outputs – packets received will be routed down a ‘passed’ or a ‘failed’ connection Options : Fail a set number of packets in a user defined total (fail X packets for every Y packets received) Fail a percentage of packets received Purpose The packet counting filter ensures the user can select a number of packets that are to be subjected to impairments through its “pass” or “fail” filters. If, for example, the user only wanted to corrupt 1% of data received, they would place the ‘Packet counting filter’ before the ‘Packet Corruption’ impairment, set the former to fail 1% of all data received and send this down a connection to the Packet Corruption impairment. The remaining 99% ‘passed’ data would continue on a different connection to the network end point. Page | 98 JAR:Emulate Installation and User Manual July 2013 An example of this is shown below: The packet corruption impairment will corrupt 25% of each packet received 1% of packets will be sent to the Packet Corruption impairment The packet counting filter has been set to ‘fail’ 1% of data packets received The 1% of packets, now corrupted, will be sent on to join the other 99% uncorrupted packets at the network end point The remaining 99% of packets will travel on to the network end point Note the ‘failed’ and ‘passed’ labels on the two connections coming out of the packet counting filter, showing which direction the 1% ‘failed’ and 99% ‘passed’ packets will take in the above example. The packet counting filter should therefore be used in advance of other impairments, to direct traffic to or away from that impairment. Settings There are two settings for packet counting, as described below. Right click on the Packet Counting Filter after it has been added to the Design pane, and click on ‘settings’ to access. Fail ‘X’ in ‘Y’ Using this setting, the user selects how many packets received should be failed, out of a total number received. Page | 99 JAR:Emulate Installation and User Manual July 2013 Select this option to fail a defined number of packets within a total number received Define the number of packets to fail Percentage Fail Use this mode to set a percentage on how many packets received via the Packet Counting Filter should be failed. Select this option to fail a defined percentage of all packets received Define the percentage of packets to fail 16.7. UDP/TCP Filters Users can also filter network traffic based on whether the received packets is a UDP (User Datagram Protocol) or TCP (Transfer Control Protocol). These filters also contain advanced settings as described below. Name : UDP / TCP Filter Description : Separates packets received into 2 new streams of data, one that has ‘passed’ and one that has ‘failed’. This is based on an assessment of whether the received packet is either TCP or Page | 100 JAR:Emulate Installation and User Manual July 2013 UDP Network Tool Box Icon Design Pane Icon : Available Input(s) : 1 Input – Any source on same connection Available Output(s) 2 Outputs – packets received will be routed down a ‘passed’ or a ‘failed’ connection Options : Simple (pass/fail based on whether a packet received in UDP or TCP) Advanced (provides advanced routing to identify a specific stream of data between 2 devices) Purpose TCP and UDP filters are used to differentiate packets on a connection between a network start and end point (i.e. ports) so that the user can impair traffic that has either passed or failed the TCP/UDP filter. Both failed and passed data (e.g. data that is not TCP traffic and data that is) can be subjected to impairments following the filter. Please Note: Dropping all non-UDP traffic may not be beneficial, as many of the underlying protocols such as ARP are required before UDP communications can occur. Settings UDP and TCP filters contain similar settings, as described below. Simple Mode Simple mode interrogates all packets received by both these filters, and determines if they are TCP or UDP packets. If this is the case, the packet is ‘passed’ and is released onto the outgoing connection which is marked ‘passed’. Similarly, if the packet is not a TCP or UDP packet, it is failed and sent out on the ‘failed’ connection from the filter. Please note, that only one outgoing connection is required from either a TCP or UDP filter if desired (which can either be ‘passed’ or ‘failed’). Any passed or failed data that is not subsequently passed on to another impairment or the network end point, will be dropped automatically. Page | 101 JAR:Emulate Installation and User Manual July 2013 Simple mode performs a check to determine if received packets adhere to the UDP or TCP protocol. If a packet is UDP or TCP, it is sent out on a ‘passed’ connection (if one has been set up by the user). If a packet fails this test, it will be sent out from this filter via the ‘failed’ connection. Advanced Mode - Data Stream Filtering The advanced mode allows the user to identify a specific UDP/TCP data stream from all data traversing the network. The user can then subject this stream to various impairments, while leaving all other packets sent/received by devices connected to JAR:Emulate untouched (or perform a different impairment on it). Advanced settings are described below – please note these settings are identical in their appearance and operation for both the UDP and TCP packet filters (aside from the name and description of each). Page | 102 JAR:Emulate Installation and User Manual July 2013 Selecting Advanced filter mode activates the settings show below See Point 1 below See point 2 below See point 3 below 1. Source Port Filtering Off (no filtering): Select this option if the source port is not of interest Source Port: Settings this value will make sure the packets source port is set to the specified value. Only packets from this source port will be ‘passed’ Source Range: Allows a specific range of source ports to be included, if the packets source port is within the range they will be ‘passed’. Page | 103 JAR:Emulate Installation and User Manual July 2013 2. Destination Port Filtering Off (no filtering): Select this option to ignore the UDP or TCP packets destination port. Destination Port: Setting this value will ensure the packets destination port is set to the specified value. Only packets to this destination port will be ‘passed’ Destination Range: Allows a specific range of destination ports to be included, if the packets destination port is within the range they will be ‘passed’. 3. UDP/TCP Packet Length Filtering Off (no filtering): Packet length is ignored Equal to: If the total packet length is equal to this value, then the packet is “passed” Not Equal To: if the total packet length is not equal to this value, then the packet is “passed” Less than Equal To (<=): The packet is passed if its length if less than or equal to the supplied value. Greater than or Equal to (>=): The packet is passed if its length is greater than or equal to the supplied value. 16.8. Ethernet MAC Address Filter The Ethernet MAC filter allows the user to filter all incoming IP packets for source and destination MAC addresses. Name : Packet Counting Filter Description : Tests an received packet against a single or range of source and/or destination MAC addresses. Network Tool Box Icon Design Pane Icon : Available Input(s) : 1 Input – Any source Available Output(s) 2 Outputs – packets received will be routed down a ‘passed’ or a ‘failed’ connection Options : No source MAC address filtering Single source MAC address Range of source MAC addresses No destination MAC address filtering Single destination MAC address Range of destination MAC addresses Page | 104 JAR:Emulate Installation and User Manual July 2013 Purpose The main purpose of this filter is to test the received packet for a matching MAC address in its Ethernet frame header. The filter provides both source and destination MAC address filtering and 3 different ways to provide those addresses. Settings The settings window provides all the available options on one window. The top section of the filter settings deals with the Source filter options, whilst the bottom half deals with the destination filter options. Source MAC Address Filter Options Destination MAC Address Filter Options This option will display information about the filter on the main desktop, allowing quick review of the filter settings. Source and Destination Options The filter provides separate settings for both the source and destination, however they are functionally identical. Therefore we will focus on the source options: Page | 105 JAR:Emulate Installation and User Manual July 2013 This option disables checking of the source MAC address. If set packets with this MAC address will pass the filter If selected the packet will pass if the filter if the MAC address is between the start and end values. All MAC addresses are validated to ensure they conform to the standard colon delimited format (i.e. “aa:bb:cc:dd:ee:ff”). The green LED’s are used to indicate any problems with the MAC address, and an on screen error message will give further instructions. The destination options perform exactly the same roles, except they take effect on the destination MAC address field in the Ethernet frame. 16.9. Ethernet Payload Filter The filter scans the Ethernet payload field of any received packets. Name : Packet Counting Filter Description : Tests against a set value in the Ethernet payload field. Network Tool Box Icon Design Pane Icon : Available Input(s) : 1 Input – Any source Available Output(s) 2 Outputs – packets received will be routed down a ‘passed’ or a ‘failed’ connection Options : Industry defined payload type User defined payload type Page | 106 JAR:Emulate Installation and User Manual July 2013 Purpose This simple filter checks the 16-bit value stored in the Ethernet Payload filter against the user selected value. The tool allows you to select from industry defined types or enter a user defined value. Settings The settings window provides all the available options in one window: This option allows the user to select a value from the industry standard list. The user can supply a 16-bit hexadecimal number for custom filtering. This option will display information about the filter on the main desktop, allowing quick review of the filter settings. Page | 107 JAR:Emulate Installation and User Manual 16.10. July 2013 IP Address Filter The IP filter allows the user to filter all incoming IP packets for source and destination IP addresses. Name : Packet Counting Filter Description : Tests a received packet against a single or range of source and/or destination IP addresses. Network Tool Box Icon Design Pane Icon : Available Input(s) : 1 Input – Any source Available Output(s) 2 Outputs – packets received will be routed down a ‘passed’ or a ‘failed’ connection Options : No source IP address filtering Single source IP address Range of source IP addresses No destination IP address filtering Single destination IP address Range of destination IP addresses Purpose The main purpose of this filter is to test the received packet for a matching IP address in its IP frame header. The filter provides both source and destination IP address filtering and 3 different ways to provide those addresses. Page | 108 JAR:Emulate Installation and User Manual July 2013 Settings The settings window provides all the available options on one window. The top section of the filter settings deals with the Source filter options, whilst the bottom half deals with the destination filter options. Source IP Address Filter Options Destination IP Address Filter Options This option will display information about the filter on the main desktop, allowing quick review of the filter settings. Source and Destination Options The filter provides separate settings for both the source and destination, however they are functionally identical. Therefore we will focus on the source options: This option disables checking of the source IP address. If set packets with this IP address will pass the filter If selected the packet will pass if the filter if the IP address is between the start and end values. Page | 109 JAR:Emulate Installation and User Manual July 2013 All IP addresses are validated to ensure they conform to the standard “dot” delimited format (i.e. “192.168.1.6”). The green LED’s are used to indicate any problems with the IP address, and an on screen error message will give further instructions. The destination options perform exactly the same roles, except they take effect on the destination IP address field in the IP frame. 16.11. IP Protocol Filter The filter scans the IP protocol field of any received packets. Name : Packet Counting Filter Description : Tests the IP Protocol field of any received IP packets Network Tool Box Icon Design Pane Icon : Available Input(s) : 1 Input – Any source Available Output(s) 2 Outputs – packets received will be routed down a ‘passed’ or a ‘failed’ connection Options : Industry defined protocol type User defined protocol type Purpose This simple filter checks the 8-bit value stored in the IP protocol field, of any received IP packets. The field is checked against a user supplied value. This tool allows you to select from industry defined type or enter a user defined value. Page | 110 JAR:Emulate Installation and User Manual July 2013 Settings The settings window provides all the available options on one window. This option allows the user to select a value from the industry standard list. The user can supply a 8-bit hexadecimal number for custom filtering. This option will display information about the filter on the main desktop, allowing quick review of the filter settings. Page | 111 JAR:Emulate Installation and User Manual 16.12. July 2013 VLAN Protocol Filter The filter scans the VLAN field of any received packets. Name : VLAN Protocol Filter Description : Tests the VLAN field of any received IP packets Network Tool Box Icon Design Pane Icon : Available Input(s) : 1 Input – Any source Available Output(s) 2 Outputs – packets received will be routed down a ‘passed’ or a ‘failed’ connection Options : VLAN ID User Priority Purpose This filter checks for a VLAN labelled packet, if the packets matches the user supplied VLAN ID (tag) and User priority it passed the filter. Settings The settings window provides all the available options on one window. VLAN ID (tag) the packet must match to pass the filter The VLAN User priority the packet must match to pass the filter This option will display information about the filter on the main desktop, allowing quick review of the filter settings. Page | 112 JAR:Emulate Installation and User Manual 16.13. July 2013 MPLS Protocol Filter The filter scans the MPLS field of any received packets. Name : VLAN Protocol Filter Description : Tests the MPLS field of any received IP packets Network Tool Box Icon Design Pane Icon : Available Input(s) : 1 Input – Any source Available Output(s) 2 Outputs – packets received will be routed down a ‘passed’ or a ‘failed’ connection Options : MPLS Label QOS TTL Purpose This filter checks for a MPLS labelled packet. If the MPLS labelled packets matches the supplied values it will pass the filter. Settings The settings window provides all the available options on one window. The MPLS label that the packet must contain to pass this filter The MPLS tagged packet must have the supplied QOS Value The MPLS tagged packet must have the supplied TTL Value This option will display information about the filter on the main desktop, allowing quick review of the filter settings. Page | 113 JAR:Emulate Installation and User Manual 16.14. July 2013 Output Switching Filter The filter can switch incoming packets to several outgoing streams. Name : Output Switch Filter Description : Switches incoming packets to one of many outgoing streams Network Tool Box Icon Design Pane Icon : Available Input(s) : 1 Input – Any source Available Output(s) Up-to 4 output paths Options : Number of output paths Default output path Purpose This filter will switch the incoming packet stream to one of the available output streams; it performs no further operation on the packets and adds no latency or other impairments. When the emulation map is running the user can click on the output switch filter to manually change the flow of packets. The selection of output streams is currently not supported in the time-line feature. Settings The settings window provides all the available options on one window. Page | 114 JAR:Emulate Installation and User Manual July 2013 The total number of output stream available, up to 4 may be selected The currently selected (default) output stream. This output stream will receive packets when the emulation map is first executed. Page | 115 JAR:Emulate Installation and User Manual July 2013 1.7 Virtual Routers 16.15. Introduction The simulation of Virtual Routers allows you to create isolated LAN (on physical ports) interconnected through routed WAN environments. 16.15.1. Features set The JAR:Emulate WAN Emulator provides two methods of Virtual Router emulation, a “Basic Virtual Router” and an “Edge Virtual Router”. The main advantages of the Edge virtual router over the basic virtual router are: Support for multiple WAN links between edge routers Availability of forwarding/routing table for tweaking by the customer It should be noted that there are some limitations with Virtual Routing: Simulation is of a router, not ‘gateway’ device such as an ADSL Model (No support for NAT/PAT, WAN IP address, etc.) Each edge virtual router can have only one physical port connected to it Virtual Routers – Expect problematic IP devices With all technologies a number of IP devices have incomplete or problematic implementations of TCP/IP stacks. Whilst we have taken all efforts to ensure that our Virtual Routers are compatible with all known implementations you may experience problematic operations around DHCP, especially if starting and stopping network maps. As the practice with network vendors, if you experience such a problem please contact JAR Technologies were we will attempt to diagnose and patch the issue. Page | 116 JAR:Emulate Installation and User Manual 16.16. July 2013 Basic Virtual Routing (BVR) Introduction As this type of Routing suggest it offers basic operation which is usually enough for a simple 2 port WAN emulation. Physical Port 1 is connected to one BVR, whilst physical Port 2 is connected to a second BVR. The two BVR’s are then interconnected and impairments placed between the WAN links. We recommend you use the “Routed Mode Wizard” for creating sample BVR Network maps, please see the “creating network maps” section for more information. Page | 117 JAR:Emulate Installation and User Manual 16.17. July 2013 Edge Virtual Routing (EVR) Introduction To create a new EVR network map please right click on the “Device/Map Navigation” window and select “New Routed Mode > Create Blank Routed Map” (see the “creating network maps” for more information) Creating your EVR’s In the tool box you will see the “Edge Virtual Routers”, please drag one of these onto your network map along with 2 x “Virtual Router WAN Points”. Please select one of the WAN Points and toggle it as “In”: As you can see from the above screenshot the Virtual Router is requiring “Physical Ports” and “WAN Input / Output” points. Let’s go ahead and link up the “WAN Link In” to the EVR – click on the “WAN Link In” and “Create Link”, finally click on the EVR and the link should be created. Now right click on the EVR and select “Create WAN output Link” and click on the “WAN Link Out” At this point we have connected the EVR to the WAN points, this allow the virtual router to know which connections and impairments are on the WAN side. Page | 118 JAR:Emulate Installation and User Manual July 2013 Now we want to connect the physical side so the EVR can communicate with your actual hardware devices, add “Port 1 – Incoming” and “Port 1 – Outgoing”, you should see: We link up the physical side in a similar way as to the WAN side; right click on the “Port 1 – Incoming” and select “Create Link”, then click on the EVR. Likewise right click on the EVR and select “Create Physical Output Link” and select the “Port 1 – Outgoing”. After these operations you should have a fully connected EVR. Go ahead and create second EVR but this time use Port 2 instead of Port 1, you should have the following network map: Configuring your EVR’s Each EVR has its own settings and forwarding table, its critical important to configure this information correctly or you could create circular packet loops or cause an invalid operation. EVR – Understanding the settings The Virtual Router must be configured correctly for normal operation. It is recommended you set the Virtual Router select certain functions (such as the forwarding table) automatically. Modifying these settings should only be performed with expert knowledge or active from JAR Technologies. Failure will result in incorrect operation of the virtual routers, or entire network map. Page | 119 JAR:Emulate Installation and User Manual July 2013 Understanding the EVR Settings Router IP address – The physical IP address presented to all physically connected computers or IP devices The routers subnet mask, this mask is used to generate the DHCP range (if enabled) DHCP Options (see below for more information) Forwarding Table (see below for more information) EVR Settings - Physical Port Settings Every EVR is connected to a physical port and therefore must present itself as an IP addressable device on the physical network. Under these settings you can see the following options: Router IP Address – The IP address the virtual router will “exist” at, all computers and IP devices connected to the physical port will talk to this IP address to access the EVR. Router Subnet Mask – This subnet mask allows the Router to generate an acceptable DHCP range (if enabled). Changing this value will automatically update the DHCP Start and End Range. MAC Address – Allows you to choose an automatic or manually MAC address. DHCP Settings – If enabled the router will accept DHCP requests and assign IP addresses from the available DHCP pool. If DHCP is disabled the router will accept IP traffic from any valid static IP address (within the subnet range). Additional options here allow you to tweak how long leases exist for and any broadcast address. Note: if DISABLED you must set your IP devices gateway to match the “Router IP Address” otherwise the IP device will not know the gateway to use. Forwarding Table – It is highly recommended you leave this on “automatic”. The Forwarding (or routing table) is used to route packets between the available physical interfaces. In the above example the router has two WAN points for network 52.72.5.x and 10.50.1.x – whilst all physical traffic is bound to the 192.168.1.x IP range. Page | 120 JAR:Emulate Installation and User Manual July 2013 Configuring our example EVR’s Right click on the first EVR (located on the left side of the network map), change its IP to “10.50.1.2”. You will notice the DHCP Range will automatically change to show: Notice the selection of “Auto-name”, this allows the EVR IP range to be clearly visible on the network map. The DHCP range now reflects the IP address You will also note that the forwarding table now has a physical interface entry for the 10.50.1.x network. We will leave the second EVR with its default settings (192.168.1.x Range). Connecting up the EVR’s (creating the WAN) Simply right click on the “WAN Link Out” tool and select “Create Link”, and then select the remote “WAN Link In” tool. You have created your first EVR network map with a non-impaired WAN, you should see the following network map: Forward Table Changes Now that you have connected the two EVR’s together the forwarding tables for both EVR’s will change to show the WAN links (assuming you left the forward table on “automatic”). If you now view the forward table you will see the “WAN1” link to the remote EVR. Page | 121 JAR:Emulate Installation and User Manual July 2013 Adding WAN impairments The process for adding WAN impairments is the same as normal bridged mode; simply add the impairments you wish to the WAN links, a quick example is shown below: In the above screenshot you can see the simulation of a simple ADSL connection with 20Mb/s down rate and 1Mb/s up rate (from the 192.168.1.x network). Page | 122 JAR:Emulate Installation and User Manual July 2013 EVR - Real-time information When an edge virtual router is operating it will present information to the user for diagnosis and information purposes. DHCP Leases When operating the EVR will show a “DHCP Leases” button which can be clicked to show DHCP lease information, when this information is available the EVR will look like: The information presented includes the DHCP assigned IP addresses, the devices MAC address along with the lease duration and expiry time. DHCP and stopping Virtual Routing Maps Due to the nature of the JAR:Emulate WAN emulator you may start and stop network maps at will. If you stop a network map the EVR are lost; meaning that the routed traffic stops flowing and you experience an outage. In addition to this outage the EVR lose their DHCP tables meaning that all DHCP leases are lost (but often “held” by the physical IP device until the lease is up). This outage and lose of DHCP leases cannot be prevented (you are removing the Virtual Routers so not routing can take place). In order to counter the problem of missing DHCP leases each Virtual Router will not attempt to issue new DHCP assigned IP addresses to any connected machines or IP devices, instead it will accept packets from any host on the DHCP range and only issue new DHCP addresses if an IP device specifically asks for one. This means in practice after a network map is stopped and started the flow of IP traffic will commence as it did when the DHCP leases were first issued. The net result is that the DHCP leases window shows ONLY the DHCP addresses that have been assigned during this active session, if you stop and start the network map you will lose this information. Page | 123 JAR:Emulate Installation and User Manual July 2013 Run-time stats By hovering you mouse over the small “gear icon” you will see a number of real-time stats, these can be used to understand the flow of packets in your network map and troubleshoot any invalid configurations. The following statistical information is presented for each EVR: Packets Received – The total number of packets received on all interfaces regardless of origin. Physical Layer Packet Count – The number of packet received by the physical interface. This allows you to see if the computers or IP devices connected to the physical port are communicating correctly with the EVR. WAN Layer Packet Count – The total number of packets received on all WAN links into the EVR, this shows that the forwarding tables on any connected EVR’s are correct. DHCP Requests – The total number of DHCP requests that have been received by the EVR DHCP Leases – The total number of valid DHCP requests that have resulted in a lease being granted to a physical IP device. ARP Requests – The number of ARP requests received by this virtual router. Unroutable – The total number of packets that were received (on WAN or Physical Interface) that were not routable because no entry existed in the forwarding table. Unroutable counts and background traffic generation If you have a background traffic generation on your network map you will notice the unroutable packet count increasing in line with the traffic generation. This is simply a byproduct of the traffic generators and should be ignored. Page | 124 JAR:Emulate Installation and User Manual July 2013 17. Reporting - TAP Devices Test Access Points (TAP) devices are automatically added in the Design pane when a connection is made between ports or impairments. The TAP device icon is shown below: TAP devices provide the user with the ability to add reporting/analysis anywhere on an emulation map. The version of JAR:Emulate WAN emulator that has been shipped to you includes two reporting tool (statistical real time graphs and traffic capture to Wireshark files), which are described below. The reporting functions which are available to you will be displayed when a right click is performed on any TAP device on an emulation map, as shown below: Right click on any TAP device icon The list of available reporting tools will be displayed. Please note, the list shown here is for illustrative purposes only – your JAR:Emulate configuration may alter this view 17.6. Statistical Graph TAP The Statistical graphs show real time information in the form of a graph. It uses metrics to extract certain information from the flow of packets. Your available metrics are as follows: Packet rate (packets passing the TAP point every second) Bandwidth Adding a statistical graph to your emulation map Right click on the required TAP point, and select “Add Statistical Graph Tap”, the TAP device should appear below the TAP point as indicated in the following image: Page | 125 JAR:Emulate Installation and User Manual July 2013 The default stats graph added to the Design pane is the packets per second graph. This can be changed to the bandwidth graph by right clicking on the green icon and selecting ‘settings’. Statistical graph settings window The statistical graph settings window shows your available metrics. Select which type of metric you require by clicking on it. A list of your available metrics is shown here. Click on the metric will change the settings panel. Setting panel, this changes per metric Time Domain, this sets how the X (bottom) axis is labelled Packets per second metric settings Refresh Rate – This is the number of times per second the graph’s details are updated. Chart Scale – This allows you to provide a scaling for the chart, auto scaling is recommended. Bandwidth metric settings Chart Scale – This allows you to set the scale of the bandwidth measurements Page | 126 JAR:Emulate Installation and User Manual July 2013 Include Framing – This option ensures that the bits before and after the physical packet (i.e. frame crc, inter-packet spacing, preamble,etc.) are included. This allows viewing the correct full-wire rate. Please Note: For low bandwidth applications it is possible to set the scale so low that it is not possible to see any values (values indicated as 0.00). Running your emulation map When your emulation map is run the stats graph automatically appear at the bottom of the screen. If more than one stats graph is available on your emulation map then a tab will be shown that allows you to actively alter the view. The following screen-shot shows an emulation map with 3 stats graphs. It highlights the important features associated with the stats graph feature. “Eye” Icon is used to show which stats graph is being viewed. Stats Graph (see below for more information) Tab’s to control which stats graph is being viewed. Current graph is in focus. Stats Graph Tools The statistics graph has a number of buttons and tools that allow you to get more information from your graphs. They are detailed below: Page | 127 JAR:Emulate Installation and User Manual Copy values to clipboard Play / Pause Button Show peak Show average Export values to CSV file July 2013 Enable / Disable smart labelling Visible time period Please note that when exporting to a .csv file, the user defined filename must be suffixed with ‘.csv’. 17.7. Root Cause Analysis - Wireshark Capture JAR:Emulate WAN emulators provide the capability to capture Wireshark files (with extension .pcap) for detailed packet analysis and root cause analysis. Wireshark is an open source tool employed by moderate/advanced technical users to analyse data packets sent over a network. The JAR:Emulate WAN emulator provides the functionality to save captured traffic as WireShark .PCAP files. These PCAP files can be loaded into WireShark and provide advanced ‘deep dive’ analysis on packets that have been impaired by WAN conditions, thus providing the opportunity for root cause identification. Wireshark is licensed under the GNU license agreement, which JAR Technologies adheres to. JAR Technologies is not responsible for the supply, amendment, use or operation of the Wireshark application or its files. For information on how to install, use and analyse Wireshark file captures, please refer to http://www.wireshark.org for more information. Information on the GNU General Public License is available here: http://www.gnu.org/licenses/gpl.html The current officially supported WireShark version is V1.6.2 (October 2011), however all versions of WireShark should be compatible with the GUI. Using Wireshark Page | 128 JAR:Emulate Installation and User Manual July 2013 Please ensure you have downloaded the latest officially supported version of Wireshark to your Windows computer running the JAR:Emulate GUI. On the design pane, right click any TAP device on an emulation map, and select ‘Add Wireshark Tap’, as shown below: The Wireshark TAP device will be added, denoted by this icon : When an emulation is run with a Wireshark TAP device on the link, the Wireshark application will automatically load and start to capture packets as they traverse the point on the link where the Wireshark was placed. If at any time you close the live WireShark capture, you may reopen the connection by clicking the green ‘reopen’ arrow present on the WireShark TAP Device. Please note: if you plan to capture traffic using a wireshark device (as opposed to a traffic capture TAP device) it is recommended that the Wireshark programme is launched before commencing emulations. This significantly reduces the time required for JAR:Emulate to initiate the sending of traffic to the Wireshark capture file. Performance note: There is a maximum throughput limit on the amount of traffic that can be received live from the network and sent to your WireShark client. After this is exceeded you will be presented with a warning under the WireShark client reading “Warning Overloaded”. If this occurs use a ‘traffic capture’ TAP device instead to capture the packets at full-wire rate. Please see the following section for more information. Page | 129 JAR:Emulate Installation and User Manual July 2013 17.8. Traffic Capture and Replay JAR:Emulate WAN emulator provides the ability to capture impaired/unimpaired network traffic that traverses it for review in Wireshark. This differs from the Wireshark TAP device in that the captured traffic is saved to the JAR:Emulate hardware for download at a later point. JAR:Emulate WAN emulator can capture and store up to 6Gb of network traffic at any one time (the total capacity depends on the model being used). This storage (on the JAR:Emulate hardware) is designed to be a temporary holding place for captured traffic, which should be subsequently saved onto local hard drives. If captured traffic files are not downloaded to a separate hard drive, the ability to capture traffic will be impaired once all available JAR:Emulate memory is used by existing capture files. Capturing network traffic To capture traffic, please right click on any TAP point on the Design pane, and select ‘Add Traffic Capture’. This will add a traffic capture tap device to your emulation map, as shown below: Right click on the traffic capture object, and chose ‘settings’. This is the title that will identify the file for replay purposes If you do not specify a new filename for each recording, decide if the previous recording with the same filename should be overwritten Enter descriptive details if required Set the file’s maximum capture size Page | 130 JAR:Emulate Installation and User Manual July 2013 Multiple traffic capturing JAR:Emulate allows users to add multiple ‘traffic capture’ TAP points to an emulation map, and therefore record traffic both bi-directionally and before or after impairments. However, it is important to note that when using more than one traffic capture device on a single emulation map, each traffic capture device must be assigned a unique filename. This allows the system to differentiate between the traffic capture files – if the default filename is used, or all files named the same, only one file will be captured. The GUI may also report an onscreen error – if this occurs, edit the names of the traffic capture files to make them unique, and restart the emulation. Stored traffic Captured traffic files are stored in memory on the JAR:Emulate hardware and accessed through the ‘captured traffic files’ option in the map/device navigation bar. Each traffic capture file is specific to the JAR:Emulate emulator hardware on which it was captured. You can access stored files as shown below: Access previously captured files by clicking on this link in the map/device navigation bar- if you have more than one JAR:Emulate hardware device, ensure you are selecting the link under the correct hardware The following screen will be displayed – please note that the files shown below are for illustrative purposes only (upon first use, there will be no previously captured traffic files): Page | 131 JAR:Emulate Installation and User Manual July 2013 The estimated total memory size that can be used to capture traffic files, alongside how many files are currently stored Status bar showing the estimated total memory size used and remaining List showing previously captured files, their filenames, size, % of total file size used, and total file size that was set for each capture Delete file: the selected file will be removed permanently from the system Download file: downloads the selected file to the a location specified on a local hard drive, for analysis or long term storage Upload a file: allows previously captured files that have been downloaded to a hard drive to be uploaded and subsequently replayed (if this feature has been licensed in your version of JAR:Emulate). Downloaded files are stored as with .pcap file extensions, which allows them to be opened and analysed via Wireshark. Users must download and install Wireshark in order to analyse .pcap files produced by JAR:Emulate WAN emulator. Replaying stored traffic The user can replay stored traffic by dragging and dropping the following icon onto the main design pane (from the network toolbar): This will display the following icon: Page | 132 JAR:Emulate Installation and User Manual July 2013 The user should right click to open the settings of this tool, and select the file to be replayed. Once the emulation is started, the traffic replay tool will send the captured packets across the selected link, and allow the user to view if resolutions to application performance issues (for example) have been resolved under the exact same network conditions on first they were identified. The traffic replay tool can optionally loop the recorded traffic. Page | 133 JAR:Emulate Installation and User Manual July 2013 Wizards JAR:Emulate WAN emulator is intentionally easy to set up and use. To add to this benefit, it provides wizards that can pre-populate network configurations for users without the need to draw the emulation maps from a blank canvas. These can either be supplied as standard or tailored to individual customer requirements. These wizards are located on the left of the design pane, shown below: Common wizards provided include wireless, satellite and filtering map creation wizards, which guide the user through relevant questions and selections. These are then confirmed and the desired emulation map is generated. Page | 134 JAR:Emulate Installation and User Manual July 2013 18. Auto Impairment Generation of Live Network Conditions JAR:Emulate provides the capability to pre-populate an emulation with the conditions found on live networks, even if those conditions are unknown to the user. Traffic can be recorded (either using the emulator hardware or from a remote location), imported into the user interface and used to auto generate emulations based on the impairments found on that network. This facility is provided via the ‘Wireshark Live Conditions wizard’, as shown below: 2) Select the ‘Wireshark Live Conditions’ wizard 1) Hoover over the wizards toolbar to extend this window onto screen Capturing live network conditions In order to capture live network conditions, JAR:Emulate WAN emulator uses ping tests to assess the following: Latency Jitter Packet loss Page | 135 JAR:Emulate Installation and User Manual July 2013 in both directions on the link. The ping test should remotely target the machine(s) on the far end of the link to be emulated. Wireshark must be capturing during this time, in order for the necessary measurements to be recorded. In order to capture live traffic, please open Wireshark and ensure you are running it as ‘administrator’. This can be achieved by right clicking on the wireshark application icon, and selecting ‘Run as Administrator’). Once Wireshark has opened, please select ‘Capture’ on the top menu, and select ‘Interfaces’ as shown below: Select the network interface that is to be used to send/receive the ping messages, and then press ‘start’. The Wireshark application will now be capturing all traffic to and from that interface, so the user should now commence their ping test using a terminal window in Linux or a DOS dialog box in Windows. Under Windows, we recommend sufficing ‘-t’ at the end of your ‘ping <ip address>’ command and allowing the ping to run for several minutes so that accurate readings can be taken and spikes/troughs do not skew the data. Once the recording is complete, move/save the WireShark file to the device running the JAR:Emulate GUI. Locate and run the ‘Wireshark live conditions’ wizard on this device and follow the onscreen instructions. An emulation map will be generated with the conditions found on the live network. END OF MANUAL Page | 136