1
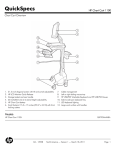
www.smar.com Specifications and information are subject to change without notice. Up-to-date address information is available on our website. web: www.smar.com/contactus.asp FY302 – AssetView IHM FY302 - ASSETVIEW HMI FY302 Home Page This manual describes the pages developed for FY302 maintenance using AssetView. The figure below shows the options from FY302 initial page. Figure 1. FY302 Home Page The following sub-sections will describe each one of the pages developed for the device maintenance. FY302 Identification Page This page displays relevant information about the positioner. The user can easily identify and specify the positioner in the physical plant. 3 User’s Manual Figure 2. Identification Page Device TAG Indicates the associated tag to the positioner in the physical plant. The tag can have up to 32 characters. DEVICE ID Indicates the identification code of the positioner. This code can have up to 32 characters. MANUFACTURER Identifies the positioner manufacturer. DEVICE TYPE Identifies the positioner type for a specific manufacturer. DEVICE REVISION Indicates the positioner revision. DD REVISION Indicates the DD revision. HARDWARE REVISION Indicates the positioner hardware revision. FIRMWARE REVISION Indicates the positioner firmware revision. DEVICE SERIAL NUMBER Indicates the positioner serial number. MAINBOARD SERIAL NUMBER Indicates the main board serial number. MODULE SERIAL NUMBER Indicates the serial number of the positioner transducer module. ORDERING CODE Indicates the positioner ordering code. Actuator ACT MAIN ID Indicates the manufacturer. ACT MODEL NUM Indicates the identification number of the actuator model. ACTUATOR SERIAL NUMBER Indicates the actuator serial number. identification number of the actuator Valve 4 VALVE MAIN ID Indicates the identification number of the valve manufacturer. VALVE MODEL NUM Indicates the identification number of the valve model. VALVE SERIAL NUMBER Indicates the valve serial number. FY302 – AssetView HMI FY302 Configuration Page There are a few parameters in the FY302 transducer block that can be used in the predictive and proactive maintenance. Some of them can be read online, while other parameters require that the process to stop or the plant control to be set to manual. It is possible to detect performance decreasing comparing the current parameters with standard values and therefore determine the predictive and proactive maintenance. The user can check the general diagnostic status in the FY302 Diagnostic Page. Operational Statistics (OEs) are data stored in the device that inform its usage, abnormal behaviors, or number of times that a specific condition occurred, such as total valve travel (odometer), total of reversals and maximum deviation limit between the valve position and the set point. Using the FY302 Configuration Page, the user can set limit conditions for the operational statistics. If a specific OE reaches the limit value, the device notifies the system and this notification is highlighted in the Diagnostic Page. Figure 3. Configuration Page 5 User’s Manual Device Operation Mode Indicates the operation mode for the device: OOS If this mode is selected, the value of Mode Block parameter will be Out of Service for the Resource, Transducer and Analog Output blocks. AUTO If this mode is selected, the value of Mode Block parameter will be Auto for the Resource, Transducer, Display and Analog Output blocks. MAN If this mode is selected, the value of Mode Block parameter will be Manual for the Analog Output block, and Auto for the Resource, Transducer and Display blocks. CAS If this mode is selected, the value of Mode Block parameter will be Cas for the Analog Output block, and Auto for the Resource, Transducer and Display blocks. Deviation Alert DEVIATION ENABLED Enables checking the difference between the current valve position and the desired set point. If this difference exceeds the dead band for more than a given time period, an alert will be generated and will remain active until this difference decreases. DEVIATION TIME This time period is in seconds. The valve must exceed the dead band during this time period before generating an alert. DEVIATION DEAD BAND Indicates the magnitude of the valve deviation value (in percentage). An alert is generated when the valve exceeds this value during a given time period. The user can check the status of this diagnostic alarm in the FY302 Diagnostic Page, in “Deviation Limit Exceeded”. Reversal Alert REVERSAL It indicates the number of times that the valve changes the direction according to the movement. The reversal total is increased when the valve changes the direction. When the total of movement exceeds the specified limit an alarm is generated. REVERSAL ENABLED Enables checking the difference between the reversal total and an established limit. An alert is generated when the reversal total exceeds this limit. If it is false the counter will not be increased (Reversal Count). REVERSAL LIMIT Indicates the reversal total limit. An alert is generated when the reversal total exceeds this limit. Enter a reversal value lower than the limit to acknowledge the alert. REVERSAL DEAD BAND Indicates the magnitude of the valve movement value (in percentage). This value is used to increase the reversal total. The user can check the general diagnostic status in the FY302 Diagnostic Page. See the following example. 6 FY302 – AssetView HMI Figure 4. Reversal Alert The user can check the alarm generated in the FY302 Diagnostic Page: Figure 5. Advanced Diagnostics Note that the variable Reversals in the Valve Totals area exceeded the limit specified. The alarm is indicated in red in the Advanced Status area. Travel Accum Alert TRAVEL (odometer) It indicates the equivalent number of full strokes. The travel is increased when the number of changes exceeds the dead band value. It is used to indicate that the diaphragm needs to be replaced and the actuator needs overhaul. TRAVEL ENABLED Enables checking the difference between the odometer and an established limit. An alert is generated when the odometer exceeds this limit. TRAVEL LIMIT Indicates the odometer value limit. An alert is generated when the odometer exceeds this limit. Enter an odometer value lower than the limit to acknowledge the alert. TRAVEL DEAD BAND Indicates the magnitude of the valve movement value (in percentage). This value is used to increase the odometer. The user can check the status of this diagnostic alarm in the FY302 Diagnostic Page, in “Travel Limit Exceeded”. 7 User’s Manual Sensor Pressure Alert An alert is generated every time the input pressure exceeds the limit. The user can check the general diagnostic status in the FY302 Diagnostic Page. HIGH LIMIT Indicates the maximum limit of the input pressure. LOW LIMIT Indicates the minimum limit of the input pressure. NOTE An alarm will be generated when the input pressure is lower than Low Limit (Supply pressure too low), and another one will be generated when it exceeds High Limit (Supply pressure too high) limit. These alarms only will be generated when the sensor pressure is installed. Travel Control The valve travel conditions will be based on the parameters below. CHARACTERIZATION TYPE Valve characterization type: LINEAR: the real position will be represented as a linear chart with the desired position. TABLE: the user can characterize the real positions according to its application. EP25, EP33, and EP50: the EP (Equal Percentage) curves provide a larger travel only for wide set point variation. QO25, QO33, and QO50: the QO (Quick Open) curves provide a larger travel for narrow set point variation. CURVE BYPASS Enables/disables the curve. CURVE LENGTH Indicates the number of points that will be used to define the curve. FINAL VALUE CUTOFF LOW If FINAL VALUE is less than this value the valve is forced to be fully closed. FINAL VALUE is the value of the desired position. FINAL VALUE CUTOFF HIGH If FINAL VALUE is greater than this value the valve is forced to be fully open. FINAL VALUE is the value of the desired position. TRAVEL LIMIT LOW Odometer lower limit. TRAVEL LIMIT HIGH Odometer upper limit. The user can check the general diagnostic status in the FY302 Diagnostic Page. In the Characterization Type parameter select the Table option, and the table will appear. To configure the points that define the characterization curve, click the link Curve X/ Curve Y, as indicated below: Figure 6. Characterization Curve 8 FY302 – AssetView HMI Type the points of the curve and click Submit to send the values to the device. Click Configuration link to return to the configuration page. Figure 7. Points Table FY302 Diagnostics Page This page displays the device status. Figure 8. Diagnostic Page 9 User’s Manual Valve Totals STROKES Indicates the number of times that the valve fully opens and closes. REVERSALS Indicates the number of times that the valve changes the direction according to the movement. The number of reversals is increased when the valve changes the direction and the movement exceeds the dead band. TRAVEL (odometer) Indicates the equivalent number of full strokes. The travel is increased when the number of changes exceeds the dead band value. It is used to indicate that the diaphragm needs to be replaced and the actuator needs overhaul. Valve Performance CLOSING TIME Indicates the time period (in seconds) that the valve spent to go from fully opened to fully closed. This time is used to indicate a problem with the actuator, diaphragm leak and problem with the pneumatic tube. OPENING TIME Indicates the time period (in seconds) that the valve spent to go from fully closed to fully opened. This time is used to indicate a problem with the actuator, diaphragm leak and problem with the pneumatic tube. Valve Position POSITION Indicates the current valve position. Temperature HIGHEST TEMPERATURE Indicates the highest temperature value measured by the positioner temperature sensor. LOWEST TEMPERATURE Indicates the lowest temperature value measured by the positioner temperature sensor. CURRENT TEMPERATURE Indicates the temperature value measured by the positioner temperature sensor. Advanced Status Shows the status of the continuous diagnostic, including the conditions of the mechanical module. 10 MAGNET NOT CENTRALIZED OR NOT DETECTED Automatic alarm: the magnet is not centralized or it was not detected. SLOW VALVE MOVEMENT OR LOW AIR SUPPLY Automatic alarm: there is a slow valve movement or low air supply. TEMPERATURE OUT OF RANGE Automatic alarm: the temperature is out of range. BASE NOT TRIMMED Automatic alarm: the base is not trimmed. OUTPUT MODULE NOT INITIALIZED OR NOT CONNECTED Automatic alarm: the output module is not connected to the circuit board or it was not initialize. DEVIATION LIMIT EXCEEDED This alarm indicates the Deviation Limit configured in the configuration page was exceeded. TRAVEL LIMIT EXCEEDED This alarm indicates the odometer counter limit configured in the configuration page was exceeded. REVERSAL LIMIT EXCEEDED This alarm indicates the Reversal Limit configured in the configuration page was exceeded. FY302 – AssetView HMI Sensor Pressure SENSOR PRESSURE IN Indicates the input pressure sensor reading. SENSOR PRESSURE OUT1 Indicates the pressure sensor reading of the output 1. SENSOR PRESSURE OUT2 Indicates the pressure sensor reading of the output 2. Sensor Pressure Status SENSOR PRESSURE STATUS Indicates the status of the input pressure sensor. Status Shows the continuous diagnostic of the device status, including the condition of function block, electronic and the mechanical module. All of the alarms are automatic, that is, the device will notify the user even if the alarm has not been configured. BLOCK CONFIGURATION ERROR Indicates error in the hardware and software components associated to the block. LINK CONFIGURATION ERROR Indicates the error in the link configuration. SIMULATE ACTIVE Indicates that the device is on simulation mode. LOCAL OVERRIDE Indicates that the device is being operated manually. DEVICE FAULT STATE SET Indicates that the device is in safe fault state condition. DEVICE NEEDS MAINTENANCE SOON Internal diagnostic according to the user configuration or device internal checking has detected that the device will need maintenance soon. INPUT FAILURE/PROCESS VARIABLE HAS BAD STATUS Condition of the process variable is BAD. OUTPUT FAILURE Indicates a failure in the output that could be due to the electronic or the mechanical module. MEMORY FAILURE Indicates an electronic failure according to the internal checking process, such as an incorrect checksum detected in the main memory. LOST STATIC DATA Indicates that the device lost data from the flash or the EEPROM memory. LOST NV DATA Indicates that the device lost data from the RAM memory. READ BACK CHECK FAILED Indicates a discrepancy in the reading of return value. This may have been caused by a hardware failure. DEVICE NEEDS MAINTENANCE NOW Internal diagnostic according to the user configuration or device internal checking has detected that the device needs maintenance. POWER UP Indicates that the device has finished the initial operation procedure. OUT-OF-SERVICE Indicates that the function block is out of service. GENERAL ERROR An error has occurred and could not be classified as one of the errors below. CALIBRATION ERROR An error occurred during the device calibration or a calibration error has been detected during the device operation. CONFIGURATION ERROR An error occurred during the device configuration or a configuration error has been detected while operating the device. 11 User’s Manual ELECTRONIC FAILURE An electronic component has failed. MECHANICAL FAILURE A mechanical component has failed. I/O FAILURE I/O failure has occurred. DATA INTEGRITY ERROR Indicates that data stored in the system may be no longer valid, because the checksum of the data in the RAM memory has failed when compared to the data in the non-volatile memory. SOFTWARE ERROR The software has detected an error that may have been caused by a deviation to a wrong routine, an interruption, a lost pointer, etc. ALGORITHM ERROR The algorithm used in the transducer block generated an error, such as, a data overflow. FY302 Graphics Page This page allows the user to configure the FY302 graphs. Select the type of the graph, type the delay time to get the desired position (Delay) and click New Graph. Figure 9. Graphics Page Remember that this procedure must be executed when the process stops or the plant control is set to manual. Movements of opening and closing may interfere in the process. AssetView will set the Resource and Transducer Mode blocks to Auto to draw the chart. The mode block values will be restored at the end of this process. CHARACTERIZATION This chart will show the behavior of the current valve position compared to the desired value. AssetView will generate the desired value. The user can analyze the behavior of the valve response, such as stuck and stress. It will be easier to set the positioner parameters in the Calibration page, such as the Servo_Gain and the Servo_Reset, according to the application tuning and the positioner dynamic response. This chart helps the preventive and predictive maintenance because the user can save the curves and compare them later. Performance results are related to the chosen characterization type, Servo gains and Servo reset parameters. 12 FY302 – AssetView HMI Remember that the response curve will depend on the response inertia of the valve analyzed. For slow valves, the time configured must be longer because it takes longer for the valve to reach the desired position. See the example below: Figure 10. Characterization Graph Click Compare to compare characterization charts. On the Type Graph menu, select Characterization. Select the moment for the valve position VP1 and another moment for the valve position VP2. Click Compare to conclude. See the example below: Figure 11. Comparing Graphs STEP RESPONSE: This chart will show the behavior of the current valve position and the desired position related to the time. It is an easier way to check the tuning between the servo PID and the positioner. The user can analyze the behavior of the valve response, such as stuck and stress. It helps the preventive and predictive maintenance because the user can save the curves and compare them later. 13 User’s Manual Performance results are related to the chosen characterization type, Servo gains, Servo reset parameters and the valve inertia (slow or fast valve response). After configuring the Delay, set the value for the Setpoint and click Write to start. This chart allows the user observe it ranging in time during the analysis. Figure 12. Step Response Graph Click Compare to compare the valve response charts. On the Type Graph menu, select Step Response. Select the moment to be compared and click Compare to conclude. See the example below: Figure 13. Comparing Graphs VALVE SIGNATURE This chart will show the behavior of the position related to the output pressure. The desired value will be generated by AssetView. This chart allows the user to analyze the behavior of the valve response according to the air pressure. For example, the user can save the chart during the installation or commissioning, and then, compare the current chart with the one saved before. It will be possible to check if more pressure is necessary to establish the same position. If it is true, it means that there is a mechanical stuck. 14 FY302 – AssetView HMI NOTE The chart Valve Signature will be plotted only if the FY302 has the pressure sensor. Performance results are related to the chosen characterization type, Servo gains, Servo reset parameters and input pressure. See the example below: Figure 14. Valve Signature Graph Click Compare to compare the valve response charts. On the Type Graph menu, select Valve Signature. Select the moment to be compared and click Compare to conclude. See the example below: Figure 15. Comparing Graphs HYSTERESIS: This chart will show the hysteresis behavior of the valve when moving the valve from fully closed to fully opened, and vice-versa. It lets the user analyze the behavior of the valve response, such as stuck and stress. It helps the preventive and predictive maintenance because the user can save the curves and compare them later. Performance results are related to the chosen characterization type, Servo gains and Servo reset parameters. 15 User’s Manual Remember that the response curve will depend on the response inertia of the valve analyzed. For slow valves the time configured must be longer because it takes longer for the valve to reach the desired position. Figure 16. Hysteresis Graph Click Compare to compare the valve response. On the Type Graph menu, select Hysteresis. Select the moments to be compared, and click Compare to conclude. See the example below: Figure 17. Comparing Graphs TRAVEL DEVIATION This chart will show the behavior of the error accumulated in the process (between the current valve position and the desired position) related to the time. It allows the user analyze the behavior of the valve response, such as stuck and stress. It helps the preventive and predictive maintenance because the user can save the curves and compare them later. The value that appears in the histogram is the arithmetic average of 10 acquisitions. In stuck conditions the error accumulated tends to increase because the instantaneous error increases. This fact can be verified since the servo PID action increases. 16 FY302 – AssetView HMI Figure 18. Travel Deviation Graph AS FOUND AS LEFT This chart allows the user to store the device status before executing a calibration procedure. The user can save the chart of the set point related to the Primary Value. After executing the calibration, generate the chart again with the same characteristics to analyze the deviation. Figure 19. As Found As Left Graph Select the Deviation option to show the error values for each point written in the device. Click Compare to compare the valve response. On the Type Graph menu, select As Found As Left. Select the moments to be compared, and click Compare to conclude. See the following example: 17 User’s Manual Figure 20. Comparing Graphs 18 FY302 – AssetView HMI FY302 Calibration Page This page displays configuration data used in the calibration procedures. Figure 21. Calibration Page Device Operation Mode Indicates the operation mode for the device: OOS If this mode is selected, the value of the Mode Block parameter will be Out of Service for the Resource, Transducer, and Analog Output blocks. AUTO If this mode is selected, the value of the Mode Block parameter will be Auto for the Resource, Transducer, Display, and Analog Output blocks. MAN If this mode is selected, the value of the Mode Block parameter will be Manual for the Analog Output block, and Auto for the Resource, Transducer, and Display blocks. CAS If this mode is selected, the value of the parameter Mode Block will be Cas for the Analog Output block, and Auto for the Resource, Transducer and Display blocks. 19 User’s Manual Valve Settings TYPE The user configures the valve type: linear or rotary. FAULT STATE Safe fault value (in percentage). FAULT STATE TIME Indicates the time before the valve changes to the safe fault value (in seconds). AIR TO Air condition to open or close. VALVE ACT Action type: direct or reverse. The options are: Invert, SP tracks PV if Man, SP tracks PV if LO, SP tracks RCas or Cas if LO or Man, Increase to close, Faultstate Type, Faultstate restart, Target to Man, PV for BKCal_Out, Low Cutoff. Tuning Settings RATE DOWN Configures the set point step-down rate (in percentage) related to the time. RATE UP Configures the set point step-up rate (in percentage) related to the time. KP Servo PID proportional gain. TR Servo PID integral time. SERVO PID DEAD BAND Set the Servo PID dead band. It should not be changed by the user. SERVO PID BYPASS Enables/disables the Servo PID. BACKUP RESTORE Enables save and restore the calibration, setup and important configuration data. It is recommended to run the backup process with the option Sensor Data Backup after the auto-calibration process (setup). Calibration Information MIN SPAN Indicates the smallest difference allowed between the calibration upper position and the calibration lower position. UNIT Indicates the calibration unit, always in percentage. METHOD Indicates the calibration method. When leaving the factory, the device is calibrated according to the manufacturer criteria. If the user calibrates the positioner, it will indicate that the user executed the calibration. LOCATION Indicates the location of calibration, such as a laboratory, area 1, etc. DATE Indicates the date of the executed calibration. WHO Indicates the person responsible for the executed calibration. Position Scale 20 EU 0% Indicates the lower limit for the input scale of the position variation. EU100% Indicates the upper limit for the input scale of the position variation. UNITS INDEX Indicates the engineering unit: percentage (%), radian (rad) or millimeter (mm). FY302 – AssetView HMI Temperature Calibration CAL TEMPERATURE Indicates the last temperature calibration value of the positioner temperature sensor. The user must type the reference temperature º and the device will be calibrated with this value. Note the - 40 to 85 C limits when executing the calibration. SECONDARY VALUE UNIT Indicates the unit related to the temperature. Advanced Setup TSO FINAL VALUE CUTOFF LOW If FINAL VALUE is less than this value the valve is forced to be fully closed. FINAL VALUE is the value of the desired position. FINAL VALUE CUTOFF HIGH If FINAL VALUE is greater than this value the valve is forced to be fully opened. FINAL VALUE is the value of the desired position. Set Point Limits SP LO LIMIT Set point lower limit of the AO Block. SP HI LIMIT Set point upper limit of the AO Block. Flow Char CHARACTERIZATION TYPE Valve characterization type: LINEAR: the real position will be represented as a linear chart with the desired position. TABLE: the user can characterize the real positions according to the application. EP25, EP33, and EP50: the EP (Equal Percentage) curves provide a larger travel only for wide set point variation. QO25, QO33, and QO50: the QO (Quick Open) curves provide a larger travel for narrow set point variation. CURVE BYPASS Enables/disables the curve. CURVE LENGTH Indicates the number of points that will be used to define the curve. After selecting the table, the user must type the input and output values in percentage. To configure the points that define the characterization curve, click the link Curve X/ Curve Y, as indicated in the following figure. Figure 22. Configuring the Characterization Curve The table with the points will open: 21 User’s Manual Figure 23. Points Table Type the curve points and click Submit to send the values to the device. Click Calibration link to return to the calibration page. User Calibration NOTE Whenever the positioner is installed to a valve, it is necessary to execute the auto-calibration procedure (setup) before connecting it to the process. The setup procedure will move the valve searching for the physical limits of the position. The user must install the positioner when the valve is isolated from the process and air is directly applied to it using a manual regulator. Match the arrow of the magnetic part with the arrow of the positioner transducer module when the valve is at 50.0%. This procedure is crucial for the properly operation of the positioner. For further details consult the FY302 manual. The setup procedure is necessary even before the lower or upper position calibration. LOWER POS CALIBRATION POINT This method is used when the user wants to calibrate the 0 and the 100% limits differently from the physical limits set during the setup process. Use this procedure in applications that involve Splitter Range conditions. When this method is selected, a message box appears warning the user that this procedure must be executed when the process stops or the plant control is set at manual. Opening and closing movements may interfere in the process. 22 FY302 – AssetView HMI Figure 24. Configuring the Mode Block Click OK and complete the information about the calibration, indicating the location of the calibration, the date and the person responsible for the calibration: Figure 25. Calibration Data The valve will move to the lower position. The message shown in the figure below appears. Wait until the valve stabilizes the position, and click Ok to continue. Figure 26. Stabilizing the Position Check the current physical position of the lower limit, which is indicated in the actuator scale, and type this value in the New Position text field: Figure 27. Valve New Position Suppose that the value read in the actuator scale is 10.0%. After the user types this value and click Ok, the positioner will correct the lower position (set at around 0%). Negative values for the position will execute the correction in the opposite direction of the movement. 23 User’s Manual Verify the scale and indicate if the correction was successful or the calibration procedure must be executed again. Figure 28. Checking the Calibration If the correction was successful, click No. Otherwise, if the calibration is not suitable, click Yes. The user can execute the correction. It is possible to “lie” to the positioner about the value read from the actuator scale. In this way, the positioner will be calibrated lower, according to the user necessities. It is possible to save the calibration in the EEPROM memory of the positioner transducer module, which is recommended. Click Yes to save the calibration data. Figure 29. Saving Calibration Data UPPER POS CALIBRATION POINT This method is similar to the Lower Pos Calibration procedure described above. It is used when the user wants to calibrate the 0 and the 100% limits differently from the physical limits set during the setup process. Use this procedure in applications that involve Splitter Range conditions. When this method is selected, a message box appears warning the user that this procedure must be executed when the process stops or the plant control is set at manual. Opening and closing movements may interfere in the process. Figure 30. Configuring the Mode Block Click OK and complete the information about the calibration, indicating the location of the calibration, the date and the person responsible for the calibration: 24 FY302 – AssetView HMI Figure 31. Calibration Data The valve will move to the upper position. The message shown in the following figure appears. The user must wait until the valve stabilizes the position and click Ok to continue. Figure 32. Stabilizing the Position Check the current physical position of the upper limit, which is indicated in the actuator scale, and type this value in the New Position text field: Figure 33. Valve New Position Suppose the value read in the actuator scale is 90.0%. After the user types this value and click Ok, the positioner will correct the upper position (set at around 100%). Negative values for the position will execute the correction in the opposite direction of the movement. Verify the scale and indicate if the correction was successful or the calibration procedure must be executed again. Figure 34. Checking the Calibration If the correction was successful, click No. Otherwise, if the calibration is not suitable, click Yes. The user can execute the correction. It is possible to “lie” to the positioner about the value read from the actuator scale. In this way, the positioner will be calibrated higher, according to the user necessities. 25 User’s Manual It is possible to save the calibration in the EEPROM memory of the positioner transducer module, which is recommended. Click Yes to save the calibration data. Figure 35. Saving Calibration Data SETUP When this method is selected, a message box appears warning the user that this procedure must be executed when the process stops or the plant control is set at manual. Opening and closing movements may interfere in the process. Please refer to the FY302 manual for setup details. Figure 36. Configuring the Mode Block Click OK and the valve will move searching for the lower and upper physical position. Depending on the valve inertia this process may take a few minutes. Figure 37. Valve Movement The progress bar indicates the procedure progress. The user can also verify the setup status. A message box will appear indicating that the Setup process is completed. 26 FY302 – AssetView HMI Figure 38. Concluding the Calibration At the end of the setup, it will be possible to save the data: Figure 39. Saving Calibration Data SETUP REPORT This option provides an analysis of the data stored during the last Setup process. The data has information about the HALL and the PIEZO sensors. It is useful to report a problem during the Setup process. There are cases where the Setup process is executed and the valve is stuck or the input pressure is too low to allow the valve movement. In this case, the process will be finalized with “Time Out” and the lower and upper values of the HALL sensor will be practically the same, which indicates no movement. Another example is the voltage condition of the PIEZO sensor that must be between 30 and 60V in a stable condition and a fixed position. If the voltage is out of this range the mechanical calibration will be necessary at the PIEZO sensor. Figure 40. Setup Report Click Ok. The figure below shows the Setup Report options: Figure 41. Report Data 27 User’s Manual Pot DC: VALUE The constant DC value for piezo sensor. Digital Hall Value: VALUE Indicates the current value of the HALL sensor according to the current position. HIGHEST CAL HALL VALUE Upper value of the HALL sensor calibrated during the Setup process or Upper Pos Calibration process. LOWEST CAL HALL VALUE Lower value of the HALL sensor calibrated during the Setup process or Lower Pos Calibration process. DA Output Value: VALUE Indicates the current value of the D/A converter. HIGHEST CAL DA VALUE Upper value of the D/A converter calibrated during the Setup process or Upper Pos Calibration process. LOWEST CAL DA VALUE Lower value of the D/A converter calibrated during the Setup process or Lower Pos Calibration process. STATUS Status of the D/A converter value. Piezo: VALUE Indicates the value of the PIEZO sensor voltage. STATUS Indicates the status of the PIEZO sensor voltage. PRESSURE SENSOR CALIBRATION: Selecting this method the user can calibrate the pressure sensors, when they are installed in the positioner. These installations depend on the positioner version. When this method is selected, a message box appears warning the user that this procedure must be executed when the process stops or the plant control is set at manual. Opening and closing movements may interfere in the process. Figure 42. Checking the Sensor Pressure In the same window is possible select the sensor that will be calibrated and the respective calibration (upper or lower). Click Next to continue. 28 FY302 – AssetView HMI A message will appear indicating the pressure values. The selected pressure and calibration will be shown according to measured pressure. Click Next to confirm that the pressure and calibration are correct. Otherwise, do the corrections, click Submit, and then, Next. Figure 43. Sensor Calibration Data It is possible to save the calibration in the EEPROM memory of the sensor module, just select the option. Click Next and a window will appear to complete the information about the calibration location, the date and the person responsible for the calibration: Figure 44. Sensor Calibration Data Click Ok to finish the configuration. TEMPERATURE CALIBRATION: Selecting this method the user can calibrate the temperature sensor. Click the Temperature Calibration option and the following window will appear: 29 User’s Manual Figure 45. Calibrating the temperature Verify if the temperature is correct. Otherwise, it can be changed in the Cal Temperature field. Click Next and the following window will appear. Figure 46. Temperature Calibration Data Click OK and complete the information about the calibration, indicating the location of the calibration, the date and the person responsible for it. OVERRIDE: Selecting this method, the user can verify the desired position according to a previous Set Point. The message box will appear warning the user about the safe procedures. Figure 47. Configuring the Mode Block Click Next to start the process. Select the set point value, and click Ok. 30 FY302 – AssetView HMI Figure 48. Selecting the Set Point DYNAMIC VALUES: Selecting this method the user can verify the dynamic values of the device. Figure 49. Dynamic Values 31 User’s Manual FY302 Display Page The user can save the data shown in the device's display. Figure 50. Display Page Display Options BLOCK TAG Shows the tags list for the available instantiated blocks. PARAMETER Shows the list of available parameters to be displayed in the LCD for the selected block in the Block Tag option. SUB INDEX Indicates the sub-index of the selected parameter. MNEMONIC Indicates the mnemonic of the selected parameter in the Parameter option. INC DEC Indicates the value to be added or subtracted when acting in the parameter via local adjustment. DECIMAL POINT NUMB Indicates the number of digits after the decimal point that will be shown in the LCD. ACCESS The user can select the access type of the selected parameter: monitoring or action. ALPHA NUM Indicates if the alphanumeric field will be used for mnemonic or for value. FY302 Device View Page The user can monitor the device's data opening the Device View page. 32 FY302 – AssetView HMI Figure 51. Device View Page Diagnostic and Maintenance for Positioners With AssetView, the user can take advantage of the digital information provided by fieldbus and HART protocols. The AssetView is a powerful tool for configuring the parameters of positioners and control valves, assisting the control system management and the predictive maintenance. It provides the information about the network, online performance tests (charts and trends), positioners’ configuration/calibration, performance monitoring and online diagnostics. The user can also analyze the data stored from several periods (“as found, as left”), reconcile configurations according to the application needs, and print reports for later analysis. With AssetView, the user can act and control the process stability and its variation by viewing the entire process control, then optimizing the use of devices and assuring a continuous improvement for the system operation. The main goals are to provide a low-cost maintenance, guarantee the continuous and operational functionality of the devices with performance levels accepted by the application process control, minimize the efforts for the corrective maintenance and adapt the system for a safe and reliable operational expansion. The use of the AssetView starts during the devices commissioning and the process startup, when the user creates the database to be used as reference. The initial database is periodically compared to the current data. In this initial process, the network tuning is optimized according to the processes. The charts and trends will be used. The diagnostics online monitoring allows the user to easily detect the status of the positioners and control valves. In the Calibration Page, the user can execute the Auto Setup and calibrate the position, assuring the operation performance of the positioners and control valves. Preventive and Predictive Maintenance for Positioners The status of the positioners and valves must be followed periodically through the Diagnostics Page, for predictive maintenance purposes. The tracking can minimize maintenance costs, because the maintenance will focus on the devices that really need maintenance, and in that way it will be possible to plan and reduce the plant idle time. Configuring the process to manual or off-line, it is possible monitoring and testing the performance to evaluate the general operation condition of the positioners and control valves. 33 User’s Manual The positioners service and calibration are executed to assure the control precision and the best valves performance. These procedures are executed when the process stops or in Manual mode, and it is not necessary to remove the valves from the process. The analyses and the services suggested by the analysis results are reported right after the tests, and all of the results can be saved in the maintenance database. For example, the analysis can indicate valve stuck. After analyzing the tests, it is possible to create a time reference between the calibrations or maintenance of the positioners, actuators and valves. For the positioners, the tests may indicate the actions needed, such as gain adjustments, improvement of the air system or tuning adjustment. The frequency criterion and the analyses system are essential for the information acknowledgement, so the information stored can be useful for the proactive maintenance. After the calibration, it will be necessary to check the valve signature and verify the dynamic response. If the result is not acceptable, it will be necessary to analyze the valve/actuator and positioner/valve conditions to find the best parameterization. If the control valves tested continue to report control problems, the valve designs should also be analyzed. The design will be based on the minimum, medium and extreme conditions of the process. This phase must be conducted by an application engineer or an expert technician. The great advantage of the digital technology is the qualitative information, not only the process values, in addition to the online monitoring of the valve operation conditions and to the online analysis of the performance curves and deviations. The technology used in the FY302 positioner provides powerful diagnostic algorithms and, through AssetView, it also provides powerful resources for the predictive analyses. The positioner has characterization resources (tables, QO and QE curves), input and output pressure monitoring, temperature monitoring, travel control, strokes control, reversals control, input signals, set point, deviation, etc. With AssetView, it is possible to do online diagnostics safely, without interrupting the process. It is possible to configure the travel limits, strokes, reversals, and alarms. With these features the user can track the device condition and prevent problems in the process. The information are read and saved in the tool history for a specific configuration, helping to plan and execute the maintenance. The AssetView can be accessed from anywhere because it was built on Web technology. It is recommended to generate the charts before and after maintenance to register the status of the positioner, the valve, the actuator and the database. The database will be analyzed later to assist the user to decide the period of time needed between maintenances, delaying the following maintenance and reducing the idle time of the device. AssetView and the Proactive Maintenance Because of the resources available in the positioner and the online monitoring, it is possible to implement the proactive maintenance, determining the problems and their causes. The potential diagnostic of the field devices allows monitoring and conditions register, such as valve stress. Through the diagnostics, the plant technicians execute the proactive maintenance based on the online information, before the problem occurs, not waiting for the maintenance planned, avoiding and reducing the idle time of the plant. The proactive maintenance in the FY302 is implemented by configuring the alarms in the FY302 Configuration Page, such as Reversal, Deviation and Travel. After configuring the alarms, the user can view the alarms in the FY302 Diagnostics Page according to the previous configuration, such as Reversal Limit Exceed, Deviation Limit Exceed and Travel Limit Exceed. The alarms that were not configured by the user are also displayed in the Diagnostics Page, such as Slow Valve Movement or Low Air Supply, Base not Trimmed, Output Module not Initialized or not Connected, etc. 34