1
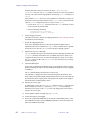
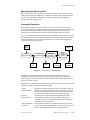
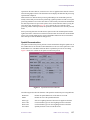
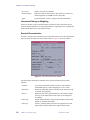
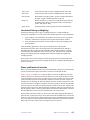
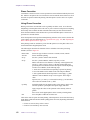
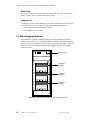
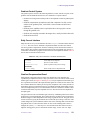
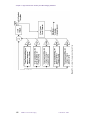
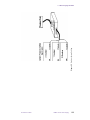
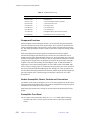
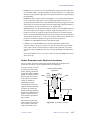
Chapter 6. CSI Data Processing
Metabolic Map
Image
Reconstruction
Image Calctool
pH Map
ROI Spectrum
Generates a metabolic map from the MVS data. The data must be
curve-fitted before metabolic maps can be generated. curve-fitting
can be done on a local or global basis.
Allows reference images to be reconstructed from raw data.
Does calculations using spectral peaks for generating metabolic
maps by using combinations of peaks and scalar values.
Calculates pH maps and frequency difference maps between
selected peaks in the spectra.
Extracts a series of spectra along a defined line or extracts an
averaged spectrum from inside a rectangular ROI.
Graphics Functions
Tools are provided to allow the creation and modification of various types of objects in the
graphics region. CSI uses the same tools as ImageBrowser: Frame, Zooming, Vertical
Scaling and Contrast, ROI, and Text Annotation. However, CSI has some differences from
ImageBrowser: CSI only implements box and line ROIs, and has added graphics functions
to perform voxel selection of spectra, peak picking, curve fitting, and interactive filtering.
The ImageBrowser standard colormap uses an 8-bit frame buffer, which can show only 256
colors or gray levels at a time on the screen. The default structure is as follows:
grayscale
64 levels
miscellaneous
12 levels
CSI uses a colormap different from the standard colormap for overlaying metabolic maps
over a reference image. Its structure is as follows:
Display Control
Use the Tools and the View command panel options to control the CSI display, including
images and spectra.
grayscale
redscale
greenscale
64 levels
27 levels
27 levels
bluescale
miscellaneous
27 levels
12 levels
Various image display parameters can be manipulated with some of the graphics tools. For
example, Vertical Scaling controls the intensity and contrast of the display, and the
Zooming tool allows magnification on individual spectra.
The View submenus in CSI provide viewing of localized FID, MVS, curve fit data sets, and
generated maps overlaid on reference images. These viewing requests are useful because
all the data is kept in global buffers, but many times the display of the data has been
overwritten. These viewing requests allow the stored data to be reviewed.
Displaying and redisplaying overlaid images on CSI data sets is useful for drawing and
getting ROI information by using the reference image.
The Colormap option in the View menu allows up to three different metabolic maps (using
red, green, blue intensity scales overlaid on a grayscale reference image) to be displayed.
One of the options in the View menu is Properties, which allows some of the display
functions, including fixed or automatic scaling of spectra, to be customized.
132
VNMR 6.1C User Guide: Imaging
01-999163-00 A0800