1
B A C K T R A C K I N G E V E N T S A S I N D I C AT O R S O F
S O F T WA R E U S A B I L I T Y P R O B L E M S
SUBMITTED TO THE DEPARTMENT OF COMPUTER SCIENCE
AND THE COMMITTEE ON GRADUATE STUDIES
OF STANFORD UNIVERSITY
IN PARTIAL FULFILLMENT OF THE REQUIREMENTS
FOR THE DEGREE OF
DOCTOR OF PHILOSOPHY
David Light Akers
October 2009
ii
Copyright © David Light Akers 2010
All Rights Reserved
iii
I certify that I have read this dissertation and that, in my opinion, it is fully adequate
in scope and quality as a dissertation for the degree of Doctor of Philosophy.
Terry A. Winograd – Principal Adviser
I certify that I have read this dissertation and that, in my opinion, it is fully adequate
in scope and quality as a dissertation for the degree of Doctor of Philosophy.
Scott R. Klemmer
I certify that I have read this dissertation and that, in my opinion, it is fully adequate
in scope and quality as a dissertation for the degree of Doctor of Philosophy.
Andreas Paepcke
Approved for the University Committee on Graduate Studies.
iv
v
Abstract
Creation-oriented software applications such as photo editors and word processors are often
difficult to test with traditional laboratory usability testing methods. A diversity of creation
goals and strategies results in a diversity of usability problems encountered by users. This
diversity in problems translates into the need for a large pool of participants in order to
identify a high percentage of the problems. However, recruiting a large pool of participants
can be prohibitively expensive, due to the high costs of traditional, expert-moderated thinkaloud usability testing.
To address this problem, this dissertation contributes a new usability evaluation method called backtracking analysis, designed to automate the process of detecting and
characterizing usability problems in creation-oriented applications. The key insight is that
interaction breakdowns in creation-oriented applications often manifest themselves in
simple backtracking operations that can be automatically logged (e.g., undo operations, erase
operations, and abort operations). Backtracking analysis synchronizes these events to
contextual data such as screen capture video, helping the evaluator to characterize specific
usability problems.
vi
The thesis of this dissertation is that backtracking events are effective indicators of
usability problems in creation-oriented applications, and can yield a scalable alternative to
traditional laboratory usability testing. The investigation of this claim consists of five parts.
First, a set of experiments demonstrate that it is possible to extract usability problem
descriptions from backtracking events without the aid of a human test-moderator, by
pairing participants during an automated retrospective interview. Second, a within-subjects
experiment with the Google SketchUp 3D modeling application shows that backtracking
analysis is comparable in effectiveness (number and severity of usability problems identified,
and percentage of false alarms) to the user-reported critical incident technique, a costeffective usability evaluation method that relies on participants to report their own
difficulties. Third, another experiment generalizes this result to the Adobe Photoshop
application. Fourth, this dissertation contributes a theory to help explain the influence of
task design on the effectiveness of backtracking analysis. Finally, to situate backtracking
analysis within usability evaluation practice, a between-subjects experiment explores the
strengths and weaknesses of backtracking analysis compared to traditional think-aloud
usability testing.
vii
Acknowledgments
I am enormously grateful for the help of my friends, family, and colleagues, without whom I
could not have completed this work. You encouraged me when I needed encouragement,
challenged me when I needed to be challenged, and even helped me to locate research
funding when I was running out (which was most of the time!)
First, thank you to the members of my PhD committee (Terry Winograd, Scott
Klemmer, Andreas Paepcke, Roy Pea, and Robin Jeffries). Your feedback has been
instrumental in shaping this dissertation.
Terry has been a terrific research advisor. In the first few months meeting him about
my research, I was intimidated. Whenever he challenged my ideas, I would yield; how could
I argue with Terry Winograd? But one day, I summoned up my courage to challenge him on
a claim. It was then that I learned that Terry loves to debate. With a glint in his eye and a
subtle smile that I hadn’t seen before, he responded by thoughtfully exploring the middleground between our views. We have gotten along famously ever since.
Robin Jeffries has been so instrumental on this project that she filled the role of a
second principal advisor (even though her affiliation with Google prevented me from
officially designating her as such). She is one of those rare people who is an expert in her
viii
field, but still finds a way to make time for all those who need her help. I cannot thank her
enough for everything she has done: advising me on how to scope the dissertation, helping
me to work out the puzzles of tricky experimental designs, and inspiring me to persevere
whenever I reached difficulties. I owe Robin a million favors – all she has to do is ask.
Scott Klemmer helped me to realize that it is important to find the right balance
between thinking and doing. Before Scott’s advice, I spent much of my time huddled away at
my desk, reading papers and trying to generate ideas for dissertation topics. Scott encouraged
me to get out of the office and run experiments, sometimes even before I had a precise idea
of what I wanted to learn from them. Scott’s suggestion to explore helped lead me to the key
idea for this dissertation – indeed, the first of the pilot studies described in Chapter 3
predates the idea for backtracking analysis!
Faculty members outside my committee have also been extremely helpful along the
way. In early 2008, Ted Selker took an interest in my work and met with me regularly over a
several month period. Those discussions were critical in helping me to choose and refine my
dissertation topic. Wendy Mackay and I met in late 2006, and our subsequent discussions
helped inspire several of the pilot studies described in Chapter 3. Stu Card was enormously
helpful in formulating the vision for the future of automated usability evaluation described
at the end of Chapter 7. Brian Wandell provided research funding and advice during the
time when I was still searching for a dissertation project. Pat Hanrahan was my advisor for
the first four years of my PhD, before I switched fields from computer graphics to humancomputer interaction. Pat taught me how to tell a compelling story –one of the most
important skills that a researcher can possess, and perhaps the most difficult to learn.
I owe tremendous thanks to Google, who provided me with two summer internships with the Google SketchUp team in Boulder, and the funding for my final year of the
PhD. Matt Simpson and Bryce Stout at Google were fantastic mentors during the
internships, and made sure that I had all of the resources I needed to succeed.
ix
I would also like to thank members of the Stanford Graphics and HCI labs. Jeff
Klingner was my office-mate for six years, and was always there for me as a friend and a
colleague. I will especially miss our spontaneous whiteboard sessions, and meandering walks
around the Stanford campus. (I still believe that Jeff has never taken the same path twice
between spots on campus.) Bjoern Hartmann helped extricate me from more than one neardisaster, including the episode in which I contracted chickenpox the day before my
dissertation proposal meeting. (He worked out the logistics that enabled me to conduct the
presentation remotely, from my home in San Francisco.) John Gerth does a stellar job
maintaining the computers and equipment in the lab (and graciously gifted me with his
favorite screwdriver, which I had been eyeing enviously throughout my time at Stanford).
And thanks to administrative assistants past and present, who have made the lab run so
smoothly: Heather Gentner, Ada Glucksman, Monica Niemiec and Melissa Rivera. Monica
deserves special recognition for putting up with hundreds of reimbursement requests for
human subjects!
My girlfriend, Amanda Moore, has been there for me through all the ups and downs
of the past year and a half. She means the world to me.
And lastly, I want to thank my parents, Marjorie and Charles. They have always
been there to read drafts of papers, to listen to me articulate research plans, and (father) to
provide hours and hours of free statistical consulting! They have never pressured me to
succeed; all they have ever wanted is for me to be happy.
x
xi
Contents
1 INTRODUCTION
1
1.1
The problem
2
1.2
Proposed Solution
3
1.2.1 Thesis statement
1.3
Research challenges
4
1.4
Summary of Findings
5
2 RELATED WORK
2.1
Usability engineering
2.2
Usability problems, breakdowns, and errors
9
9
11
2.2.1 Usability problems
2.2.2 Breakdowns
2.2.3 Errors
2.3
Usability evaluation methods
14
2.4
Automatically detecting interaction breakdowns
18
xii
2.4.1 Event-based approaches
2.4.2 Behavioral and physiological approaches
2.4.3 Self-reporting approaches
2.5
Automatically characterizing usability problems
25
2.5.1 Recording the problem
2.5.2 Collecting user commentary
2.6
Command histories and undo
28
2.6.1 Command history models
2.6.2 Undo models
2.6.3 Purposes of undo
3 THE FEASIBILITY OF BACKTRACKING ANALYSIS
3.1
Automatically detecting backtracking events
35
35
3.1.1 Instrumenting Google SketchUp
3.1.2 Instrumenting Adobe Photoshop
3.2
Automatically characterizing usability problems
37
3.2.1 Pilot study 1: Screen capture video
3.2.2 Pilot study 2: Screen capture video + concurrent think aloud
3.2.3 Pilot study 3: Screen capture video + retrospective think aloud
3.2.4 Pilot study 4: Screen capture + paired retrospective
3.2.5 Summary
4 THE EFFECTIVENESS OF BACKTRACKING ANALYSIS
45
4.1
Study motivation
46
4.2
Comparison to self-reporting: Google SketchUp
47
4.2.1 Recruitment and compensation
xiii
4.2.2 Usability testing protocol
4.2.3 Usability problem identification
4.2.4 Results
4.2.5 Discussion
4.3
Comparison to self-reporting: Adobe Photoshop
69
4.3.1 Recruitment
4.3.2 Usability testing procedure
4.3.3 Usability problem extraction
4.3.4 Results
4.3.5 Discussion
4.4
Summary
5 THE ROLE OF TASK DESIGN IN BACKTRACKING ANALYSIS
83
85
5.1
A taxonomy of backtracking purposes
85
5.2
A taxonomy of tasks
88
5.3
Dependence of backtracking behavior on task
90
5.4
Choosing a point in the task taxonomy
90
5.5
Summary
92
6 THE STRENGTHS AND WEAKNESSES OF BACKTRACKING ANALYSIS
95
6.1
Recruitment
96
6.2
Usability test procedure
98
6.3
Usability problem extraction
6.3.1 Training the usability evaluators
6.3.2 Collecting usability problem reports
6.3.3 Generating usability problem instances
101
xiv
6.3.4 Merging usability problem instances
6.3.5 Coding for problem severity
6.4
Interviews of usability evaluators
106
6.5
Results
107
6.5.1 Cost effectiveness of backtracking analysis
6.5.2 Types of problems found and missed by backtracking analysis
6.5.3 How backtracking analysis fits into practice
6.6
Discussion
122
6.7
Summary
124
7 CONCLUSIONS AND FUTURE WORK
125
7.1
Summary of findings
125
7.2
Limitations and near-term future work
128
7.2.1 Understanding the scope of backtracking analysis
7.2.2 Expanding the scope of backtracking analysis
7.3
Technology trends
133
7.3.1 Software instrumentation
7.3.2 Tools for qualitative video analysis
7.4
Concluding remarks
A USABILITY PROBLEM DATA
134
137
A.1 Google SketchUp usability problems
137
A.2 Adobe Photoshop usability problems
153
B USABILITY TESTING PROTOCOLS
195
B.1 SketchUp Study: Participant instructions
196
B.2 Photoshop Study 1: Participant instructions
202
xv
B.3 Photoshop Study 2: Participant instructions
207
B.4 Photoshop training video transcript
212
B.5 SketchUp self-reporting training video transcript
219
B.6 Photoshop self-reporting training video transcript
220
B.7 Usability problem merging procedure
222
B.8 Photoshop Study 2: Moderator instructions
223
B.9 Photoshop Study 2: Evaluator instructions
226
C INSTRUMENTATION CODE
233
C.1 Detecting backtracking events in Google SketchUp
233
C.2 Detecting backtracking events in Adobe Photoshop
235
D STATISTICAL METHODS
237
BIBLIOGRAPHY
239
xvi
xvii
Tables
TABLE 2.1.
Nielsen’s five aspects of software usability [Nielsen 1993]. The specific
usability goals for a product determine the relative importance of each
aspect.
10
TABLE 4.1.
Problem severity rating scales used in the SketchUp experiment.
59
TABLE 4.2.
A summary of the usability problem extraction process for the
SketchUp and Photoshop experiments, shown side by side for
comparison.
TABLE 4.3.
A comparison of the number of usability problems found in each
experiment.
TABLE 5.1.
83
A list of the purposes of backtracking commands, from a user’s
perspective.
TABLE 5.2.
74
Common usability testing requirements (left column), and the
implications of these requirements for choosing points in our two-
86
xviii
dimensional task space (middle column). An explanation is given in the
right column of each row.
TABLE 6.1.
92
An aggregate cost-benefit analysis comparing traditional laboratory
testing and backtracking analysis. Moderation costs for backtracking
analysis are projected for different group sizes (k). The bottom row
shows the aggregate number of hours required to discover each unique
usability problem; when k = 8, backtracking analysis is approximately
twice as efficient as traditional lab testing. Note that evaluation time
was much shorter for backtracking analysis (in part because there was
less video to watch, and in part because evaluators reported fewer
problems in this condition.)
TABLE 6.2.
109
Evaluation times and problems found, broken down by evaluator.
While Evaluator A and Evaluator B were remarkably consistent,
Evaluator C reported far fewer problems. Intriguingly, Evaluator C was
the only evaluator who spent more time and reported more problems in
the backtracking condition than in the traditional condition.
112
xix
Figures
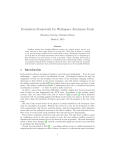
FIGURE 1.1.
Creation-oriented software can require more participants in usability
testing than suggested by the “law of diminishing returns” [Nielsen and
Landauer 1993]. Nielsen and Landauer’s curve, derived from averaging
the parameters of a mathematical model applied to data from usability
studies of 11 different applications, implies that it is generally possible
to find 75% of the usability problems by testing only 5 participants. In
contrast, a study of Google SketchUp (a creation-oriented 3D
modeling application) required over 30 participants to find an
estimated 75% of the problems.
FIGURE 2.1.
2
A simple linear command history. Each command executed is
represented as a node in an ordered list. If a user backtracks with undo
and then executes a new “branch” of commands, the previous forward
branch is discarded.
29
xx
FIGURE 2.2.
A branching command history. History is represented as a directed
acyclic graph with one root node (at left). As users retreat to early states
and explore new paths, the old paths are preserved.
FIGURE 3.1.
30
Usability testing tasks for pilot testing with SketchUp. In the “room”
task (left), we asked participants to model the room, including the
specified dimensions. In the “chair” task (middle), we asked
participants to model the chair, ensuring that its legs were the same
height and shape. In the “furniture” task (right), we asked participants
to arrange the pre-made furniture within this room.
FIGURE 3.2.
38
Command usage statistics from the first pilot study of Google
SketchUp. The horizontal bars represent the number of times each
tool was used during the study. An overlay for each bar shows the
fraction of these commands that were subsequently reversed using
undo. The Push/Pull command was undone over 50% of the time.
FIGURE 3.3.
39
The software interface used to gather retrospective commentary from
participants. Screen capture video episodes centered around each
backtracking event were displayed in the large pane on the left.
Participants could interact with the video using a VCR-like interface at
the bottom. Retrospective questions were displayed on the right side;
participants answered these questions by speaking into a microphone.
FIGURE 4.1.
41
The experimental setup for our laboratory study of Google SketchUp.
Seven laptops were identically configured with SketchUp. Participants
worked in parallel; their actions were logged, and their screens were
recorded. There were two chairs and headsets next to each computer, to
facilitate paired-participant retrospective commentary sessions.
48
xxi
FIGURE 4.2.
The two tasks used in the laboratory study of Google SketchUp. In the
“bridge” task (top, left), we asked participants to make all four legs the
same height and shape. If participants finished early, they were asked to
resize the bridge to 5 ft. x 5 ft. and make three copies of it, laying them
end to end (top, right). In the “room” task (bottom, left), we asked
participants to ensure that the room was 10 ft. high, and that the
doorway was 6 ft. 3 in. high. They did not need to model the bed; they
could insert it from the “components browser” and position it in the
room. If participants finished early, they were asked to modify the bed
to form two single beds, and add shadows (bottom, right).
FIGURE 4.3.
50
An overview of the usability problem identification process. Steps
included (1) manually discarding participants whose data were
unusable, (2) automatically extracting episodes and retrospective
commentary, (3) manually discarding unclear episodes and false alarms,
and identifying usability problem instances, and (4) merging similar
problem instances to form unique problem descriptions.
FIGURE 4.4.
A histogram of the severity rank of problems discovered in Google
SketchUp by any of the three methods. The median rank was 3.
FIGURE 4.5.
54
60
Two Venn diagrams depicting the number of usability problems
detected in Google SketchUp by each of the three methods. The left
diagram shows the results for all problems, while the right diagram
focuses on problems rated as severe. Problems in the middle of each
Venn diagram were detected by all three methods, while those on the
outsides were detected by only one method. Note that undo and erase
combined to detect more severe problems (23) than self-report (22).
61
xxii
FIGURE 4.6.
A statistical estimate of how the effectiveness of each usability
evaluation method would depend on the number of participants. The
three curves shown represent the number of problems detected by selfreport (bottom), backtracking (middle), and backtracking + self-report
(top). Each estimated curve was formed by randomly choosing smaller
groups of participants from the original set, and estimating how many
problems the smaller groups would have found, on average. We
estimate that backtracking analysis would consistently outperform selfreport at all smaller scales, and there appears to be a substantial
advantage to combining backtracking analysis with self-report.
FIGURE 4.7.
62
Median severity ratings for the SketchUp usability problems detected
by each method or combination of methods. Problems detected by only
one method have lower median severity than problems detected by
more than one method. Problems detected by all three methods have
the highest median severity, nearly twice that of the median of
problems detected by any single method alone.
FIGURE 4.8.
64
The “tulips” task in the Adobe Photoshop usability test. Beginning
with the image on the left, participants first rotated and cropped the
image. If they finished early, they attempted to increase the saturation
of the tulips, emphasize highlights on the statue, and change a tulip’s
color from yellow to red. [Photo by Andrew Faulkner, afstudio.com]
FIGURE 4.9.
72
The “portrait” task in the Adobe Photoshop usability test. Beginning
with the image on the left, participants first changed the eye color from
brown to blue, and brightened the teeth. If they finished early, they
removed both earrings, reduced eye shadows, and changed the
background color from white to grey. [Photo by Rick Hawkins]
73
xxiii
FIGURE 4.10. A histogram of the severity rank of problems discovered in Adobe
Photoshop by any of the three methods. The median rank was 6.
78
FIGURE 4.11. Two Venn diagrams depicting the number of usability problems
detected in Adobe Photoshop by each of the two methods or
combination of methods. The left diagram shows the results for all
problems, while the right diagram focuses on problems rated as severe.
Problems in the middle of each Venn diagram were detected by both
methods, while those on the outsides were detected by only one
method. Note that backtracking events detected the same number of
severe problems (14) as self-report.
79
FIGURE 4.12. Problem detection curves shown for Photoshop (left), compared
against the curves for SketchUp (right). The charts estimate how the
effectiveness of each usability evaluation method would depend on the
number of participants. The three curves shown in each chart represent
the number of problems detected by backtracking analysis (BACK),
self-report (SELF), and backtracking + self-report (BACK+SELF).
Each estimated curve was formed by randomly choosing smaller groups
of participants from the original set, and estimating how many
problems the smaller groups would have found, on average.
FIGURE 5.1.
80
A continuous two-dimensional space of usability testing tasks. The
vertical axis, goal specificity, encodes how precisely the task goals are
specified. The horizontal axis, method specificity, encodes how
precisely the methods for achieving these goals are specified. While the
space is actually continuous, examples are illustrated in each quadrant
of the space.
89
xxiv
FIGURE 5.2.
Mapping of backtracking purposes onto the two-dimensional task
space. Backtracking associated with recovering from mistakes (faulty
intentions) will only happen when the method specificity is low, which
forces the user to plan sequences of actions. Similarly, backtracking
associated with interface exploration will only occur when we are not
being told precisely what to do, in other words, when the method
specificity is low. Backtracking associated with exploring design
alternatives only happens when there is freedom to explore alternative
designs – when the goal specificity is low.
FIGURE 6.1.
91
The experimental setup for our traditional usability test of Adobe
Photoshop. Each participant worked alongside a professional test
moderator, who directed the participant to think aloud while
attempting a task in Photoshop. We recorded the interactions using
screen capture software, and a video camera (visible in left image) aimed
at the participant’s face.
FIGURE 6.2.
99
A histogram of the severity rank of problems discovered in Adobe
Photoshop by either backtracking analysis or traditional laboratory
testing. The median rank was 5.
FIGURE 6.3.
A detailed cost-benefit analysis comparing backtracking analysis with
traditional usability testing. This chart plots costs (expert hours
moderating and evaluating) vs. benefits (number of unique usability
problems found). Costs for backtracking analysis are projected for three
different test group sizes (k). To estimate the shape of each curve, we
randomly sampled subsets of the original set of 24 participants in each
condition, and computed the costs and average benefits for each subset
size. For clarity of illustration, we have divided the costs of running
106
xxv
each backtracking analysis session evenly amongst the participants in
the session; a plot of the raw data would include discontinuities at
multiples of the group size. Note that each curve terminates at a
different point along the cost axis, since the costs of running all 24
participants depends on the evaluation method and its parameters. The
termination points correspond to the values listed in Table 6.1
(aggregate analysis).
FIGURE 6.4.
111
A detailed cost-benefit analysis, broken down by evaluator. These three
charts, one per evaluator, plot costs (expert hours moderating and
evaluating) vs. benefits (number of unique usability problems found).
For all three evaluators, backtracking analysis was more cost-effective
than traditional testing, for k = 4 and k = 8. Evaluator A and Evaluator
B performed similarly, while Evaluator C reported fewer problems.
FIGURE 6.5.
113
An informal comparison of the types of usability problems found by
traditional laboratory testing and backtracking analysis. Traditional
laboratory testing detected a higher percentage of problems related to
finding features and forming strategies.
FIGURE 7.1.
118
A hypothetical sketch of the long-term cost/benefit relationship
between backtracking analysis and traditional laboratory testing. We
suspect that backtracking analysis finds fewer usability problems in the
long term, but those that it does find, it finds more efficiently. The area
of shaded region between the curves indicates the area of advantage for
backtracking analysis.
134
xxvi
1
Introduction
Design is often said to be the science of tradeoffs, and software interaction design is no
exception[76,78]. A design that works fluidly for one user, situation, or goal might be
cumbersome or ineffective for another. A designer’s job is to understand the most important
tradeoffs, and make principled choices based on this understanding.
Faced with the challenge of evaluating these tradeoffs, an important tool in the interaction designer’s arsenal is the usability test. Testing can reveal interaction breakdowns that
force the designer to reconsider the relevant design decisions. Concrete evidence of failures
can be particularly important because it helps to counteract confirmation bias [30], which
gives designers false confidence that their designs will work as intended.
A commonly practiced usability testing method is the traditional laboratory usability test [34,93], based on the think-aloud protocol [36]. A group of participants is invited to
the usability laboratory one at a time, where each is asked to attempt a set of representative
tasks while “thinking aloud.” A moderator is present during each session, reminding the user
to continue thinking aloud and occasionally asking questions. After the session, an evaluator
reviews notes and videos and produces a report intended to influence the design team. Given
the high costs of laboratory space and one-on-one session moderation, traditional laboratory
1
1.1 the problem
2
tests are generally small scale – often involving fewer than 10 participants [77]. However, for
many applications, small scale laboratory tests are sufficient to capture a high percentage of
the usability problems, due to the “law of diminishing returns”[82,107].
1.1 The problem
This dissertation focuses on a particular class of applications, creation-oriented interfaces. A
creation-oriented interface is defined as any interface for which the central goal of
interaction is the authoring of some content. Examples of creation-oriented interfaces
include word processors, image editors, 3D modelers, and page layout applications.
As depicted in FIGURE 1.1, creation-oriented interfaces can require considerably
more participants to test than predicted by the law of diminishing returns. Two common
% problems found
law of diminishing returns
(Nielsen and Landauer1993]
100
%
75
%
50
%
25
%
creation-oriented software
[Akers et al. 2009]
5
10
20
30
number of users
FIGURE 1.1. Creation-oriented software can require more participants in usability testing than
suggested by the “law of diminishing returns” [Nielsen and Landauer 1993]. Nielsen and
Landauer’s curve, derived from averaging the parameters of a mathematical model applied to
data from usability studies of 11 different applications, implies that it is generally possible to
find 75% of the usability problems by testing only 5 participants. In contrast, a study of Google
SketchUp (a creation-oriented 3D modeling application) required over 30 participants to find
an estimated 75% of the problems.
1.2 proposed solution
3
characteristics of creation-oriented applications increase the diversity of user experiences,
requiring more participants to capture this diversity. First, many creation-oriented interfaces
leave the content goals unconstrained; in a word processor, for example, one can design a
letter, an essay, a flyer, or a résumé. Second, creation-oriented interfaces often provide many
ways to produce the same content; in a 3D modeling application, for example, one can adopt
an additive or subtractive modeling strategy, and control the order in which pieces are built
or aligned to one another. The usability problems encountered depend on the chosen goals
and strategies, which may vary substantially among the users of the product.
Thus, while a large participant pool is necessary to test many creation-oriented applications, traditional laboratory usability testing is often done on a tight, fixed budget, and
the costs of adding additional participants are high. This dilemma leads to the central
research question asked by this dissertation: How can we facilitate effective formative
usability testing of creation-oriented applications?
1.2 Proposed Solution
To address this problem, this dissertation contributes a new usability evaluation method
called backtracking analysis, designed to automate the process of detecting and characterizing
usability problems in creation-oriented applications. The key insight is that interaction
breakdowns in creation-oriented applications often manifest themselves in simple
backtracking operations that can be automatically logged (e.g., undo operations, erase
operations, and abort operations). Backtracking analysis synchronizes these events to
contextual data such as screen capture video, helping to characterize specific usability
problems without requiring the active attention of a human moderator.
1.2.1
Thesis statement
Backtracking events can be effective indicators of usability problems in creation-oriented
applications, and can yield a scalable alternative to traditional laboratory usability testing.
1.3 research challenges
4
1.3 Research challenges
There are several research challenges involved in demonstrating the above claim. First,
simply detecting a backtracking event tells us nothing about the specific difficulty
encountered by a user. It is necessary to find a means of collecting the contextual
information needed to characterize the nature of the difficulty, without compromising the
scalability of the approach.
Second, not all usability problems are indicated by backtracking events. For example,
suppose that a user experiences difficulty in finding a feature, exhaustively scanning the
menus for the feature without success. This might be a serious problem, but since it does not
induce a backtracking event it would not be detected by backtracking analysis. What if most
serious usability problems went undetected by backtracking events?
Moreover, not all backtracking events indicate usability problems. Backtracking
provides a safety net for exploring the features of an interface and learning its functionality.
Of course, if an interface is difficult to learn, one may say that it suffers from usability
problems – but sometimes learning-by-experimentation is preferable to learning by reading a
user manual. Backtracking also provides a transient way to explore design alternatives – if
one does not like the form or function of the content, one can simply backtrack and try a
different solution. These two examples cast doubt on whether backtracking events would
serve as effective indicators of usability problems; perhaps most backtracking events would
indicate false alarms from a usability perspective?
Thus, to prove effective, backtracking events would need to detect a high percentage
of severe usability problems, while generating a low percentage of false alarms. Measurements of effectiveness would be most meaningful when placed in comparison to other
known usability evaluation methods. We would also need to demonstrate effectiveness
across more than one application.
1.4 summary of findings
5
These challenges can be expressed in the form of three primary research questions
addressed by this dissertation:
Q1:
Is it feasible to automatically characterize usability problems from backtracking events and their associated context?
Q2:
How do backtracking events compare in effectiveness to other automatic
indicators of usability problems?
Q3:
How does the effectiveness of backtracking events generalize across software
applications?
1.4 Summary of Findings
Chapter 2 introduces related work in the areas of usability engineering, usability breakdowns, usability evaluation methods, automatic detection and characterization of usability
breakdowns, and command history systems.
Chapter 3 addresses the feasibility of the approach (Q1). First, the chapter shows
that it is possible to instrument two common applications (Adobe Photoshop [1], an imageediting application, and Google SketchUp [2], a 3D-modeling application) to automatically
record backtracking events such as undo and erase. This enabled parallel usability testing
sessions with up to eight participants at a time (recording screen capture video while the
participants worked on tasks). Pilot studies with the SketchUp application revealed that
screen capture video centered around each backtracking event often provides insufficient
information to characterize a user’s difficulty. To address this limitation, we developed a
paired-participant retrospective technique, in which participants watch their own screen
capture video episodes and discuss them in pairs. The data provided by this method
significantly improves the evaluator’s ability to understand what transpired in the episodes.
Chapter 4 describes two experiments that compare the effectiveness of backtracking
analysis to a known usability evaluation method (Q2 and Q3). Addressing Q2, the first
1.4 summary of findings
6
experiment evaluated the use of undo and erase events as indicators of usability problems in
Google SketchUp, measuring an indicator’s usefulness by the numbers and types of usability
problems discovered. The experiment compared problems identified using undo and erase
events to problems identified using the user-reported critical incident technique [48], a costeffective usability evaluation method in which participants report their own difficulties. For
the 35 participants in the experiment, backtracking episodes revealed 5% more severe
usability problems than participants self-reported, and the false alarm rate for backtracking
episodes was 27%. It was surprising that backtracking analysis performed so comparably to
self-reporting, a known cost-effective technique. To see whether this surprisingly strong
result generalized to other applications (Q3), we repeated this experiment with the Adobe
Photoshop application. In this second experiment, backtracking episodes identified the same
number of severe problems as participants self-reported, and the false alarm rate for
backtracking episodes was 12%.
Having established the feasibility and effectiveness of backtracking analysis, Chapters 5 and 6 take a deeper look at the approach. Specifically, these chapters address two
additional research questions about backtracking analysis:
Q4:
How does the type of task affect the types of usability problems and false
alarms indicated by backtracking events?
Q5:
What are the strengths and weaknesses of backtracking analysis, compared
to other usability evaluation methods in current practice?
Chapter 5 addresses Q4 by introducing taxonomies of user tasks and backtracking behavior,
and a theory to relate them. The chapter proposes that any creation-oriented task can be
described along two axes: the specificity of the task goals, and the specificity of the methods
used to achieve these goals. This taxonomy can be used as a theoretical map for different
classes of backtracking behavior, and the types of usability problems and false alarms that
each class of behavior indicates. For example, the theory suggests that users will engage in
1.4 summary of findings
7
design exploration more often when a task’s goal specificity is low. This would tend to result
in associated backtracking events that are false alarms from a usability perspective.
Chapter 6 describes an experiment that answers Q5, evaluating the strengths and
weaknesses of backtracking analysis relative to common practice in usability evaluation. In a
between-subjects study of Adobe Photoshop with 48 participants, we compared backtracking analysis with traditional usability testing conducted by a professional usability test
moderator. Following the completion of both usability tests, three professional usability
evaluators identified and reported usability problems for both conditions. The results
provide initial indications that backtracking analysis is more cost effective than traditional
laboratory usability testing. Moreover, results suggested that traditional testing might be
better suited than backtracking analysis for revealing problems related to feature discoverability and strategy formation. Finally, interviews with the evaluators resulted in a number of
insights into how backtracking analysis might fit into current usability evaluation practice.
Finally, Chapter 7 explores potential directions for future work, concluding with a
vision for the future of usability evaluation.
1.4 summary of findings
8
2
Related Work
This chapter reviews related work in usability engineering practices, theories of usability
problems and breakdowns, usability evaluation methods, automatic detection and
characterization of breakdowns, and undo systems.
2.1 Usability engineering
The ultimate goal of usability engineering is to make software easier to use [82, p. 25].
Nielsen describes five aspects of software usability [82], shown in TABLE 2.1. These five
aspects (learnability, memorability, efficiency, satisfaction, and error rate) are not
independent, and can sometimes conflict with one another. For example, it can be
challenging to design an interface that is both easy for novices to learn and is efficient for
experts to use. The relative emphasis on each of these five aspects varies depending on the
product and the intended user audience. For example, the designers of Google SketchUp
emphasize its learnability; a stated design goal is that the basics of SketchUp can be learned
in “just a few minutes” [6]. Adobe Photoshop, however, is primarily meant for expert users
who are willing to invest considerable time and resources into mastering a complex interface.
The Photoshop design team often emphasizes efficiency over learnability.
9
2.1 usability engineering
Usability Aspect
Learnability
Memorability
Efficiency
Satisfaction
Error rate
10
Description
The system should be easy to learn so that the user can rapidly
start getting some work done with the system.
The system should be easy to remember, so that the casual user
is able to return to the system after some period of not having
used it, without having to learn everything all over again.
The system should be efficient to use, so that once the user has
learned the system, a high level of productivity is possible.
The system should be pleasant to use, so that users are
subjectively satisfied when using it; they like it.
The system should have a low error rate, so that users make
few errors during the use of the system, and so that if they do
make errors they can easily recover from them. Further,
catastrophic errors must not occur.
TABLE 2.1. Nielsen’s five aspects of software usability [Nielsen 1993]. The specific
usability goals for a product determine the relative importance of each aspect.
One method for achieving usability goals is to follow a series of recommended steps in
the “usability engineering lifecycle” [82]. Early on in the lifecycle, a design team takes steps
to gather a deeper understanding of the users and their needs, by conducting ethnographic
studies or contextual inquiries. Next, the team enters into a divergent cycle of design; the
goal here is to brainstorm as many possible solutions to the problem as possible. Eventually,
the team chooses a single prototype to move forward, and begins an iterative design process
to improve the prototype. The team alternately changes and evaluates the prototype, using
the results from each evaluation to motivate specific design changes. Since existing usability
problems can mask other usability problems from occurring, one must reevaluate the system
to understand the effects of an intended fix. For this reason, usability experts often advocate
tightening the design-evaluate loop as much as possible; for example, some researchers
advocate drastically reducing the number of participants for each evaluation in order to
reduce the time required to test each design iteration [74].
2.2 usability problems, breakdowns, and errors
11
This dissertation focuses on the evaluation phase of the usability engineering cycle;
how can one characterize the usability of a software product?
2.2 Usability problems, breakdowns, and errors
Usability evaluation generally focuses on identifying and characterizing usability problems:
places where users experience difficulty in accomplishing their goals with the interface.
Identifying problems helps to overcome designers’ confirmation bias: a tendency to search
for evidence that confirms one’s initial beliefs that the software will work as intended. The
following sections review literature on usability problems, breakdowns, and errors.
2.2.1
Usability problems
Since product usability goals can vary, it is difficult to produce a succinct definition of a
usability problem. (For example, as discussed previously, for some products one might
consider a learning-related difficulty to be a usability problem, while in others, one might
discard it as unimportant.) However, there have been attempts to define usability problems
based on the negative outcomes that can result. For example, Jacobsen et al. define a usability
problem as being indicated by any of nine criteria [57]: (1) the user articulates a goal and
cannot succeed in attaining it within three minutes, (2) the user explicitly gives up, (3) the
user articulates a goal and has to try three or more actions to find a solution, (4) the user
produces a result different from the task given, (5) the user expresses surprise, (6) the user
expresses some negative affect or says something is a problem, (7) the user makes a design
suggestion, (8) the system crashes, (9) the evaluator generalizes a group of previously
detected problems into a new problem. We provided these criteria to the professional
usability evaluators employed in the study described in Chapter 6.
Theories of user interaction can provide useful ways to classify the types of usability
problems that can occur. One of the most influential of these is Norman’s theory of action
[86]. Norman begins by observing that a user’s goals are represented in psychological terms,
2.2 usability problems, breakdowns, and errors
12
while the system itself is represented in physical terms. Users must bridge fundamental
“gulfs” between the psychological side and the physical side for a successful interaction to
occur. To bridge the gulf of execution, the user must learn how to translate a psychological
goal into a series of physical actions with the interface. Once the action(s) are executed, the
user must bridge a corresponding gulf of evaluation to interpret the effect of the actions on
the state of the system (and relative to the user’s goal). This fundamental distinction
between execution and evaluation forms the basis for a myriad of classification schemes.
These schemes are designed for a variety of purposes, including the facilitation of usability
problem matching [10], the identification of problem causes [67], and the improvement of
communication between usability experts and product designers [55]. We invented our own
classification scheme to characterize the difference between problems found by backtracking
analysis and traditional testing (see Chapter 6).
2.2.2
Breakdowns
Usability problems often result in interaction breakdowns, as defined by Winograd and
Flores [113]. A breakdown occurs when a user faces enough difficulty accomplishing a task
to become aware of the user interface as an obstacle to be overcome. For example, if a
carpenter uses a hammer to pound a nail, a breakdown occurs if the carpenter finds himself
thinking about the hammer as a tool, rather than the goals of his carpentry work. Serious
interaction breakdowns (also sometimes referred to as “critical incidents” [41]) do not
merely interrupt the flow of the work; they can cause frustration, cost the user significant
time, and cause a user to abandon the product.
2.2.3
Errors
Some usability problems result in errors: actions that result in unintended outcomes. Lewis
and Norman [68] classify errors into two categories: slips and mistakes. In a slip, the
intention is appropriate, but the physical action performed is unintended. In a mistake, the
2.2 usability problems, breakdowns, and errors
13
intention of the user is inappropriate. To clarify the distinction, consider the types of
spelling errors one can make while using a word processor. Misspelling a word is a slip if the
intended spelling was correct (but a typo occurred), but it is a mistake if the errant spelling
was deliberately chosen. Mistakes can be further subdivided into two categories: rule-based
mistakes, in which the user inappropriately applies a learned rule, and knowledge-based
mistakes, in which the user errs while trying to solve a problem from first principles [91].
Most of the usability problems found in the empirical studies of this dissertation were
mistakes (see Chapters 4 and 6).
If a user recognizes a slip or a mistake, she may try to recover from this error. Lewis
and Norman argue that slips are usually easier for the user to recognize than mistakes. To
detect a slip, a user need only compare the outcome of an action with what was expected.
But for a mistake, it is the intention itself that is erroneous; the user may continue for some
time blissfully unaware of the mistake, since all actions may go as expected. Only when the
mistake results in a failed strategy will the user recognize that there is a problem. One of the
most powerful mechanisms for error recovery in creation-oriented software applications is
the ability to backtrack (by executing an undo, cancel, erase, etc.). This simple realization
inspired the use of backtracking events as indicators of usability problems, and is responsible
for the success of backtracking analysis as a usability evaluation method.
It is often impossible to attribute blame for errors that occur. Even at a coarse level, it
can be difficult to say whether an error is caused by human failings, or by a software design
flaw. But for many errors that seem superficially to be the user’s fault, the designer can find a
way to improve the system to eliminate the possibility of error, or at least help users to detect
and recover from it easily. For example, even a simple slip of the mouse, “I clicked on the
wrong button,” can often be mitigated if the designer adds additional space between the
buttons. Lewis and Norman argue that the term “error” is an unfortunate word choice, as it
implicitly places the blame for the difficulty on the user. The studies in this dissertation do
2.3 usability evaluation methods
14
not attempt to attribute blame for errors; we focus on describing the symptoms of the error,
rather than inferring its causes.
2.3 Usability evaluation methods
Backtracking analysis is one of many usability evaluation methods, the goal of which is to
identify usability problems in the interface. Ivory and Hearst classified usability evaluation
methods into five types [56]:
•
Testing methods: evaluating the interface directly with end users (e.g., with traditional laboratory usability tests [34,93], remote usability tests [49], log file analyses
[52,73,103], or A/B tests [65]).
•
Inspection methods: using rules of thumb and experience to infer usability (e.g., with
heuristic evaluations [84], cognitive walkthroughs [111], or pluralistic walkthroughs
[16]).
•
Inquiry methods: asking users for feedback on usability (e.g., using contextual
inquiries, questionnaires, or interviews).
•
Analytical modeling methods: using formal mathematical models to predict usability
(e.g., with GOMS [24], CogTool [59], or ACT-Simple [96]).
•
Simulation methods: simulating expected user behavior to measure usability (e.g.,
with Petri net models [90], information processing models [92], or genetic algorithm models [61]).
Backtracking analysis falls into the first category (testing methods). This includes methods
that facilitate detailed analysis of individuals (e.g., laboratory usability studies), and methods
intended for aggregate analysis of large groups (e.g., log file analyses, and A/B tests). The
latter techniques are often poorly suited for the discovery of specific usability problems with
software, since the aggregate nature of the data makes it difficult to capture the context
necessary to characterize the nature of individual user problems [52]. Since backtracking
2.3 usability evaluation methods
15
analysis itself is oriented toward the discovery of specific usability problems, the discussion
below focuses on other methods with the same primary goal.
Many laboratory usability tests rely on some variation of a “think-aloud” protocol.
Researchers bring participants into a usability laboratory one at a time, and a test moderator
asks them to think aloud while attempting some tasks with an interface. According to
Ericsson and Simon’s version of think-aloud for cognitive psychologists [36], only certain
types of data should be considered reliable in a verbal protocol because people are
notoriously bad at introspecting about their own high-level cognitive processes [85]. The
most reliable statements are those that surface what is already in short term memory,
without attempting to reason about it. For example, while solving a multiplication problem,
one might reliably speak the numbers as they are retrieved from short-term memory[36, p.
342]. The least reliable statements are those that require explanations of thought processes,
which involves some inference on the part of the participant: “I chose this feature because…”
Ericsson and Simon also argued that if the goal is to record users’ thoughts without
influencing their behavior in the tasks, then the moderator’s role should be minimal -- that
of a neutral observer. Even neutral questions are not allowed, since they would redirect
attention and break the flow of the user. The moderator should only remind a participant to
“please continue to think aloud” when the participant falls silent for a predetermined
amount of time.
Ericsson and Simon’s work remains the theoretical justification for use of verbal
protocols, but the practice of think-aloud has deviated significantly from the theory. Boren
and Ramey conducted nine separate field observations of usability evaluators, comparing the
observed behavior to the recommendations of Ericsson and Simon [18]. The differences
between practice and theory were striking. Less than 15% of the interventions observed in
the field constituted simple reminders to think aloud; moderators intervened to change the
focus of a participant, to help participants who were experiencing difficulty, to request
2.3 usability evaluation methods
16
clarification of participants’ comments, to clarify task instructions, and to help participants
to work around software limitations. Practical guidebooks for usability testing [33,34,93]
also follow a more liberal philosophy of intervention. The guidebooks recommend specific
interventions to improve the quality and richness of the data, only cautioning against
interventions that would be likely to bias the types of usability problems experienced, or the
user’s reaction to these problems. Dumas and Redish suggest probing participants in how
they feel[34], a practice specifically prohibited by Ericsson and Simon since it requires the
participant to draw inferences.
Boren and Ramey suggest that usability testing practice has diverged from Ericsson
and Simon’s theory primarily because of a difference in goals. Practitioners use think-aloud
to gain a deeper understanding of the usability problems experienced by users, without
artificially introducing or masking problems in the process of verbalization. Subjective data
such as feelings and opinions are valued, because they can help in characterizing the problem
and can help convince a design team to make a change. In contrast, Ericsson and Simon
value thinking-aloud for its use in validating proposed models in cognitive psychology, and
thus the subjective content of verbalizations is unimportant. The study described in Chapter
6 uses a usability testing guidebook [33] as the model for traditional usability testing, in lieu
of a strict interpretation of Ericsson and Simon. This choice reflects a belief, shared by Boren
and Ramey, that carefully chosen interventions can help to identify and characterize
usability problems without biasing the types of problems experienced by the user.
Backtracking analysis relies on a retrospective variant of the think-aloud method, in
which participants comment on their experiences afterwards. (It uses a “stimulated” version
of retrospective think-aloud [19], in which the system shows participants screen capture
video of their experiences to stimulate their memory.) A legitimate concern for any usability
evaluation method that relies extensively on retrospective commentary is whether important
information is lost due to the fallibility of human memory. However, the results of a recent
2.3 usability evaluation methods
17
eye-tracking study have been encouraging [43]. In an evaluation of the stimulated
retrospective think-aloud method, Guan et al. compared participants’ original eye
movements to their retrospective verbalizations, and found strong correlations. They
concluded that stimulated retrospective think-aloud is both valid (consistent with original
eye movements) and reliable (unaffected by task complexity) for reconstructing an account
of a user’s attention during a task.
Regardless of the chosen think-aloud implementation, traditional laboratory usability testing can be expensive [17,72]. There are fixed costs per study (setting up the laboratory,
designing the testing tasks, etc.), and variable costs per participant (recruiting and
compensating participants, running the study, and evaluating the results). This dissertation
is concerned with reducing the variable costs, which can be hundreds or thousands of dollars
per participant. Mantei and Teorey estimated the variable costs of one study at nearly
$1,500 per participant, adjusted for inflation to 2009 dollars [72]. With such high costs,
traditional laboratory usability tests are typically small scale; in a field study of usability
evaluation practices, Molich and Dumas found that the median sample size chosen by nine
independent professional evaluators of a hotel website was six participants [77].
As discussed in Chapter 1, the need to reduce the cost of testing draws motivation
from prior work that has demonstrated that small-scale usability tests sometimes are
insufficient to capture a high percentage of the problems. A large participant pool may be
warranted when the goals require statistically significant results, when it is necessary to
sample a variety of expertise levels [55], when users are allowed the freedom to choose their
own task goals [102], or when there are many ways for users to accomplish the same goals.
The latter two scenarios are certainly commonplace for creation-oriented applications.
To reduce the costs of compensating participants, one strategy has been to develop
remote usability evaluation methods. Testing participants remotely eliminates travel costs,
and removes the need for high-cost laboratory facilities such as one-way mirrors, and
2.4 automatically detecting interaction breakdowns
18
expensive camera setups. Hartson et al. provide a useful survey of remote usability evaluation
methods [49]. While this dissertation explores the use of backtracking analysis in a
laboratory setting, it would be useful to extend the work by seeking to find ways to extend
the method to work with remote usability testing.
This dissertation targets reducing the cost of a different phase of testing: moderation.
If one could automatically detect and characterize interaction breakdowns experienced by
participants, a moderator would not need to watch over the shoulder of each individual
participant during testing. Prior work in this area is described in the following two sections.
2.4 Automatically detecting interaction breakdowns
To characterize an underlying usability problem experienced by a user, first it is necessary to
detect the presence of the problem. Many usability problems are accompanied by interaction
breakdowns: difficult interactions that cause a user to lose focus on the task at hand [113].
The automatic identification of such breakdowns has long been viewed as an important goal
in usability evaluation, due to the potential implications for interaction design [56].
Approaches can be grouped into three categories based on the method of automatic
identification: event-based approaches, behavioral/physiological approaches, and selfreporting approaches.
2.4.1
Event-based approaches
Event-based approaches, surveyed by Hilbert and Redmiles in 2000 [52], seek to
automatically detect interaction breakdowns by analyzing statistical patterns in user
interface event logs. Backtracking analysis is an example of such an approach, where the
events of interest are backtracking events (undo, erase, abort, cancel, etc.) We describe some
of the most influential event-based approaches below, and compare them with backtracking
analysis.
2.4 automatically detecting interaction breakdowns
19
One event-based approach is the Expectation Driven Event Monitoring (EDEM)
system [51], developed by David Hilbert and David Redmiles as part of Hilbert’s PhD
dissertation. With EDEM, researchers can specify their usage expectations in the form of
“expectation agents,” which trigger network alerts to the development team whenever these
expectations are violated. For example, a designer of a travel web site form might assume that
a user will not modify the “mode of travel” after she has already specified other parameters
such as the date and destination. When such expectations contrast with real use, an
interaction breakdown often occurs (in this example, perhaps the user would need to reenter the date and destination, since changing the mode of travel requires hitting the ‘Back’
button in the browser).
The primary drawback of the EDEM approach, as later acknowledged by its developers, is the effort often required to create models of expected behavior [52]. For the creationoriented applications considered in this dissertation, this problem is exacerbated by the
open-ended nature of the goals and strategies. For example, it is difficult to imagine how one
would construct such a model of expected behavior for the SketchUp 3D modeling
application. There are simply too many different 3D objects that someone might choose to
build, and too many ways of building them. Although one could construct useful partial
models that account for specific goals or strategies, it would be difficult to build a single
comprehensive model.
Alternately, one can attempt to detect unsuccessful interactions directly. While testing
the Halo 3D-shooter computer game, Microsoft generated “heat maps” indicating the
locations of player deaths within the game’s virtual environment [105]. Each player death
(especially accidental suicides, which tend to be particularly frustrating) could be replayed by
the designers, who used these replays to identify underlying usability problems. For
example, designers discovered that firing a rocket while walking uphill often caused the
player to die; the interface was redesigned to automatically adjust the aim of the rocket when
2.4 automatically detecting interaction breakdowns
20
the player was walking uphill. The inspiration behind this approach is similar in spirit to
backtracking analysis; the main difference is the type of events (player deaths vs. backtracking events).
Another strategy based on detecting unsuccessful interactions is to search for repeating patterns of events. Such patterns, according to Siochi and Ehrich, could indicate that
system commands exist at the wrong level of abstraction, that a user is working around an
application flaw, that a user is searching for a way to accomplish a task, or that some error is
causing a loss of state that must be manually regenerated [100]. The Maximal Repeating
Patterns (MRP) algorithm [100] finds all repeating patterns in an event sequence,
producing a list of these patterns ordered by length and frequency of occurrence. Other
pattern detection techniques allow the researcher to specify “events of interest”. The Fisher’s
Cycles method [39] finds all sequences that span researcher-specified beginning and ending
events. Lag Sequential Analysis (LSA) [9,37,95]requires the researcher to supply a ‘key’
event and a ‘target’ event, and reports how often the target event occurs at different
positions in the sequence relative to the key event. For any repeating pattern detected with
these techniques, it is critical to establish whether the pattern’s frequency of occurrence is
actually higher than what would be expected by random chance. To perform this statistical
analysis, one might choose Markov analysis or Shannon information theory; Gottman and
Roy provide a survey of these methods [42].
Cuomo concluded from a set of experiments that the above pattern detection approaches are of limited utility for automatically detecting interaction breakdowns [29]. As
part of normal use, users create repeating patterns of command use that do not indicate
interaction breakdowns. (Consider, for example, the repetitive actions of using scrollbars, or
tabbing through data fields.) Cuomo was able to partially overcome this problem by
performing the pattern detection analysis at more abstract levels (by hierarchically encoding
2.4 automatically detecting interaction breakdowns
21
the user interface events). Patterns of events at higher levels of abstraction were often more
likely to indicate interaction breakdowns.
Compared with backtracking analysis, pattern detection approaches require substantially more labor to apply. Cuomo noted that producing a hierarchical encoding of
events was extremely labor intensive, which contravenes the entire purpose of automatic
breakdown detection. Pattern detection approaches also require the researcher to
instrument the application to record a wide variety of events of interest (in contrast with
backtracking analysis, where one only needs to track backtracking events). Usability analysis
software tools like MacSHAPA [97] do offer support for common pattern detection
algorithms, but do nothing to help with the problem of instrumentation.
2.4.2
Behavioral and physiological approaches
Many studies have investigated behavioral and physiological indicators of usability problems.
Possible behavioral indicators include facial expressions, hand gestures, shifts in body
posture, or verbal responses such as shouts or curses [106]. Physiological indicators include
changes in skin conductance, cardiovascular activity, respiration, brain activity, muscular
activity, and pupillary dilation [12]. Such behavioral and physiological responses have been
shown to correlate with short-term changes in arousal and emotional valence (positive or
negative feeling).
A number of studies have explored behavioral and physiological indicators to identify frustration, a useful indicator of potential usability problems. We highlight a few of these
studies below to convey the scope of current investigations. Scheirer et al. deliberately
manipulated a computer game to introduce frustrating usability problems, and measured
significant changes in skin conductivity and blood volume pressure [98]. Mentis and Gay
measured statistically significant changes in the pressure users applied to a touchpad device
immediately after encountering difficulties with the Microsoft Word application [75].
Ward and Mardsen introduced popup advertisements into a web page design, and found
2.4 automatically detecting interaction breakdowns
22
statistically significant changes in skin conductance during the 10 seconds following the
appearance of each popup [110]. Kapoor et al. used an ensemble of devices (a camera, a
pressure-sensing chair, a pressure-sensing mouse, and a device to measure skin conductance)
to predict frustration in children solving a Towers of Hanoi puzzle, measuring ground truth
with self-reported “I need help” and “I’m frustrated” button clicks [60]. Tullis and Albert
provide a survey of recent techniques, including many of those described above [106].
The authors of these studies suggest caution when trying to use these methods in a
real usability study; daunting research challenges remain before these approaches will gain
practical value. Ward and Mardsen identified four issues with physiological data [110].
First, physiological readings can be inconsistent – either across different people given the
same stimulus, or across different measures given the same stimulus. Second, it can be
difficult to recognize significant features within a stream of physiological data; how much of
a change should be considered “significant”? Third, even if it is possible to identify
significant features, it can be hard to interpret the meaning of such features. (Different
psychological events can produce similar physiological responses; making it difficult to know
the underlying reason for an observed response.) Finally, most successful research in
physiological signals involves tight experimental controls (long baseline periods, temperature
and humidity controls, electrodes, etc.), and such invasive measures are often impractical for
usability testing in practice.
If one detects that a physiological change has occurred associated with one or more
backtracking events, one might be more confident that an interaction breakdown occurred.
This potential direction is left as future work.
2.4.3
Self-reporting approaches
A third way to detect interaction breakdowns automatically (without requiring an external
observer) is to ask users to self-report their difficulties. When contrasted to event-based or
behavioral/physiological detection, there are several obvious tradeoffs. On the one hand,
2.4 automatically detecting interaction breakdowns
23
self-reporting can theoretically detect any type of problem that a user is aware of, and results
in very few false alarms. On the other hand, self-reporting requires the user to be trained, can
interfere with the user’s workflow, and relies on the user’s own subjective judgments. As
confirmed in our own experiments, users may be embarrassed to report usability problems
that they attribute to their own shortcomings (see Chapter 4). Self-reporting is useful in
situations when these tradeoffs are acceptable to the evaluation team.
Research in this area derives from the critical incident technique [40], in which significant workplace behavior is recorded and analyzed by trained observers (not self-reported
by the workers). del Galdo et al. adapted the critical incident technique to focus on humancomputer interaction, and removed the requirement of employing a trained observer to
detect the incidents [41]. In a study of an online computer conferencing system, they
showed that users were capable of reporting their own critical incidents as they worked. For
each reported incident, users filled out a short form for each incident, explaining what
happened, and providing some context. The experimenter was on hand during the
experiment, and occasionally reminded participants to report incidents when they seemed to
have forgotten.
Building on this prior work, Hartson and Castillo devised the user-reported critical
incident technique [48,49], demonstrating that users could detect and report incidents
without any expert supervision when sufficient training was provided beforehand. Capra
developed and evaluated an augmented retrospective variant of the user-reported critical
incident technique, finding it to be similarly effective to a contemporaneous reporting
strategy [23]. In this variant, researchers showed participants a video replay of their entire
session, asking them to detect and describe critical incidents as they observed them in the
replay.
While it is unclear how often these user-reporting techniques are used as part of laboratory usability evaluation, they have been widely applied for the purpose of post-
2.4 automatically detecting interaction breakdowns
24
deployment remote usability evaluation. Nichols et al. survey several applications that allow
users to report their own usability problems and/or crashes, concluding that good reporting
mechanisms require little effort from the user, allow anonymous submissions, permit the
user to understand what information is being transmitted with the problem report, and
provide a way for users to track their problem reports after they are submitted [31].
However, even when design teams observe these principles, it is unclear how many users
actually report the problems that they encounter.
Controlled studies have shown that the user-reported critical incident technique
identifies a small percentage of the usability problems that a traditional laboratory study of
the same scale finds. In one between-subjects study of the Mozilla Thunderbird application
(n = 12), the user-reported critical incident technique found only 37% as many problems as
a traditional laboratory test found (and only 50% of the most severe problems) [11]. In a
more recent study of the same application (n = 20), Bruun et al. reported that the userreported critical incident technique found only 28% as many problems as a traditional
laboratory test (and again, 50% of the most severe problems) [20].
There is evidence that the user-reported critical incident technique fares much better when cost-effectiveness is taken into account. In the study performed by Bruun et al.
[20], the user-reported critical incident technique was found to be over twice as costeffective as traditional laboratory testing (where cost-effectiveness was measured as the ratio
of the number of unique problems found to the amount of time spent preparing, running,
and analyzing the usability test).
Chapter 4 uses the user-reported critical incident technique as a yardstick to measure
the effectiveness of backtracking analysis. To control for differences between the two
techniques in the comparison, we implemented a hybrid of the concurrent [48,49] and
retrospective [23] variants of the user-reported critical incident technique, separating the
detection and description phases of problem reporting. In this hybrid approach, participants
2.5 automatically characterizing usability problems
25
detect critical incidents contemporaneously, but description is delayed until a retrospective
phase (in which we prompted them with screen capture video centered about each detected
incident). This approach enabled a controlled comparison of self-reported incidents to those
detected by backtracking events (for which a hybrid approach is the only reasonable option).
The following section provides a more complete discussion of approaches to collecting
problem descriptions from users.
2.5 Automatically characterizing usability problems
Simply detecting a breakdown in interaction usually reveals little or nothing about the
nature of the difficulty the user experienced [52]. Understanding the difficulty requires
reconstructing the context of the problem; what were the users’ goals and intentions at the
time of the breakdown, and what exactly happened? Recognizing this challenge, researchers
and practitioners have developed a variety of tools and techniques for capturing additional
contextual information without requiring the attention of a human moderator.
2.5.1
Recording the problem
One approach for automatically characterizing usability problems is to capture enough data
from the system to document and later reproduce the suspected breakdown. The advantage
of this approach is that the user can be a passive participant, completely unaware of the posthoc reproduction.
Perhaps the simplest such technique is to rely on video capture from a camera to
provide the recording. These techniques, collectively known as “synch and search,” use
timestamps on log events to synchronize with continuous video of the participant captured
during usability testing. Hilbert and Redmiles provide a useful survey of these tools and
techniques [52], a few of which are elaborated upon below.
Mackay introduced EVA [71], a system that enabled researchers to annotate video
data as it is collected, and afterwards review video centered on each annotation.
2.5 automatically characterizing usability problems
26
Hammontree et al. indexed video with automatically captured system events rather than
manual researcher annotations [45]. The authors note that the ability to automatically focus
on short video episodes facilitates cost-effective retrospective think-aloud protocols.
Backtracking leverages this technique, extracting screen capture video episodes centered on
each backtracking event and asking participants to provide retrospective commentary on
each episode.
Badre and Santos developed the I-Observe system [14], in which researchers could
extract video episodes corresponding to patterns of user interface events specified with
regular expressions. For example, a researcher might want to search for a specific pattern of
undo events interleaved with redo events.
Usability evaluation tools are beginning to integrate these techniques. Burr et al. developed a video analysis tool called VACA [22], and Hartmann et al. extended this tool to
integrate with the d.Tools physical prototyping system [46]. VACA unifies researcherspecified annotations, application event data, and multiple streams of video data into a single
view, eliminating the overhead of switching between applications during analysis. VACA
provides a useful model from which to build tools to support usability evaluation with
backtracking analysis.
Privacy concerns or logistics sometimes render camera-based video recording infeasible, motivating the use of less invasive recording approaches. One such approach is to
capture enough parameters of the system state in order to restore the state at a later time.
Sometimes, the information captured is only enough to partially restore the state (e.g., in the
capturing of stack traces for program crash analysis.) Another alternative is to focus
exclusively on capturing the screen activity. Screen capture can be sufficient for recording
breakdowns, but it does disregard gestures, body posture, facial expressions, and anything
else in the environment that may have influenced a participant’s behavior. Backtracking
2.5 automatically characterizing usability problems
27
analysis employs a screen-capture approach for recording, since testing in large groups makes
camera-based video capture difficult to maintain.
2.5.2
Collecting user commentary
Sometimes, recording alone does not provide enough contextual information to interpret
the difficulty a user experienced [115]. In these cases, one option is to ask the user to
provide additional commentary regarding the breakdown.
The simplest strategy is to ask users to think aloud as they work. However, most descriptions of the think-aloud protocol require the active, one-on-one participation of the
moderator; the moderator’s job is to remind the user to verbalize, and ask probing questions
to uncover the nature of difficulties. But this is precisely the kind of costly one-on-one
interaction that one seeks to avoid by automating the process. Theoretically, it might be
possible to automatically remind participants to resume thinking aloud whenever they fall
silent – but this has not yet been proven effective.
A more targeted approach requires participants to answer a set of questions about
each interaction breakdown as it happens. This approach is a mainstay of the user-reported
critical incident technique [48,49], in which users are asked to fill out an extensive form
immediately after each time that they press a “report incident” button. This approach has
also made it into common practice. Mozilla Firefox asks users to provide detailed contextual
information each time that that the program crashes. The Safari web browser allows users to
report generic problem reports, even when the program has not just crashed.
There are several drawbacks to this approach. When users self-report their own interaction breakdowns, requiring an immediate description of the problem can lead users to
delay reporting a problem until they feel that they are ready to describe it [48]. This makes it
considerably more difficult to synchronize the reported incident to contemporaneous video
or other context. When the system detects breakdowns (using event-based or behavioral/physiological techniques), requiring an immediate description of the problem can be
2.6 command histories and undo
28
intrusive and irritating. Nevertheless, some event-based usability evaluation methods (e.g.,
EDEM [51]) advocate this approach despite this concern.
Backtracking analysis addresses the intrusiveness concern by delaying the problem
description until a retrospective session. Using retrospective interviews to clarify interaction
breakdowns is hardly a new idea. For example, Siochi and Ehrich employed one-on-one
retrospective interviews as early as 1991 to gather context on events detected with the MRP
technique [100]. However, what distinguishes the retrospectives in backtracking analysis
from other approaches is that backtracking analysis fully automates the retrospective
interview. Chapter 3 describes this automated retrospective method, in which pairs of
participants in a group usability test discuss a set of pre-specified retrospective questions.
2.6 Command histories and undo
While there are many types of backtracking events considered by this dissertation (e.g., erase,
abort, cancel), the explicit undo command proved to be the most useful indicator of
usability problems in our experiments. During the past several decades, undo has also
garnered considerable attention in the research community, yielding a characterization of
the design space for possible history implementations. The following sections describe the
design space, and situate the test applications (SketchUp and Photoshop) within this space.
Finally, Section 2.6.3 reviews models for how users perceive and use the undo function.
2.6.1
Command history models
In order to define the meaning of the undo and redo commands, one must first define a
model for the history of application use. The most common such model is known as the
command history model. Each command that a user executes is represented as a state in a
history graph, beginning when the application is first launched. An ordered list of these
states is termed a “command history,” and the undo and redo commands can be used to
traverse this history forwards or backwards, updating the current state of the application.
2.6 command histories and undo
29
There are two variants of command history models: linear and branching. In a linear
command history, the history of commands is maintained as a simple ordered list of
commands, as shown in FIGURE 2.1. In this model, if a user uses undo to retreat five steps,
then subsequently issues a new command, the previous branch of five commands is
discarded in order to maintain a linear history. The advantage of this approach is that the
command history is easy for users to conceptualize and navigate; the disadvantage is that the
history fails to represent all of the actions the user has taken since the application was
started. Linear command histories are still the most commonly used in practice.
Vitter introduced the concept of a branching command history [108]. In this case, all
previously executed commands are preserved in the history, even when they are not part of
the active path being explored. The history is represented as a directed acyclic graph with
one root node, as shown in FIGURE 2.2. Branching command histories change the semantics
of the redo operation; if there are multiple divergent paths leading from a state, then the
redo command becomes ambiguous, and the application must solicit the desired branch
from the user. To help understand and navigate branching command histories, researchers
have proposed innovative history visualization techniques (e.g., [63] and [50]).
1
Draw Obj
at(x,y,z)
2
Move Obj
to (x’, y’, z’)
3
Erase Obj
FIGURE 2.1. A simple linear command history. Each command executed is represented as a
node in an ordered list. If a user backtracks with undo and then executes a new “branch” of
commands, the previous forward branch is discarded.
2.6 command histories and undo
30
FIGURE 2.2. A branching command history. History is represented as a directed acyclic graph
with one root node (at left). As users retreat to early states and explore new paths, the old
paths are preserved.
Both SketchUp and Photoshop utilize a linear command history. SketchUp limits
the command history to storing a maximum of 100 commands, while Photoshop’s
maximum history size is customizable (but defaults to storing 20 commands). In Photoshop,
the command history can also be visualized in tabular form in the “history palette”; users can
navigate to a state in the history simply by clicking on it.
It is reasonable to expect that the type of command history model would influence
the types of backtracking behavior. For example, a branching command history might
encourage users to use backtracking as a way to compare design alternatives. This would
increase the percentage of false alarms detected by backtracking events. While beyond the
scope of this dissertation, it would be interesting to explore other command history models
as part of future work (see Chapter 7).
2.6.2
Undo models
Given a command history model, there are two ways to define the semantics of the undo
command: linear undo, and selective undo.
With linear undo, the undo command is defined by moving one state backwards in
the state graph (regardless of the command history model being used). In other words, the
2.6 command histories and undo
31
undo must always reverse the most recent command in the history. One cannot undo earlier
commands without undoing later commands first.
Berlage first coined the term “selective undo” to describe undo systems in which the
user is given explicit control over the target command of an undo [15]. Researchers have
proposed various semantics for selective undo. In the simplest “script” variant [13], the
command history is replayed from the beginning (after removing the selected command
from the script). The RITA system [15] proposed by Berlage implemented selective undo by
copying the selected command into the present state and executing its inverse. Myers and
Kosbie formalized the model proposed by Berlage, and implemented it in the context of a
hierarchical event system [79].
Edwards et al. proposed a generalization of selective undo in which the commands
to undo could be specified spatially rather than temporally [35]. For example, each region of
an electronic whiteboard might have a separate command history; one could undo a
command in a particular region, even if that command were not the most recently executed
across the whole whiteboard. This concept has become known as “regional undo,” and has
been applied to text editing [70], spreadsheets [62], and digital whiteboards [35].
Another form of selective undo is category-specific undo [27]. Here, separate histories are maintained for different types of commands. For example, one might implement a
separate history for formatting commands in a word processor. There would be a separate
“undo formatting” command from the generic undo.
Finally, researchers of collaborative systems have developed selective undo mechanisms for defining the meaning of undo in a multi-user context. Abowd and Dix described the
difference between global undo (in which a single history is maintained across all users), and
local undo (in which separate histories are maintained for each user) [7].
Both SketchUp and Photoshop are single-user applications that primarily rely on
linear undo. SketchUp also includes a category-specific undo, maintaining two separate
2.6 command histories and undo
32
undo stacks: one specifically for camera view changes, and the second for all other
commands. It was not possible to instrument SketchUp to automatically record camera
change undo commands, so the instrumentation focused on the use of the generic undo
command. Photoshop includes a form of regional undo: the “history brush” tool, which can
be used to paint contents from past states of an image into the present state. It was possible
to record uses of the history brush tool, and this was included as a type of backtracking event
in the experiments with Adobe Photoshop (see Chapters 4 and 6).
2.6.3
Purposes of undo
While most of the research on undo systems has focused on the system implementation,
researchers have also begun to explore the psychological aspects of undo. How do users
actually think about the undo command? Prior work in this area forms a backdrop for this
dissertation’s categorization of the purposes of backtracking commands, and how these
purposes are influenced by the usability testing task (see Chapter 5).
Most early proponents of undo functionality emphasized the role that undo can play
in recovering from errors [7,99,108]. Small errors can have large consequences, but an
explicit undo command allows a user to instantly return to a pre-error state. As early as
1982, Shneiderman included “rapid, incremental, and reversible actions” as a key principle
for the development of direct manipulation interfaces [99]. The ability to easily reverse any
action would reduce users’ anxiety about making mistakes, Shneiderman argued.
Several researchers have looked at the role of undo in helping users to learn the functionality of an interface. These researchers have argued that the safety net provided by undo
is less useful for learning than one might expect. Otto concluded that a single step undo
function was insufficient to support the exploratory learning of an image editing application
[89]. Dix et al. worried that the safety net provided by undo might provide a false sense of
security when there are subtle errors in the undo system [32].
2.6 command histories and undo
33
Several other researchers have investigated the value of undo for helping users to explore design alternatives. Terry et al. concluded that linear undo systems are not ideal for
this purpose, since it is difficult to compare designs when the system can only exist in one
state at a time [104]. They argued for moving beyond the “single state document model,”
developing software that can represent several versions of a creation simultaneously, side by
side. Heer et al. collected usage log data for an exploratory data visualization software tool,
finding that undo commands outnumbered redo commands by a 12:1 ratio [50]. They
inferred that undo is more often used as a way to recover from errors than as a way to revisit
previously explored visualizations.
2.6 command histories and undo
34
3
The Feasibility
of Backtracking Analysis
To facilitate group testing with backtracking analysis, we needed to develop an approach to
automatically detect and characterize the usability problems associated with backtracking
events. Section 3.1 shows that it is possible to automatically detect backtracking events in
two test applications (Adobe Photoshop and Google SketchUp), without modifying the
source code to either application. Section 3.2 presents a series of pilot experiments that
yielded a solution for automatically characterizing the usability problems associated with
backtracking events.
3.1 Automatically detecting backtracking events
In general, the software instrumentation process for backtracking analysis is simple in
comparison to most other methods that rely on event-based problem detection. Backtracking analysis focuses on individual events rather than complex patterns of events, which may
be difficult to classify. Moreover, the only events of interest in backtracking analysis are
35
3.1 automatically detecting backtracking events
36
backtracking events, meaning that it is safe to ignore all other events when instrumenting
the application.
Instrumenting the two test applications for this dissertation, Google SketchUp and
Adobe Photoshop, did pose a small challenge because we did not have access to the source
code of either application. This required a way to capture backtracking events in both
applications without access to the source code. Interestingly, the underlying mechanisms
that we leveraged to capture backtracking events are completely different between the two
applications. The differing approaches are described below.
3.1.1
Instrumenting Google SketchUp
We instrumented SketchUp using its embedded Ruby language interpreter. This
interpreter, originally designed to enable procedural geometric modeling with SketchUp,
includes an API that allows users to attach “listener” callback functions to a variety of
application events. We repurposed these listeners to trigger whenever an undo or erase event
occurred. Erase events are somewhat trickier to capture than undo events, because there is
no native erase event listener in SketchUp. We are able to infer erase events when listeners
indicate the removal of some geometry, and that ‘erase’ is the currently selected tool. (Some
other tools besides erase also remove geometry as part of their operation, requiring us to
know that erase is the current tool.) The Ruby source code for instrumenting Google
SketchUp version 7 is included in Appendix C.
3.1.2
Instrumenting Adobe Photoshop
Instrumenting Photoshop required a little bit more ingenuity. While Photoshop actually
provides a listener API similar to that of SketchUp, a bug in the undo listener made it
impossible to use this technique to record backtracking events. Instead, we were able to
instrument Photoshop using its built-in “history log,” accessible through the application
preferences dialog box. The history log can be configured to record high-level application
3.2 automatically characterizing usability problems
37
events, including backtracking commands such as undo and erase. The resulting log file
contains a list of commands in the order that they were executed, but it does not include the
timestamp information that is needed to synchronize the events to contextual information
(e.g., screen capture video). To capture this timestamp information, we developed a separate
application to monitor the history log file, attaching a timestamp to each line as it is written.
(This approach produces accurate timestamps because Photoshop flushes the output of the
history log to disk immediately after appending each new line, rather than allowing it to
accumulate in a memory buffer.) The Ruby source code for this monitoring application is
included in Appendix C.
3.2 Automatically characterizing usability problems
Backtracking events, like any other event-based indicator of usability problems, are not
useful without the contextual information needed to interpret the meaning of these events.
For example, below are a few of the contextual questions a usability evaluator would want to
answer about any backtracking episode, in order to classify specific usability problems that
might have occurred:
•
What happened before and after the backtracking event?
•
Was the user surprised by the behavior of the software? If so, how?
•
If there was a problem, was the user able to recover? How?
These types of questions are relatively easy to answer when a human moderator is present
during the test. If a moderator does not understand some aspect of a user’s problem, she can
just ask questions about it, either during the task or afterwards during a retrospective review.
But this approach does not scale well; we would be limited to testing one participant at a
time. To make the method cheaper, we needed to find a way to avoid requiring one-on-one
interaction between each participant and a moderator. This represented the first major
3.2 automatically characterizing usability problems
38
research hurdle for backtracking analysis (see Q1, below); it was not obvious that this would
be possible.
Q1: Is it feasible to automatically characterize usability problems from backtracking
events and their associated context?
The next four sections describe a series of pilot studies conducted at Google that
ultimately led to a solution that removes the need for one-on-one attention from a test
moderator.
3.2.1
Pilot study 1: Screen capture video
In the first pilot experiment, we tried synchronizing backtracking events with screen capture
video recordings made during a laboratory usability test of Google SketchUp. We recruited
54 participants of varying SketchUp expertise, bringing them to a laboratory in groups of
10-15 at a time. During a 90 minute usability test, we asked them to attempt three simple
SketchUp tasks: a “room” task, a “chair” task, and a “furniture task” (see FIGURE 3.1).
Participants worked side by side during this test, and their actions were recorded.
FIGURE 3.1. Usability testing tasks for pilot testing with SketchUp. In the “room” task
(left), we asked participants to model the room, including the specified dimensions. In the
“chair” task (middle), we asked participants to model the chair, ensuring that its legs were
the same height and shape. In the “furniture” task (right), we asked participants to
arrange the pre-made furniture within this room.
3.2 automatically characterizing usability problems
39
At the end of the test, we used the time-stamped backtracking events to index into
the screen capture video, and showed the screen capture episodes to two SketchUp user
interface designers. We discovered that knowing the users’ end goals and viewing a recording
of their actions was helpful, but often insufficient to identify specific usability problems. In
nearly 50% of the episodes, it seemed likely that there was some usability problem, but
unclear what the problem might have been.
One thing that did become clear from this study was that backtracking commands
are quite commonly used in SketchUp. FIGURE 3.2 shows the number of tool operations for
each type of tool; shown in orange is the proportion of these operations that were
subsequently reversed with the undo command. It was disturbing to the SketchUp design
team that users reversed Push/Pull operations over 50% of the time! These numbers
motivated the search for a more effective method to characterize the usability problems that
many of these backtracking events seemed to identify.
FIGURE 3.2. Command usage statistics from the first pilot study of Google SketchUp. The
horizontal bars represent the number of times each tool was used during the study. An
overlay for each bar shows the fraction of these commands that were subsequently
reversed using undo. The Push/Pull command was undone over 50% of the time.
3.2 automatically characterizing usability problems
3.2.2
40
Pilot study 2: Screen capture video + concurrent think aloud
The next pilot experiment required participants to think aloud as they worked; it was
expected that the audio recording would provide the necessary context to interpret
backtracking episodes. The results of this experiment surprised us; participants often forgot
to verbalize their thoughts, and the commentary that they did provide was often broken and
terse. Moreover, asking participants to think aloud seemed to have influenced their ability to
model successfully. Two factors may have contributed to the reticence of the participants.
First, the thought process behind using SketchUp is likely nonverbal: SketchUp users are
forced to think spatially -- in 3D shapes and orientations, not words. Perhaps much of
problem-solving activity in SketchUp is represented in spatial short term memory, rather
than the verbal short term memory that the think-aloud protocol is meant to surface?
Second, since the experiments were conducted in large groups, it was not feasible to
individually remind participants to think aloud as they worked.
It should be noted that these difficulties with concurrent think aloud may be specific to the SketchUp application. Further studies are needed to determine whether concurrent
think aloud protocols might be more successful with other creation-oriented applications
besides SketchUp.
3.2.3
Pilot study 3: Screen capture video + retrospective think aloud
Hoping to alleviate some of the problems with using a concurrent think aloud protocol, we
decided to try supplementing the screen capture with retrospective rather than concurrent
commentary. It seemed likely that participants could speak more effectively about their
difficulties if they were not simultaneously trying to complete the task.
After participants finished the tasks, the computer automatically generated short screencapture episodes centered around each backtracking event. The computer prompted
participants with three questions about each episode:
3.2 automatically characterizing usability problems
41
1. Please describe the events that led you to [undo/erase]. Focus your answer on
recounting a “play-by-play” of what you were thinking and doing at the time. (If you
can't remember, just say so and move on to the next episode.)
2. In the events leading up to your [undo/erase], did the behavior of the software
surprise you? If yes, explain the difference between your expectations and what actually happened.
3. Did you find a way around the issue? If so, what did you do to get around it?
A screenshot of the video player is shown in FIGURE 3.3. A VCR-like interface was provided
to allow participants to scrub through the screen capture video as they desired. Participants
answered the three questions (displayed on the right side of the screen) by speaking into
their headsets, alongside other participants who were doing the same for their own episodes.
We considered using text input rather than speech, but were cautioned by the experience of
FIGURE 3.3. The software interface used to gather retrospective commentary from
participants. Screen capture video episodes centered around each backtracking event
were displayed in the large pane on the left. Participants could interact with the video
using a VCR-like interface at the bottom. Retrospective questions were displayed on the
right side; participants answered these questions by speaking into a microphone.
3.2 automatically characterizing usability problems
42
Castillo, who reported that it can be difficult for evaluators to understand the correspondence between text comments and parts of the screen capture video [25]. It seemed plausible
that using speech instead of text would rectify this problem, since participants could then
make synchronous references to the video.
Pilot testing revealed that even this speech-based approach was insufficient. Participants’
commentary was often abrupt, and generally did not help in describing the underlying
usability problems. They reported that it felt awkward talking to their computer, especially
when sitting alongside others who were doing the same. There were sometimes awkward
silences in the room when all of the participants happened to fall silent simultaneously.
These drawbacks led us to seek yet another method of capturing context.
3.2.4
Pilot study 4: Screen capture + paired retrospective
The final pilot study paired up participants and asked them to discuss the questions together
during the retrospective. Each pair of participants was assigned roles as “speaker” and
listener”. (The participants swapped roles halfway through, and changed computers.) The
speaker’s job was to watch her own episodes and attempt to answer the prompted questions.
The listener’s job was to ask follow-up questions until the answers were completely clear.
The listener, not the speaker, was responsible for deciding when to move on to the next
question (by clicking a “Question has been answered clearly” button). In either role,
participants were encouraged to use a shared mouse to point at objects rather than their
fingers, so that it was possible to capture these references in the screen capture recording.
The result was a success; the commentary was greatly improved over the previous
pilot sessions. Interestingly, listener participants rarely asked follow-up questions, but their
mere presence seemed to have changed the way that speakers responded to the questions.
Listeners were surprisingly effective as moderators, despite receiving minimal training. In
general, they avoided jumping to conclusions or asking leading questions. It may also have
helped that listeners had just completed the task themselves (providing them valuable
3.2 automatically characterizing usability problems
43
context from which to interpret speakers’ comments). Both speakers and listeners appeared
to enjoy the process of reviewing the video episodes together; the conversations were
punctuated by laughter and smiles. The resulting commentary was enough improved that we
decided it was worth the extra time required to pair up participants.
The paired-participant retrospective technique builds upon prior work in usability
testing methods. O’Malley et al. first described the idea of pairing participants during the
task phase of think-aloud usability testing, coining the term “constructive interaction” [88].
A more recent study by Hackman and Biers discovered that participants generated more
think aloud comments when working in pairs during a test [44]. Note that in constructive
interaction, participants are paired during the task, whereas in backtracking analysis
participants are paired only for the retrospective. The goals also differ; in constructive
interaction, pairing is done to collect richer data from participants, while in backtracking
analysis, the primary goal of pairing is to reduce the costs of usability testing by facilitating
large group testing. Thus, while we certainly cannot claim to have invented the idea of
paired-participant usability studies, we did find a unique application of this approach that
proved to be surprisingly beneficial.
The idea of pairing participants also has a rich history in educational research and
practice. The benefits of paired learning were recognized even in ancient times -- for
example, in the traditional Talmudic practice of Chevrutah, where pairs of learners work
together to interpret the Torah and other Jewish texts [21]. O’Donnell and O’Kelly provide
a comprehensive survey of modern day peer-learning techniques [87]. One particular area in
which pairing participants has shown great promise is pair programming [112]. In one
study, students working in pairs during an introductory programming class performed better
on projects and exams, and ultimately achieved better grades [80]. Within each pair, one
student is assigned a “navigator” role, instructing the other student (the “driver”) what to do.
Periodically, the teacher checks that each pair is working effectively, and swaps driv-
3.2 automatically characterizing usability problems
44
er/navigator roles when appropriate. The asymmetric roles in pair programming are similar
to the speaker/listener dichotomy in backtracking analysis.
3.2.5
Summary
This chapter presented the evolution of backtracking analysis into a scalable usability
evaluation method. Section 3.1 demonstrated that it was possible to automatically detect
backtracking events in both of the test applications, SketchUp and Photoshop. Section 3.2
described four iterations of pilot testing, which yielded a paired-participant retrospective
technique that makes it possible to characterize usability problems from backtracking events
without the attention of a human moderator.
Having shown the basic feasibility of the backtracking analysis approach, Chapter 4
compares its effectiveness to another usability evaluation method.
4
The Effectiveness
of Backtracking Analysis
The previous chapter demonstrated the basic feasibility of backtracking analysis, showing
that it is possible to automatically detect and characterize usability problems from
backtracking events. This chapter expands on this work by answering research questions Q2
and Q3:
Q2:
How do backtracking events compare in effectiveness to other automatic
indicators of usability problems?
Q3:
How does the effectiveness of backtracking events generalize across software
applications?
Section 4.1 elaborates upon the motivation for the studies of effectiveness. Section 4.2
describes an an empirical study with Google SketchUp that compared backtracking events
with user-reported critical incidents, measuring each indicator’s usefulness by the numbers
and types of usability problems discovered. In a within-subjects experiment with 35
participants, backtracking events detected 105% as many severe SketchUp problems as
participants self-reported, with a false alarm rate of 27%. Section 4.3 describes the second
45
4.1 study motivation
46
study, which extends this result to the Adobe Photoshop application. In a within subjects
experiment with 24 participants, backtracking events detected the same number of severe
Photoshop problems as participants self-reported, with a false alarm rate of 12%.
4.1 Study motivation
As discussed in Chapter 1, it is not inherently obvious that backtracking events would make
useful indicators of usability problems. First, consider that usability problems can take on
multiple forms. As Norman and others have described, one can experience difficulty while
planning a sequence of actions, translating one’s intent into an action, physically executing
an action, or evaluating that action’s success [86]. It is not immediately clear which of these
types of problems would be indicated by backtracking events.
Second, it is also important to acknowledge that backtracking serves more than one
function in creation-oriented applications. In addition to helping users to recover from
errors, backtracking makes it easier to explore and learn the functionality of an interface.
Learning difficulties can sometimes be attributed to usability problems in the interface, but
in some cases it is easier to learn by experimenting than by reading a user manual.
Backtracking can also be used to explore design alternatives; if a design change is undesirable,
one can backtrack to reverse the change and implement a different solution. Such examples
cast doubt on the effectiveness of backtracking events as indicators of usability problems.
Perhaps most backtracking events would indicate false alarms from a usability perspective?
To address these empirical questions, we chose to compare backtracking analysis
with the user-reported critical incident technique [48,49], a usability evaluation method in
which participants report their own usability difficulties. We chose this method for
comparison because it is easy to implement, has been found to be cost-effective compared to
traditional usability testing [20], and is similar enough to backtracking analysis in its
4.2 comparison to self-reporting: google sketchup
47
procedure to allow for a tightly-controlled comparison. Please refer back to Section 2.4.3 for
a more thorough discussion of the user-reported critical incident technique.
4.2 Comparison to self-reporting: Google SketchUp
This initial study [8] sought to compare backtracking analysis with the user-reported critical
incident technique, using Google SketchUp as the test application. The following sections
detail the recruitment process, experimental procedure, data processing, results, and
conclusions.
4.2.1
Recruitment and compensation
The primary goal in recruitment was to attract participants of a variety of backgrounds and
SketchUp expertise levels. This variety increased the generality of the study, and made intergroup comparisons possible.
We recruited a total of 43 participants, of whom 35 provided usable data (see Section 4.2.3). Of these 35 participants, most (29) responded to flyers posted at coffee shops
and in academic buildings at the University of Colorado at Boulder. To attract a higher
percentage of SketchUp experts, we also enlisted 6 employees of Google who are specialists
in 3D modeling with SketchUp.
Of the 35 participants in the experiment, 19/35 (54%) were a near-equal mix of undergraduate and graduate students from the following departments: Architecture (7);
Computer Science (4); Civil Engineering (3); Telecommunications (1); Aerospace
Engineering (1); Astrophysics (1); Geography (1); and English (1). Of the 16 non-students,
6 were professional 3D modelers, 3 were software engineers, and the remainder had
miscellaneous jobs unrelated to SketchUp.
4.2 comparison to self-reporting: google sketchup
48
FIGURE 4.1. The experimental setup for our laboratory study of Google SketchUp. Seven
laptops were identically configured with SketchUp. Participants worked in parallel; their
actions were logged, and their screens were recorded. There were two chairs and
headsets next to each computer, to facilitate paired-participant retrospective commentary sessions.
Of the 35 participants, 10/35 (28%) had never used SketchUp before, 9/35 (26%)
described themselves as novices with the interface, 9/35 (26%) described themselves as
intermediate users, and 7/35 (20%) described themselves as experts. For a 90 minute session,
participants were compensated with a $10 gift check, a short-term license to SketchUp Pro,
and Google swag.
4.2.2
Usability testing protocol
The formal experiment was divided into six 90-minute sessions, each with between 5 and 7
participants who worked in parallel on independent laptops (see FIGURE 4.1 for photographs of the laboratory environment). Each of the laptops was an IBM ThinkPad T61p,
with identical software configurations including a development version of SketchUp.
Laptops were also equipped with screen capture recording software and dual headsets with
microphones (for the paired retrospective session, described later). We also instrumented
SketchUp so that it could record time-stamped occurrences of undo and erase events, and
added an on-screen button for participants to report critical incidents. As described in
4.2 comparison to self-reporting: google sketchup
49
Chapter 3, we implemented these extensions as plug-ins using SketchUp’s embedded Ruby
API, thus avoiding having to make any modifications to the source code to SketchUp.
The 90 minute experiment was divided into the following sections: Training in
SketchUp (15 minutes), Training in Identifying Critical Incidents (20 minutes), Practice
(10 minutes), Modeling Task (15 minutes), and Retrospective Commentary (30 minutes).
Training in SketchUp (15 minutes)
To familiarize participants with SketchUp, participants watched three previously produced
new-user training videos [3]. The three videos were: “New Users 1: Concepts,” “New Users
2: Drawing Shapes,” and “New Users 3: Push/Pull.” Participants were encouraged to take
notes.
Training in identifying critical incidents (20 minutes)
To ensure that participants were adequately trained in reporting critical incidents, we gave
extensive instructions and examples of incidents. For the purposes of a fair comparison, this
study attempted to mimic the style and content of the training described by Hartson and
Castillo [48]. We did make several changes motivated by an early pilot experiment. This
experiment (n = 12) revealed that participants seemed less likely to report problems when
they attributed the problems to themselves (rather than the software). We adjusted the
instructions to emphasize that we were testing the software, not the participants. We also
decided to refer to critical incidents as “interface issues,” hoping that the more neutral
terminology would encourage reporting. See Appendix B for a transcript of the training.
Practice (10 minutes)
Participants were given 10 minutes to practice using SketchUp and reporting critical
incidents. Participants were told to explore interface features and build whatever they
wanted during these 10 minutes.
4.2 comparison to self-reporting: google sketchup
50
FIGURE 4.2. The two tasks used in the laboratory study of Google SketchUp. In the
“bridge” task (top, left), we asked participants to make all four legs the same height and
shape. If participants finished early, they were asked to resize the bridge to 5 ft. x 5 ft. and
make three copies of it, laying them end to end (top, right). In the “room” task (bottom,
left), we asked participants to ensure that the room was 10 ft. high, and that the doorway
was 6 ft. 3 in. high. They did not need to model the bed; they could insert it from the
“components browser” and position it in the room. If participants finished early, they
were asked to modify the bed to form two single beds, and add shadows (bottom, right).
Modeling task (15 minutes)
We randomly assigned participants to one of two tasks: some completed the bridge task
(FIGURE 4.2, top), while others completed the room task (FIGURE 4.2, bottom). Having a
second task increased the generality of the study, but there was not enough time to give both
tasks to each participant. Each task had two phases; if participants finished the first phase
(shown at left), they could raise their hand and receive printed instructions for the second,
more difficult phase (shown at right). This was intended to keep all participants busy
4.2 comparison to self-reporting: google sketchup
51
throughout the session, regardless of their expertise level in SketchUp. See the caption for
FIGURE 4.2 for descriptions of the specific instructions provided to participants.
We asked participants to report critical incidents as they worked. To report an incident, they simply clicked a “Report an Issue” button. Pressing this button triggered a log
message that was written to a file; it had no visible impact to the user. After the task was
finished, an automated system extracted video episodes around each marked event and
prompted participants to reflect on the episodes (see the next section on “Retrospective
Commentary”). Here we deviated from the approach of Hartson and Castillo [48], in which
the user was asked to fill out a form immediately upon experiencing each incident. We chose
to delay the commentary in order to minimize disruption to the user during the task, and to
facilitate a fair comparison with backtracking events (for which commentary must be
collected retrospectively to avoid intolerable disruption).
We considered implementing the “Report an Issue” mechanism as a physical button,
rather than a virtual button on the screen, in hopes that this would increase problem
reporting rates. (In many applications, participants could keep their non-dominant hand
over the button as they worked, making it easier to report issues.) However, an early pilot
test revealed an unexpected problem; our physical button prototype (a Staples “Easy
Button”) made a different sound than a mouse click or keyboard tap, making it easy for
anyone nearby to know when a participant reported an issue. In post-test interviews,
participants reported that this lack of anonymity made them uncomfortable to report
problems, since they did not want others to know about their difficulties. In the future, it
would be worth exploring whether the physical button could be helpful if we overcame the
anonymity problem.
We purposefully did not encourage participants to think aloud as they worked. The
early pilot experiments described in Chapter 3 suggested that it is exceedingly difficult to
think aloud while modeling in SketchUp, and thinking aloud appeared to greatly interfere
4.2 comparison to self-reporting: google sketchup
52
with the ability to model successfully. The thought process behind using SketchUp is likely
non-verbal: SketchUp users are forced to think spatially: in 3D shapes and orientations –
not words. Asking them to comment retrospectively rather than concurrently at least allows
them to focus their attention on putting their thoughts into words.
Retrospective commentary (30 minutes)
Immediately following the completion of the task, the system automatically processed the
video to extract 20 second episodes centered around each undo, erase, and self-reported
incident. If two episodes would have overlapped (e.g., a user repeatedly used undo), then the
system merged the episodes to form a single longer episode, identifying each individual event
with a large caption in the video. The system displayed the video episodes in a VCR-style
interface, and automatically prompted participants with questions about each episode. They
answered the questions by speaking into their headsets, clicking on a button to indicate
when they had finished answering each question. Since there were different questions for
each event type, the system displayed all of the episodes of each event type together, rather
than interleaving them. To avoid confounding the results, we fully counterbalanced the
order of the event types.
Three of the questions were common to all event types:
1. Please describe the events that led you to [undo/erase/report an issue]. Focus your
answer on recounting a “play-by-play” of what you were thinking and doing at the
time. If you can't remember, just say so and move on to the next episode.
2. In the events leading up to your [undo/erase/issue report], did the behavior of
SketchUp surprise you? If yes, explain the difference between your expectations and
what actually happened.
3. Did you find a way around the issue? If so, what did you do to get around it?
For undo and erase episodes, we asked two additional questions:
4. Did you report this as an issue?
4.2 comparison to self-reporting: google sketchup
53
5. If you did not report this as an issue, why do you think that you didn’t?
As in the final pilot study in Chapter 3, the participants in each pair were assigned roles as
“speaker” and listener”. (The participants swapped roles halfway through, and changed
computers.) If there were an odd number of participants, we paired the extra participant
with the moderator, who was otherwise unoccupied. The speaker’s job was to watch her own
episodes and attempt to answer the prompted questions. The listener’s job was to ask
questions until the answers were completely clear. The listener, not the speaker, was
responsible for deciding when to move on to the next question (by clicking a “Question has
been answered clearly” button). In either role, participants were encouraged to use a shared
mouse to point at objects rather than their fingers, so that we could capture these references
in the screen capture recording.
We formed participant pairs by matching those with the most episodes with those
with the least, in an attempt to reduce the variance in time required for each pair to
complete the retrospective review. If an odd number of participants were present in a
session, the experimenter became the listener for the participant with the most episodes.
4.2.3
Usability problem identification
This section describes the analysis process employed to extract usability problems from the
raw usability data. The extraction process followed that of Howarth et al. [54]: we extracted
usability problem instances, and merged these instances to form unique usability problems.
But before we began the extraction and merging process, we took several steps to prepare the
data, described below. FIGURE 4.3 provides an overview of the process.
Step 1: Discarding participants whose data were unusable
From an original set of 43 participants, we removed three participants because their
microphones failed to work properly. We also removed one more participant because he did
not finish his retrospective during the time allotted. We decided to remove three more
4.2 comparison to self-reporting: google sketchup
all participants
(43)
filtered participants
(35)
episodes
(353)
54
problem instances
(215)
problems
(95)
(discarded)
1
Discarding participants
whose data was unusable
2
Extracting episodes and
retrospective commentary
3
Discarding unclear episodes;
Discarding false alarms;
Identifying problem instances
4
Merging similar problem
instances
FIGURE 4.3. An overview of the usability problem identification process. Steps included
(1) manually discarding participants whose data were unusable, (2) automatically
extracting episodes and retrospective commentary, (3) manually discarding unclear
episodes and false alarms, and identifying usability problem instances, and (4) merging
similar problem instances to form unique problem descriptions.
participants because they had been paired with the experimenter; we would like to run
further studies to evaluate how the quality of the commentary might differ in these cases.
(We did not notice any differences, but it is difficult to draw inferences from just three
examples.) Finally, we removed one participant because she could not even begin to answer
the questions about her episodes. (She was utterly lost with SketchUp. Her usability
problems were more of the “how do I use a mouse?” variety.) Removing the data from these
8 participants left 35 participants, whose data proceeded to the next phase of analysis.
Step 2: Extracting episodes and retrospective commentary
The 35 participants produced 353 episodes (139 undo episodes, 113 erase episodes, and 101
self-report episodes). This equates to an average of 10.1 episodes per person, or 0.67 episodes
per minute of SketchUp usage. The system automatically extracted these episodes, and the
associated retrospective commentary.
4.2 comparison to self-reporting: google sketchup
55
Step 3(a): Discarding unclear episodes
From this initial set of 353 episodes, we discarded 25 episodes (7%) because the combination of commentary and screen capture video was not clear enough for the researcher to
extract a complete usability problem instance. We discarded an additional 4 episodes (1%)
in which the user could not remember enough about the episode to answer any of the
retrospective questions. This left 324 episodes (129 undo episodes, 103 erase episodes, and
92 self-report episodes).
Step 3(b): Discarding false alarms
We identified 64 episodes (19.8%) that contained no identifiable usability problems. All but
one of these “false alarm” episodes (98%) were triggered by erase events. Surprisingly, there
were no false alarms triggered by undo events. Only one false alarm was generated by self
report, when a participant accidentally pressed the button. This indicates that the overall
false alarm rate for backtracking episodes was 63/232 = 27%.
There were two varieties of erase false alarms. First, there were episodes in which a
user erased an extra edge that was a byproduct of the normal modeling process. (This is
specific to SketchUp; most other 3D drawing programs do not produce such edges.) Second,
there were episodes in which users created temporary construction lines to help them align
multiple pieces of geometry, and then erased these lines when they were finished.
Interestingly, this example could never have resulted in an undo operation; there is no way
to undo a temporary construction line without also undoing the alignment action that
follows it. This seems to be a general difference between undo and erase, and would likely
hold true for other applications besides SketchUp.
4.2 comparison to self-reporting: google sketchup
56
Step 3(c): Identifying usability problem instances
After all of the data preparation steps described above, 260 episodes remained. A single
researcher analyzed these episodes to extract 215 usability problem instances. The mapping
from episodes to usability problems instances was many-to-many, as described next.
Sometimes, a single episode would correspond to multiple usability problem instances. In identifying usability problem instances, we included both problems that were
found directly by a method, and those that were “incidental” to the method. For example, if
a user experienced some problem, pressed undo because of the problem, and then
experienced a second problem unrelated to the first, we would include both problem
instances. This process produced 35 additional problem instances.
Sometimes, a single usability problem instance would correspond to multiple episodes. This happened only when multiple episodes overlapped in content. Of course,
episodes of the same event type cannot overlap in the screen capture video (since otherwise
the process would have merged them into a single longer episode). However, grouping the
retrospective by event type necessitated that we avoid merging events of different event
types. Therefore, it was possible for episodes of different event types to overlap in content.
When participants saw the same interaction sequence for a second time, their responses to
questions during the retrospective session were likely to be terse. (“I have already talked
about that; refer to my previous answers.”) We resolved such situations as follows: If a
problem was mentioned during the commentary for an episode, and that same problem was
visible in the video of an overlapping episode, then we counted it as a single problem
instance discovered in both episodes. There were 50 pairs of partially overlapping episodes,
and 20 triples.
Step 4: Merging usability problem instances
Next, the researcher merged the 215 problem instances to form 95 unique usability
problems. It is critical that we applied a consistent merging strategy across all problems.
4.2 comparison to self-reporting: google sketchup
57
Merging two problems requires generalization, since no two problem instances are exactly
the same. Problem instances may differ along many dimensions: for example, the level of
granularity of the problem, the immediate cause of the problem, the circumstances under
which the problem occurred, the consequences of the problem, etc. We adopted a
conservative merging strategy, merging problems only if they differed superficially.
Nevertheless, the merge rate (2.26:1) was higher than we expected. This may be due to the
degree of specificity of the task goals; different users working on the same task tended to
experience the same problems because they were all working toward identical goals. An
example illustrating the merging process is included in Appendix B.
Finally, the researcher wrote descriptions for each of the 95 usability problems. In
describing each problem, the primary goal was to record what happened in the episode(s),
and what the user said about what happened. Examples of problem descriptions include:
1.
(Found by self-report only; rated as mild severity)
After creating a hole, one user judged the result by what he could see through
the hole. Because the background (the other side of the hole) was similar to the
material surrounding the hole, he had low confidence in his success and spent 10
seconds making sure that the action had the intended effect.
2.
(Found by undo only; rated as medium severity)
One user experienced difficulty resizing a rectangle with the Move/Copy tool.
He said that he was surprised that it distorted into non-rectangular shapes as he
dragged on an edge. He expected that SketchUp would remember that this
shape was created as a rectangle, and keep that rectangle constraint through the
rest of the modeling process. He worked around the problem by reversing his action and redrawing the rectangle in the new shape.
4.2 comparison to self-reporting: google sketchup
3.
58
(Found by all three methods; rated as high severity)
Several users experienced difficulty when they tried to copy and paste a rectangle, and align their copy to a point on an existing rectangle. The paste operation
automatically triggered a “Move” command on the copied geometry, selecting a
particular corner on the copied rectangle as the anchor point for the move. Users
could not find a way to “snap” the copied rectangle into alignment with the
edges of the target rectangle, since the anchor point did not correspond to any
point on the existing rectangle. They could not find a workaround, and ended
up with unaligned geometry.
The full list of usability problems can be found in Appendix A. Note that we did not
attempt to infer the root causes of these difficulties, which can require complex causal
reasoning [64]. Was the training video unclear? Did users’ expectations stem from their
prior use of other 3D modeling software? This study avoided speculation on such
possibilities; its goal was to provide designers and developers with as much information as
possible to evaluate the design tradeoffs inherent in addressing the problems.
Coding for problem severity
Three independent raters (three knowledgeable SketchUp users, including two user
interface designers from Google) coded each of the 95 usability problems for severity. Raters
evaluated each problem for its estimated frequency in the general population (rated on a
scale of 1-5), and a combination of its estimated impact and persistence (also rated on a scale
of 1-5). Frequency was defined as the percentage of occurrence in the general population
during an average modeling session. Impact was defined as the time it would take to recover
from the problem, while persistence was defined as the extent to which the problem recurred
or was difficult to work-around. The actual scales are shown in TABLE 4.1.
4.2 comparison to self-reporting: google sketchup
59
Problem impact and persistence
(1)
minor annoyance, easily learned or worked around
(2)
bigger problem (at least 3 minutes lost), but easily learned or worked around
(3)
minor annoyance, but will happen repeatedly
(4)
bigger problem (at least 3 minutes of time lost), and will happen repeatedly
(5)
showstopper (can't move forward without outside help; data loss; wrong result not noticed)
Problem frequency
(1)
problem will be extremely rare (less than 1/100)
(2)
some will encounter (at least 1/100, less than 1/3)
(3)
many will encounter (at least 1/3, less than 2/3)
(4)
most will encounter (at least 2/3, less than 100%)
(5)
everyone will encounter (e.g., startup problem)
TABLE 4.1.
Problem severity rating scales used in the SketchUp experiment.
Frequency and impact/persistence ratings were added, and the final severity rating
was obtained by reducing this sum by one; this produced an ordinal scale from 1 (least
severe) to 9 (most severe). We labeled severity as follows: 1-2: mild; 3-4: medium; 5-9: severe
(but 9 was never observed). We divided the 95 problems into three sets: a training set (15
problems), a test set (10 problems), and an independent set (70 problems). Coders used the
training set to discuss the severity scales and resolve differences in coding styles. Next, they
independently rated the 10 problems from the test set, and then discussed the differences
and adjusted their ratings.
Before the discussion, Cronbach’s Alpha [28] was 0.75; after coders adjusted their
ratings, it increased to 0.90. Next, they independently rated the remaining 70 problems. For
the final set of all 95 problems (using the adjusted ratings from the test set), Cronbach’s
Alpha was 0.82, indicating strong agreement amongst the coders. To reduce the effect of
individual outliers, we chose the median of the three ratings as the severity statistic for each
problem. FIGURE 4.4 shows a histogram of all severities.
4.2 comparison to self-reporting: google sketchup
number of problems
60
mild
medium
severe
severity rank (1-8)
FIGURE 4.4. A histogram of the severity rank of problems discovered in Google SketchUp
by any of the three methods. The median rank was 3.
4.2.4
Results
This section describes the numbers and characteristics of usability problems discovered with
each method.
Comparison among undo, erase, and self-report
We define that a problem is detected by a method if at least one participant experienced an
instance of the problem, as evidenced by video episodes and retrospective commentary
associated with that method (undo, erase, or self report). We define that a problem is
detected by a set of methods if the above statement is true for each method in the set (even if
4.2 comparison to self-reporting: google sketchup
61
no particular participant would have contributed evidence of the problem from all of the
methods in the set).
FIGURE 4.5 depicts the number of problems detected by each method or set of methods. On the left are the results for all problems, while on the right are the results for
problems rated as severe (those whose severity rating is at least 5). In each figure, problems
identified by only one method are non-overlapping, while those that were found by a set of
methods are depicted as overlapping with the other methods. Undo and erase combined to
backtracking (74)
undo (65)
erase (38)
4
20
16
25
6
3
21
self-report (65)
all problems
backtracking (23)
erase (19)
undo (20)
1
1
3
15
1
2
2
self-report (22)
severe problems
FIGURE 4.5. Two Venn diagrams depicting the number of usability problems detected in
Google SketchUp by each of the three methods. The left diagram shows the results for all
problems, while the right diagram focuses on problems rated as severe. Problems in the
middle of each Venn diagram were detected by all three methods, while those on the
outsides were detected by only one method. Note that undo and erase combined to detect
more severe problems (23) than self-report (22).
4.2 comparison to self-reporting: google sketchup
62
detect 74 of the 95 problems, while self-report detected 65. For severe problems, undo and
erase combined to detect 23 of the 25 problems, while self-report detected 22. It is also clear
from the figure that while there is substantial overlap amongst the indicators, only 25
problems (26%) were detected by all three indicators.
While FIGURE 4.5 reveals how backtracking analysis compares against self-reporting
for the 35 participants in this study, what if there were fewer participants? Using a simple
statistical technique (see Appendix D), one can estimate how the numbers would vary with
the sample size. By randomly choosing smaller groups of participants from the original set, it
is possible to estimate how many problems the smaller groups would have found, on average.
FIGURE 4.6 shows the comparison as a function of group size. The figure shows that
back +
self
100
estimated
back
75
number of
problems
found
self
50
25
10
20
30
number of participants
FIGURE 4.6. A statistical estimate of how the effectiveness of each usability evaluation
method would depend on the number of participants. The three curves shown represent
the number of problems detected by self-report (bottom), backtracking (middle), and
backtracking + self-report (top). Each estimated curve was formed by randomly choosing
smaller groups of participants from the original set, and estimating how many problems the
smaller groups would have found, on average. We estimate that backtracking analysis
would consistently outperform self-report at all smaller scales, and there appears to be a
substantial advantage to combining backtracking analysis with self-report.
4.2 comparison to self-reporting: google sketchup
63
backtracking analysis (labeled as “BACK”) would consistently outperform self-reporting
(labeled as “SELF”), at all smaller scales. There is an added benefit to combining the two
techniques, but there is considerable overlap in what one can learn from each.
One observation from FIGURE 4.6 is that the slope of each curve has not flattened
out, even after testing with 35 participants. To compare these results with those discussed in
the literature, we estimated the average probability (λ) of a participant finding the average
usability problem for backtracking analysis (λ = 0.042), self-reporting (λ = 0.027), and both
methods (λ = 0.055). Using a Poisson model [83], these values of λ imply that one would
need over 30 participants to discover 85% of the usability problems, even if using a
combination of backtracking analysis and self-reporting. This is hardly consistent with the
“magic number five” rule of thumb which claims that for many usability tests, one can test
only five participants and find 85% of the problems [69,83,107]. Our numbers are more
comparable to a recent study of four web applications [102] (λ
0.1), which also questioned
the universal applicability of the “magic number five” rule. It is difficult to attribute these
differences to specific aspects of the applications being tested, since the value of λ also
depends on the usability evaluation method employed and the tasks used in the study,
among other factors. Nevertheless, it seems likely that the diversity of strategies available in
SketchUp increased the diversity of usability problems encountered by participants (just as
the diversity of semantic content likely contributes to the diversity of problems experienced
in web applications).
Correlation between problem severity and method
FIGURE 4.7 shows how median problem severity varied across methods and combinations of
methods. The median severity rating seems to correlate with the number of methods. Each
indicator provides independent evidence that a problem is severe; when all three indicators
detect a problem, one can be more confident that the problem is severe. Taking problems as
the unit of analysis, we tested for significant differences across all 7 categories using the
4.2 comparison to self-reporting: google sketchup
64
5
4
median
severity
rank
3
2
1
0
UNDO
ERASE
SELF
SELF +
UNDO
ERASE +
UNDO
SELF +
ERASE
SELF +
ERASE +
UNDO
FIGURE 4.7. Median severity ratings for the SketchUp usability problems detected by each
method or combination of methods. Problems detected by only one method have lower
median severity than problems detected by more than one method. Problems detected by all
three methods have the highest median severity, nearly twice that of the median of problems
detected by any single method alone.
Kruskal-Wallis test. The result is significant (χ2(6) = 24.74, p < 0.001). Pair-wise
comparisons using the Mann-Whitney test revealed significant differences for U vs.
S&E&U (z = 3.874, p < 0.001), E vs. S&E&U (z = 2.031, p = 0.046), and S vs. S&E&U (z
= 3.373, p = 0.001). All other comparisons were insignificant. Note that the MannWhitney test assumes that problems are independent (that they do not tend to co-occur
more than they would by chance). Strictly speaking, problems are not independent, but the
effect size is very large and unlikely to disappear when dependence is factored in. A similar
independence assumption appears elsewhere in the literature (e.g., [83]).
4.2 comparison to self-reporting: google sketchup
65
Correlations between problem severity and expertise
We also looked for correlations between the median problem severity and participants’ prior
SketchUp expertise. New users, novices, and intermediates all had a median problem severity
rank of 4, while the median for experts was 2.5. However, the Kruskal-Wallis nonparametric test of the differences across all four groups was not significant, χ2(3) = 2.73, p =
0.44. Although the results were not significant, a possible explanation for the lower problem
severity among experts would be that the tasks (even with their second phases) were
conceptually easy for the experts in the study. Most of the problems that they encountered
were minor nuisances (keyboard typos, etc.).
Reasons problems were not reported
Consider the problems in the top three sections of the Venn diagram – those that were
detected by erase and/or undo, but not detected by self-reporting. Why would people fail to
report problems, when these problems were detected with other techniques? To begin to
answer this question, we assessed the data collected on question #5 in the retrospective
session: for erase and undo events that were not reported, why did the participant think that
he did not report it? Of those times when people ventured to speculate, the explanations
were revealing: 30/52 (58%) said that they did not report the problem because they blamed
themselves rather than SketchUp. (This happened despite repeated attempts to emphasize
to participants that they should disregard the attribution of blame.) Another 16/52 (31%)
said that the problem was too minor to report. The remaining 6/52 (11%) said that they
should have reported it, but simply forgot. While it is easy to draw conclusions from these
numbers, it is important not to over-interpret; people are notoriously bad at introspecting
about their own high-level cognitive processes [85]. However, the data combined with the
subjective comments warrant further investigation into the reasons people do and do not
report problems.
4.2 comparison to self-reporting: google sketchup
4.2.5
66
Discussion
This section reflects on the results of the study, and discusses possible threats to internal and
external validity.
Interpreting the results
We were initially surprised to find that undo and erase detected so many problems,
compared to self-reporting. Many problems, for example, do not seem likely to produce
either an undo or an erase.
Upon reflection, there are two possible reasons why we believe that the problem detection rates for undo and erase were so high. First, sometimes undo or erase operations
happened in circumstances we would not have expected. Consider the following real
problem instance from the experiment: A user attempted to move a piece of geometry, and
nothing happened (because, unbeknownst to the user, the geometry was anchored to its
position). While it would seem that there was no reason to undo (since there was no actual
change to the geometry), the user still executed an undo just to make sure that he hadn’t
changed anything.
Second, recall that we recorded problem instances even when the discovery of the
problem was incidental to the method. (This accounted for nearly 20% of the problem
instances.) Undo and erase operations tend to cluster at times when people are experiencing
difficulties. Within the 20 second window of each screen capture episode, we often detected
participants having difficulties unrelated to the undo or erase event that triggered the
episode.
False alarms
We expected to see two types of false alarms from backtracking events: purposeful uses of
backtracking associated with learning the interface, and purposeful uses of backtracking for
design exploration. Neither of these use cases materialized. Regarding learning, we speculate
4.2 comparison to self-reporting: google sketchup
67
that we saw no false alarms because the protocol included the 15-minutes of training videos
and the 10-minute exploration period. By the time participants began the tasks, they were
ready to work rather than explore. Regarding design alternatives, recall that the task goals in
this study were precise– therefore, backtracking never happened because a user was changing
goals. Chapter 5 revisits this important point.
The two types of false alarms we did find represent categories of backtracking events
that we did not anticipate. The creation of construction lines is an example of a “temporary
action” – an action that doesn’t directly further a goal, but helps us to think or work more
efficiently. Backtracking events associated with temporary actions are not indicators of
usability problems, but rather indicate sophisticated uses of backtracking. The erasure of
system-drawn lines is an example where the operation being reversed is a system action. The
system-drawn lines are only of aesthetic importance; some participants decided to keep
them, while others erased them.
Time allocation for this experiment
Of the 90 minutes in the experiment, participants spent only 15 minutes working on the
task. To some extent, the short task time reflects the goals of this study, which were to
compare three evaluation methods in an experiment rather than to use them in practice.
However, it is also useful to note that 20 of the 90 minutes were spent training participants
in the use of the user-reported critical incident method. While it may be possible to reduce
the amount of training, this is a fundamental difference between self-reporting and eventbased methods. Event-based methods can be employed without any up-front training (and
even without users’ prior awareness that they are being monitored).
Internal Validity
The study design minimized several possible threats to internal validity. Since we varied the
method in a within-subjects manner, we counterbalanced the order of the methods in the
4.2 comparison to self-reporting: google sketchup
68
retrospectives to avoid learning or fatigue effects. One other internal validity threat lies in
the process of merging of usability problem instances. If we were inconsistent in how we
merged problems, problems might end up at substantially different levels of granularity.
(Consider the difference between, “Users have trouble selecting objects” and, “Users have
trouble understanding how to select objects when using the scale tool.”) The former would
likely attract a higher severity rating, and would also be more likely to be detected by all three
methods. Aware of this potential threat, we tried to write problem descriptions that were
much more like the latter than the former, and took a conservative approach to the merging
of problems. Unfortunately, there is no simple test for success; merge rates naturally vary
with the frequency of a problem’s occurrence, as well as its level of granularity.
Generalizing to other tasks
The conclusions of this experiment may depend to some extent on the chosen modeling
tasks. SketchUp is a large and complex application; it is not possible to comprehensively
evaluate its usability by choosing a few representative tasks. That said, we tried to choose
tasks that are representative of new user goals (building and furnishing a room, and
constructing a simple model). The results should at least generalize to these broader classes
of modeling tasks. As mentioned previously, it is important to keep task goals precise to
reduce false alarms due to changes of goal.
Generalizing to remote settings
The pilot experiments described in Chapter 3 suggested that paired-participant retrospectives may be critical to the success of backtracking analysis. Extending the method to work in
remote usability tests would require finding a way to facilitate paired discussions outside of
the laboratory. The same challenge exists when attempting to generalize to natural settings
in which the participant is not aware of the experimental apparatus.
4.3 comparison to self-reporting: adobe photoshop
69
Generalizing to other applications
This experiment showed that backtracking analysis was effective for testing a single
application, Google SketchUp. Backtracking analysis should generalize to work with the
broader class of creation-oriented applications, such as word processors and page layout
tools. Section 4.3 describes a follow-up study, which repeated the same experiment with the
Adobe Photoshop application.
Generalizing to other evaluators
The evaluator effect [57] for traditional usability testing is also a concern for backtracking
analysis. Since a single evaluator was responsible for identifying usability problems, it is
possible that some of the findings of this study would not generalize to other evaluators.
Hopefully, this effect is smaller for backtracking analysis than for traditional testing (since in
backtracking analysis the episodes are automatically selected). The follow-up study described
in Chapter 6 employs multiple evaluators to mitigate this concern.
4.3 Comparison to self-reporting: Adobe Photoshop
Encouraged by the positive results from the Google SketchUp study, we conducted a second
experiment to see if these results would generalize to another application, Adobe Photoshop.
Photoshop is an enormous application, with many use cases: creating digital artwork,
retouching photographs, authoring flyers/posters, etc. Since it was impossible to test all of
these use cases in a single usability study, we decided to focus the evaluation on Photoshop’s
facilities for basic image retouching. The design of this study was quite similar to the
previous; the following sections describe only the important differences.
4.3.1
Recruitment
For this study, we recruited 28 participants, of whom 24 provided usable data (see Section
4.3.3). These participants covered all different experience levels with image manipulation in
4.3 comparison to self-reporting: adobe photoshop
70
Photoshop. All participants responded to flyers posted in academic buildings at Stanford
University.
Of the 24 participants in the experiment, there were 15 graduate students, 8 undergraduate students, and one software engineer. The 23 students hailed from the following
departments: Computer Science (10); Management Science and Engineering (2);
Undeclared (2); Sociology (1); International Relations (1); Mechanical Engineering (1);
Electrical Engineering (1); Aero/Astro (1); Economics (1); Classics (1); Design (1); and
Energy Resources Engineering (1).
Participants described their prior experience retouching images in Photoshop (fixing
colors, removing imperfections, etc.). Of the 24 participants, 3/24 (13%) said that they had
never used Photoshop for this purpose, 11/24 (46%) described themselves as novices, 6/24
(25%) described themselves as intermediate users, and 4/24 (17%) described themselves as
experts. As compensation for a 90 minute session, each participant received $20.
4.3.2
Usability testing procedure
As with the SketchUp experiment, this experiment was divided into 90-minute sessions.
Due to laboratory space constraints, we recruited participants in smaller groups (2 at a time,
rather than the 5-7 in the SketchUp experiment). Each participant worked on an identically
configured installation of Photoshop CS3. The workspace was configured according to the
software defaults, with a few exceptions: we enabled the history palette, placing it between
the navigation and color palettes. Also, we changed the tool palette from one-column mode
to two-column mode, to match the format used in the video tutorial.
The instrumentation of Photoshop differed somewhat from that of SketchUp. Since
the tasks in this study were modification-oriented rather than creation-oriented, erase was
not a useful command to the participants. After pilot testing found no instances of erase
events, we decided to simplify the protocol instructions by removing erase events from the
retrospective session. We added instrumentation for two types of “partial undo” commands
4.3 comparison to self-reporting: adobe photoshop
71
available in Photoshop. The first is the history brush command, which allows the user to
brush a region of any past image into the current image. The second is the fade command,
which allows the user to blend the current image with the previous image in the command
history. As described in Chapter 3, it was possible to instrument the application using the
“history log” feature, avoiding having to make any modifications to the source code.
The 90 minute experiment was divided into the same five sections as in the
SketchUp experiment: Training in Photoshop (15 minutes), Training in Identifying
Critical Incidents (20 minutes), Practice (10 minutes), Modeling Task (15 minutes), and
Retrospective Commentary (30 minutes).
Training in Photoshop (15 minutes)
To familiarize everyone with the basic layout of the Photoshop interface, participants
watched one 15-minute training video prepared by the researcher. The training video was
modeled after the first chapter of the Adobe Photoshop “Classroom in a book.” [38]. This
video covers a basic introduction to the tools, image adjustments, palettes, and filters. It also
includes the help system and undo functionality. A full transcript is included in Appendix B.
Training in Identifying Critical Incidents (20 minutes)
The training was similar to what was provided for SketchUp. A transcript of the training
video is included in Appendix B.
Practice (10 minutes)
Participants were given 10 minutes to practice using Photoshop and reporting critical
incidents. Participants were provided with a “rubber duck” image (the same image used in
the training video), and were allowed to freely explore the interface during this time.
4.3 comparison to self-reporting: adobe photoshop
72
FIGURE 4.8. The “tulips” task in the Adobe Photoshop usability test. Beginning with the
image on the left, participants first rotated and cropped the image. If they finished early,
they attempted to increase the saturation of the tulips, emphasize highlights on the statue,
and change a tulip’s color from yellow to red. [Photo by Andrew Faulkner, afstudio.com]
Modeling Task (15 minutes)
We randomly assigned participants to one of two tasks: some completed the “tulips” task
(FIGURE 4.8), while others completed the “portrait” task (FIGURE 4.9). As in the SketchUp
experiment, each task had two phases; if participants finished the first phase, they received
printed instructions for the second (more difficult) phase. See the figure captions for
descriptions of the specific instructions provided to participants.
As in the SketchUp experiment, we did not encourage participants to think aloud as
they worked with Photoshop. It is possible that some of the difficulties that participants
experienced thinking aloud in SketchUp would not have occurred with Photoshop. In
particular, Photoshop does not require users to think in 3D, as SketchUp does; this might
mean that more of a user’s thought process is encoded in verbal short term memory (as
opposed to visual short term memory [26]). Experimenting with concurrent think-aloud
protocols in Photoshop is left as future work.
4.3 comparison to self-reporting: adobe photoshop
73
FIGURE 4.9. The “portrait” task in the Adobe Photoshop usability test. Beginning with the
image on the left, participants first changed the eye color from brown to blue, and
brightened the teeth. If they finished early, they removed both earrings, reduced eye
shadows, and changed the background color from white to grey. [Photo by Rick Hawkins]
Retrospective Commentary (30 minutes)
Immediately following the completion of the task, the system automatically processed the
video to extract 20 second episodes centered around each undo, fade, history brush, and selfreported incident. For the purposes of the retrospective, fade and history brush commands
were considered types of undo commands; all three types of undo episodes were merged into
longer episodes when they overlapped.
4.3.3
Usability problem extraction
The data analysis process for this study was almost identical to that of the SketchUp study.
To facilitate controlled comparisons between experiments, the same researcher was
responsible for processing the data and extracting usability problems. TABLE 4.2 summarizes
4.3 comparison to self-reporting: adobe photoshop
74
SketchUp
# participants
# episodes (total)
# self report episodes
# backtracking episodes
# episodes discarded for lack of clarity
# of clear backtracking episodes
# of clear backtracking episodes marked as false alarms
# overlapping pairs of self-report/backtrack episodes
# usability problem instances
# incidental problem instances
# unique usability problems
problem merge rate
severity rating agreement (test set, before discuss)
severity rating agreement (test set, after discuss)
severity rating agreement (all problems)
35
353
101 (29%)
252 (71%)
29
232
63 (27%)
50
215
35 (16%)
95
2.26:1
0.75
0.90
0.82
Photoshop
24
264
125 (47%)
139 (53%)
57
111
13 (12%)
18
223
14 (6%)
106
2.10:1
0.86
0.98
0.82
TABLE 4.2. A summary of the usability problem extraction process for the SketchUp and
Photoshop experiments, shown side by side for comparison.
the data analysis process for Photoshop, referencing the numbers from SketchUp alongside
for comparison.
Discarding participants whose data were unusable
From an original set of 28 participants, we removed one participant because of a screen
capture glitch. We also removed one participant because he did not finish his retrospective
during the time allotted. We removed one participant because his partner did not show up,
requiring us to pair him with the experimenter during the retrospective. Finally, we removed
one more participant because his non-native English commentary was often unintelligible
to the experimenter. Removing the data from these 4 participants left 24 participants, whose
data proceeded to the next phase of analysis.
4.3 comparison to self-reporting: adobe photoshop
75
Discarding unclear episodes
The 24 participants produced 264 episodes (130 undo episodes, 125 self-report episodes, 6
history brush episodes, and 3 fade episodes). Cumulatively, this equates to an average of 11
episodes per person, or 0.73 episodes per minute of Photoshop usage. From this initial set of
264 episodes, we discarded 42 episodes (16%) because the combination of commentary and
screen capture video was not clear enough for the researcher to extract a complete usability
problem instance. We discarded an additional 15 episodes (6%) in which the user could not
remember enough about the episode to answer any of the retrospective questions.
As shown in TABLE 4.2, the number of unclear episodes was significantly higher for
Photoshop than for SketchUp. One possible reason is that Photoshop is a much more
complex application than SketchUp, with many hidden modes and settings that cannot be
inferred from screen capture. Another possibility is that the Photoshop tasks involved subtle
modifications to images, making it much more difficult to infer the user’s progress in the
task by examining screen capture (in contrast to SketchUp, in which the user’s progress is
evident from the state of their 3D model).
This process left 207 episodes (102 undo episodes, 96 self-report episodes, 6 history
brush episodes, and 3 fade episodes).
Discarding false alarms
From the remaining set, we identified 16 episodes (8%) that contained no identifiable
usability problems. Three of these false alarms were from self-report episodes (two accidental
presses of the ‘Report Issue’ button, and one error induced by a window focus problem with
the reporting button itself). The remaining false alarms were due to backtracking events that
failed to indicate usability problems. Thus, the overall false alarm rate for backtracking
episodes was 13/111 = 11.7%.
Of the 13 backtracking false alarm episodes, 5 were purposeful uses of the history
brush to clean up along the edges of deliberately sloppy brush operations. Three false alarms
4.3 comparison to self-reporting: adobe photoshop
76
resulted from intentional uses of the fade command to modulate the effect of an image filter.
Two false alarms resulted from reversing purposeful explorations, in which participants were
simply experimenting with Photoshop to learn its functionality. One false alarm occurred
because the user continued to work after he was told to stop. (He rushed his work, making a
slip.) One false alarm occurred when a user purposefully cleared his selection to get a better
view of his image, then used undo to recover the selection and continue working on it.
Finally, one false alarm was a duplicate of the window focus problem described in the
preceding paragraph.
Identifying usability problem instances
After all of the data preparation steps described above, 191 episodes remained. A researcher
analyzed these episodes to extract 223 usability problem instances. As with SketchUp, the
mapping from episodes to usability problems instances was many-to-many. There were 14
problem instances that were incidental to the triggering event, and 18 overlapping pairs of
undo/self-report episodes.
Merging usability problem instances
Next, a researcher merged the 223 problem instances to form 106 unique usability problems.
Again, we took a conservative approach to the merging process, matching instances only
when their differences were superficial. The merge rate was 2.10:1, which is similar to what
was found for SketchUp. The full list of usability problems can be found in Appendix A.
Coding for problem severity
Three knowledgeable Photoshop users coded each of the usability problems for severity, and
were compensated with gift checks worth approximately $30 / hour. For rating impact/persistence, we reused the scale from the SketchUp experiment (see TABLE 4.1).
Initially, we also planned to reuse the frequency scale from the SketchUp experiment.
However, piloting this approach for Photoshop revealed a floor effect. Since Photoshop has
4.3 comparison to self-reporting: adobe photoshop
77
so many features, only a small percentage of which would be used during any particular
session, almost all of the problems found in the study would be rated a 1/5 or 2/5 on the
frequency scale. To allow for better resolution on the low end of the frequency scale, we
replaced the 1-5 ordinal scale with a 0-100 ratio scale. Raters were given the following
instructions:
Out of 100 Photoshop users, how many would experience this problem during a
typical session? (A rough estimate is fine.) Keep in mind that a problem will not occur if the relevant application feature is not used.
Your answer should be between 0 and 100. Answer ‘0’ only if you think the problem
would almost never happen.
To calculate a single severity score for each rater, we multiplied the two scales together,
resulting in a severity score between 0 and 500 for each problem. Raters could visualize the
score for each problem in the spreadsheet, and could also see the effect of the scores on the
relative severity rank for each problem. They adjusted their ratings until the relative ranks of
all problems matched their intuition. (This was a slight change to the severity rating process
for SketchUp, in which raters were unaware of how the frequency and impact/persistence
scores would be combined into a single rating.)
The 106 problems were rated as part of a larger set of 179 problems, including an
additional 73 problems found in a subsequent study (see Chapter 6). We divided the 179
problems into three sets: a training set (7 problems), a test set (10 problems), and an
independent set (162 problems). Coders used the training set to discuss the severity scales
and resolve differences in coding styles. Next, they independently rated the 10 problems
from the test set, and then discussed the differences and adjusted their ratings. Finally, they
independently rated the remaining 162 problems.
As in the SketchUp experiment, we used Cronbach’s Alpha [28] to estimate the
consistency of the three raters. Since the relative ordering of problems is more relevant than
the absolute scores, we estimated inter-rater reliability on the ordinal ranks of each set of
4.3 comparison to self-reporting: adobe photoshop
78
number of problems
15
10
5
5
5
mild
10
15
20
medium
25
severe
severity rank (1-26)
FIGURE 4.10. A histogram of the severity rank of problems discovered in Adobe Photoshop by
any of the three methods. The median rank was 6.
problems. Before the discussion, Cronbach’s Alpha was 0.86; after coders adjusted their
ratings, it increased to 0.98. Coders then independently rated the remaining 162 problems.
For the final set of 106 problems in this study (using the adjusted ratings from the test set),
Cronbach’s Alpha was 0.82.
To reduce the effect of individual outliers, we chose the median of the three scores as
the severity score for each problem. We then ranked all problems according to the median
scores, producing an ordinal severity scale for all problems. (Problems with the same score
were assigned to the same rank.) A histogram of the severity rankings is shown in FIGURE
4.3 comparison to self-reporting: adobe photoshop
79
4.10. Inspecting the final ranked list of problems, we assigned categories to ranges of
problems. Problems with median scores from 0-9 (ranks 1-10) were labeled as mild, those
between 10-19 (ranks 11-16) were labeled as medium severity, and those with scores >= 20
(ranks 17-26) were labeled as severe.
4.3.4
Results
Comparison between backtracking and self-report
FIGURE 4.11 depicts the number of problems detected by each method or set of methods.
On the left are the results for all problems, while on the right are the results for problems
rated as severe. The data show that backtracking events (undo/history brush/fade)
combined to detect 66 of the 106 problems, while self-reporting detected 76. Focusing on
the most severe problems, backtracking and self-reporting each detected 14 problems.
self-report (76) backtracking (66) self-report(14) backtracking(14)
40
36
30
all problems
5
9
5
severe problems
FIGURE 4.11. Two Venn diagrams depicting the number of usability problems detected in
Adobe Photoshop by each of the two methods or combination of methods. The left diagram
shows the results for all problems, while the right diagram focuses on problems rated as
severe. Problems in the middle of each Venn diagram were detected by both methods, while
those on the outsides were detected by only one method. Note that backtracking events
detected the same number of severe problems (14) as self-report.
4.3 comparison to self-reporting: adobe photoshop
80
The “partial undo” commands (history brush and fade) played a minor role in the
study. There were only 9 such episodes, and 8/9 of these episodes represented false alarms.
Thus, it seems likely that these commands are too infrequently used in Photoshop to form
effective indicators of usability problems, and also that their use tends to indicate false
alarms. A caveat to keep in mind is that the tasks and participants in this study are not a
statistically valid cross-section of the population of Photoshop tasks and users in the real
world.
FIGURE 4.12 (left chart) estimates how the problem reporting numbers would vary
with the sample size (see Appendix D for the estimating procedure). This estimate suggests
that backtracking analysis would continue to slightly underperform self-reporting as the
sample size decreases, for Photoshop. As was found in the SketchUp experiment, there
appears to be a substantial benefit to combining the two techniques.
Est. number of
problems found
back +
self
100
100
self
back
75
50
25
25
20
number of participants
Photoshop
back +
self
back
self
75
50
10
Est. number of
problems found
10
20
30
number of participants
SketchUp
FIGURE 4.12. Problem detection curves shown for Photoshop (left), compared against the
curves for SketchUp (right). The charts estimate how the effectiveness of each usability
evaluation method would depend on the number of participants. The three curves shown in
each chart represent the number of problems detected by backtracking analysis (BACK), selfreport (SELF), and backtracking + self-report (BACK+SELF). Each estimated curve was formed
by randomly choosing smaller groups of participants from the original set, and estimating
how many problems the smaller groups would have found, on average.
4.3 comparison to self-reporting: adobe photoshop
81
Correlation between Problem Severity and Method
As in the SketchUp study, we investigated how median problem severity varied across
methods and combinations of methods. The median severity rank for problems found only
by backtracking was 6, for self-reporting was 4, and for problems found by both methods
was 6. Using the Kruskal-Wallis test, we tested for statistically significant differences among
the three medians. The result was marginally significant (χ2(2) = 5.67, p = 0.06).
We also ran pair-wise comparisons, using the Mann-Whitney non-parametric test.
It seemed possible that problems found uniquely by backtracking analysis (median severity =
6) tend to be of higher severity than those found uniquely by self-reporting (median severity
= 4). However, the difference in medians was found to be non-significant (z = -1.36, p =
0.18). The only significant difference was found when comparing self-reporting problems
with problems found by both methods (z = 2.32, p. 0.02). This difference is consistent with
the trend identified in the SketchUp experiment, that problems found by multiple methods
tend to be more severe than those found uniquely by individual methods.
Reasons problems were not reported
As in the SketchUp study, self-report failed to detect some of the problems found by
backtracking analysis. Of the 49 responses to the retrospective question about reasons for
not reporting, 19/49 (39%) indicated a failure to report because the participant blamed
herself for the problem rather than Photoshop. Another 14/49 (29%) said that the problem
was too minor to report. Another 10/49 (20%) said that they should have reported the
problem, but simply forgot. Interestingly, 5/49 (11%) said that they did not report the
problem because they thought the testing task was not realistic. (This may reflect a
difference between the testing tasks, and how these particular participants use Photoshop in
their daily life.) And finally, one participant said that he did not report a problem because he
could not imagine a way to fix the software to avoid the problem. These results echoed the
concerns with attribution of blame identified in the SketchUp experiment. If anything, the
4.3 comparison to self-reporting: adobe photoshop
82
failure to self-report was worse in this study, as it extended to severe problems: self-report
detected only 14/19 (74%) of the severe problems, as opposed to 22/25 (88%) of the severe
problems in the SketchUp study.
4.3.5
Discussion
This section reviews the possible validity concerns with this study, and concludes by
comparing the results of this study to those of the SketchUp study.
Internal validity
To minimize threats to internal validity, we counterbalanced the order of the retrospective
questions and attempted to ensure consistency in the granularity of problem descriptions
across conditions.
Generalizing from this experiment
The main contribution of this experiment is to generalize the results from the SketchUp
experiment to a second creation-oriented application (helping to address this particular
concern about external validity). The other external validity concerns from the SketchUp
study still remain; caution should be exercised in generalizing to other tasks, settings, or
evaluators.
Comparing SketchUp and Photoshop
TABLE 4.3 compares the key results from the Photoshop and SketchUp experiments. It is
evident from both studies that backtracking analysis and self-reporting detect comparable
numbers of usability problems, and that this similarity is consistent across problem severity
levels. It is also evident that backtracking analysis performed somewhat better with
SketchUp than with Photoshop. There are two possible reasons for the difference in
performance. First, consider that the numbers for backtracking analysis in this study include
undo events only; since the tasks involved modification of existing content, there were no
4.4 summary
83
SketchUp
Severe
Medium
Mild
Total
TABLE 4.3.
Self-report Backtracking
22
23
28
31
15
20
65
74
Photoshop
Diff
Self-report Backtracking Diff
14
14
0%
+ 5%
+ 11%
10
10
0%
+ 33%
52
42 - 19%
+ 14%
76
66 - 13%
A comparison of the number of usability problems found in each experiment.
erase events. Second, consider that Photoshop is a much more complex, full-featured
application than SketchUp. A much larger percentage of the problems in Photoshop
involved feature discoverability. These problems often failed to induce backtracking events,
unless the participant did not know what feature to look for (and therefore searched for the
feature by trial-and-error, requiring the repeated use of undo).
The false alarm rate for backtracking analysis in this experiment was only 12%,
which is considerably lower than in the SketchUp experiment (27%). However, recall that
most false alarms in the SketchUp experiment could be attributed to two specific uses of the
erase command. In contrast, the false alarms found in Photoshop were more varied, as
described in Section 4.3.3.
4.4 Summary
This chapter described two experiments that compared backtracking analysis with the userreported critical incident technique. The experiments measured the effectiveness of
backtracking analysis in two ways: the number of problems detected, and the percentage of
false alarm episodes. In both studies, we found that the number of problems detected by
each method was comparable, and verified that this result held for the problems rated as
severe. Like most event-based approaches, backtracking analysis did produce false alarms,
but at lower rates than we expected (27% in the SketchUp study, and 12% in the Photoshop
study).
4.4 summary
84
These results are particularly exciting because backtracking analysis may provide a
viable method in circumstances where self-reporting is not an attractive option. (Consider,
for example, “in the wild” studies where users are often more interested in getting their work
done than reporting problems with the interface [31].) The following two chapters present
follow-up studies to better understand why backtracking analysis fared so well in this
comparison, and how backtracking analysis might compare to other usability evaluation
methods besides self-reporting.
5
The Role of Task Design
in Backtracking Analysis
This chapter explores the role that task design plays in the success of backtracking analysis. It
answers the following research question:
Q4:
How does the type of task affect the types of usability problems and false
alarms indicated by backtracking events?
The following sections introduce taxonomies of backtracking purposes (Section 5.1) and
user tasks (Section 5.2), and a theory to relate them (Sections 5.3 and 5.4). The theory
proposes that any creation-oriented task can be described along two axes: the specificity of
the task goals, and the specificity of the methods used to achieve these goals. This task
taxonomy can be used as a map for different classes of backtracking behavior, and the types
of usability problems and false alarms that each class of behavior detects.
5.1 A taxonomy of backtracking purposes
As Chapter 4 revealed, backtracking commands can serve a variety of purposes for the user,
only some of which are useful indicators of usability problems. The following sections divide
85
5.1 a taxonomy of backtracking purposes
86
backtracking behaviors into six categories based on the intention of the user. To arrive at the
six categories, we began by considering the data from the empirical studies in Chapter 4, and
then extended the taxonomy to include other known uses of backtracking. The categories
are summarized briefly in TABLE 5.1, and described in more detail in the following sections.
Backtracking as recovering from errors
One of the primary purposes of backtracking is to allow users to recover from errors. As
discussed in Chapter 2, Lewis and Norman classified errors into two categories: mistakes
and slips[68]. In a mistake, the intention of the user is inappropriate. For example, a user of
Photoshop might mistakenly believe that the color replacement tool is the right tool for
adjusting the brightness of the image. In a slip, the intention is appropriate, but the action
performed is erroneous. For example, a user of Photoshop might accidentally slip with the
mouse while defining a selection with the lasso tool. Backtracking commands are useful for
recovering from both mistakes and slips; both types of errors are useful indicators of
usability problems.
Purpose Description
recovering from errors
exploring the interface
exploring design
alternatives
reversing temporary
actions
understanding action
consequences
reversing undesirable
system actions
TABLE 5.1.
Backtracking can be used to reverse mistakes of intention, or slips
of action.
Backtracking establishes a safety net for exploring and learning an
interface.
Backtracking provides a transient mechanism for exploring
alternative designs.
Backtracking facilitates temporary actions that help us to think or
work more efficiently.
Backtracking helps us to understand the consequences of an
action (e.g., in a cycle of undo/redo/undo/redo…)
Backtracking enables us to reverse actions initiated by the system
(e.g., automatic spelling corrections).
A list of the purposes of backtracking commands, from a user’s perspective.
5.1 a taxonomy of backtracking purposes
87
Backtracking as exploring the interface
Backtracking also provides a safety net for purposefully exploring the features of an interface
and learning its functionality. Whether to consider learning-related backtracking episodes as
false alarms depends on the goals of the usability evaluation. If learnability is not an
important usability goal, or the user succeeds in learning the interface without much
difficulty, then the backtracking episode is more likely to be considered a false alarm. In the
Photoshop and SketchUp experiments described in Chapter 4, learnability was an
important goal, and most learning-related difficulties were reported as usability problems.
There were, however, two instances in which a participant learned a piece of functionality
with little difficulty, and these instances were classified as false alarms. Both of these
learning-related false alarms occurred in the Photoshop experiment.
Backtracking as exploring design alternatives
Backtracking also provides a transient way to explore design alternatives – if a design change
is unacceptable, one can backtrack and try a different solution. Like the previous category,
these uses of backtracking would usually represent false alarms from a usability perspective.
There were no examples of backtracking as design exploration in either of the experiments
from Chapter 4, probably because the task goals were so clearly specified.
Backtracking as reversing temporary actions
We define a “temporary action” as any purposeful action that helps the user to think or
work more efficiently, but is intentionally meant to be reversed at some point in the future.
Examples from the studies in Chapter 4 include the construction of temporary construction
lines in SketchUp, and the temporary clearing of selections in Photoshop for visibility
purposes. Backtracking operations that result from reversing temporary actions are not
indicators of usability problems, but rather indicate sophisticated, intentional uses of
backtracking.
5.2 a taxonomy of tasks
88
Backtracking as understanding action consequences
One way to understand the effect of an action on a system is to cycle back and forth between
the previous and current state using undo and redo. There were no examples of this behavior
in either of the experiments in Chapter 4. In SketchUp, most commands have obvious,
visible consequences to the 3D model, obviating the need for undo/redo cycling. In
Photoshop, many commands have a preview checkbox that fulfills the same purpose as
undo/redo (but before the command is executed).
Backtracking as reversing undesirable system actions
Not all actions are user-initiated. Consider when a word processor makes a spelling
correction on behalf of a user. The user may reverse this action to correct the system and
return to the original spelling. This kind of backtracking behavior often indicates
dissatisfaction on the part of the user, and can sometimes be an indicator of usability
problems related to the automation. The episodes of this type that we observed were false
alarms related to the erasure of system-drawn lines in SketchUp, which users sometimes kept
for aesthetic reasons.
5.2 A taxonomy of tasks
It is proposed that any creation-oriented task can be described along two axes: the specificity
of the task goals, and the specificity of the methods used to achieve these goals. While there
are other task dimensions from which one could construct a taxonomy, the value of these
particular dimensions is that they form a useful map for backtracking behaviors (see Section
5.3).
5.2 a taxonomy of tasks
89
high
“build this footbridge;
we won’t tell you how.”
“build this footbridge;
use the rectangle and
extrude tools.”
Goal
specificity
“build anything;
we won’t tell you how.”
“build anything;
use the rectangle and
extrude tools.”
low
low
Method specificity
high
FIGURE 5.1. A continuous two-dimensional space of usability testing tasks. The vertical axis, goal
specificity, encodes how precisely the task goals are specified. The horizontal axis, method
specificity, encodes how precisely the methods for achieving these goals are specified. While the
space is actually continuous, examples are illustrated in each quadrant of the space.
FIGURE 5.1 depicts a continuous two-dimensional space defined by these two axes. To
illustrate the meaning of each axis, examples are provided that would fall into each of the
corners of the space. When both method and goal specificity are low (lower left), we give
participants very little guidance; we tell them to build whatever they want, and we don’t tell
them how to do it. When method and goal specificity are both high (upper right), goals are
specified with high precision, and methods are specified as step-by-step protocols; we tell
participants exactly what to build, and how to build it. When method specificity is high but
goal specificity is low (lower right), we provide general advice on strategies, but little
constraint on the goal. Finally, when goal specificity is high and method specificity is low
5.3 dependence of backtracking behavior on task
90
(upper left), we provide specific task goals, but little guidance on how to accomplish them.
The usability testing tasks from Chapter 4 fall in this corner of the space, since they highly
specified the goals, but did not provide any information on how to accomplish them.
The following section introduces a theory to describe the expected relationship between the type of task and the type of backtracking behavior that is likely to occur.
5.3 Dependence of backtracking behavior on task
Some backtracking behaviors can occur at any point in the task space. This includes
recovering from slips, reversing temporary actions, reversing system actions, and understanding action consequences.
The other backtracking behaviors are more interesting, because they only occur in
parts of the space. Backtracking associated with recovery from mistakes (faulty intentions)
will tend to happen when the method specificity is low, which forces the user to plan
sequences of actions. Similarly, backtracking associated with interface exploration will occur
most often when one is not being told precisely what to do – when the method specificity is
low. Backtracking associated with design exploration only happens when there is freedom to
explore alternative designs – when the goal specificity is low. This helps to explain why the
false alarm rate for backtracking analysis was so low for the Chapter 4 studies – these studies
provided specific instructions on task goals. FIGURE 5.2 summarizes the relationship
between the task type and the backtracking behavior one can expect to see.
5.4 Choosing a point in the task taxonomy
These relationships between task type and backtracking behavior have implications for the
effectiveness of backtracking analysis. To reduce false alarms, it is important to choose tasks
that have high goal specificity (to avoid design exploration false alarms), but also high
method specificity (to avoid learning-related false alarms). To find a wider variety of
usability problems, it is important to choose tasks that have low method specificity (which
5.4 choosing a point in the task taxonomy
91
high
recovering
Goal
from mistakes
specificity
exploring the
interface
exploring design alternatives
low
low
Method specificity
high
FIGURE 5.2. Mapping of backtracking purposes onto the two-dimensional task space.
Backtracking associated with recovering from mistakes (faulty intentions) will only happen
when the method specificity is low, which forces the user to plan sequences of actions.
Similarly, backtracking associated with interface exploration will only occur when we are not
being told precisely what to do, in other words, when the method specificity is low.
Backtracking associated with exploring design alternatives only happens when there is
freedom to explore alternative designs – when the goal specificity is low.
should reveal more usability problems indicated by “mistake” errors). The testing tasks from
Chapter 4 fall into the upper left quadrant, resulting in more mistake problems and
interface exploration false alarms, but fewer design exploration false alarms.
For an evaluation team, choosing a point in the proposed task space clearly depends on
other factors in addition to those that dictate the effectiveness of backtracking analysis.
TABLE 5.2 presents some of the most common usability testing requirements, and how to
satisfy these requirements by choosing a point in the task space. For example, to study early,
unstable prototypes, one may want to specify goals and methods that avoid unfinished
5.5 summary
92
sections or known bugs. The tradeoffs described here are already well-known in usability
evaluation practice; the contribution of this section is to organize these tradeoffs with
respect to the two-dimensional task classification space.
5.5 Summary
This chapter introduced taxonomies of backtracking behavior (Section 5.1) and usability
testing tasks (Section 5.2), and a theory to relate them (Section 5.3). This theory suggested
how the parameters of the testing task might affect the types of problems found by
backtracking analysis, and the types of false alarms that might occur. It also led to several
predictions (Section 5.4). First, high goal specificity should result in fewer backtracking
alarms from design exploration. Second, low method specificity yields a wider variety of
usability problems, including those related to mistakes of intention. Third, high method
Testing
Requirement
Advised task
choices
testing unstable
prototypes
focusing on specific
aspects of a UI
establishing
cognitive context
providing goals to
lab subjects
ensuring
reasonable goals
ensuring
reasonable methods
increasing
task engagement
increasing
task realism
specific goals,
specific methods
specific goals,
specific methods
specific goals,
specific methods
specific goals
specific goals
specific methods
freeform goals
freeform methods
Explanation
Specific goals and methods can be used to avoid
unfinished sections or known bugs.
Specific goals and methods can make it easier to
answer specific questions.
Knowing a participant's goals and strategies can
help evaluators to understand her actions.
Participants in a laboratory study may find it
difficult to invent their own tasks to attempt.
Without guidance, participants may choose task
goals that are completely infeasible.
Without guidance, participants may choose
strategies that are completely infeasible.
Participants’ motivation increases when given
task choice [Russell and Grimes 2007].
In the real world, tasks rarely come with specific
hints for how to accomplish them.
TABLE 5.2. Common usability testing requirements (left column), and the implications
of these requirements for choosing points in our two-dimensional task space (middle
column). An explanation is given in the right column of each row.
5.5 summary
93
specificity raises fewer backtracking alarms from interface exploration.
This theory is currently untested, and hence the predictions take the form of hypotheses rather than results. A first step toward testing the theory would be to collect data
from different points in the task space by varying the goal and method specificity of the
tasks. This direction for future work is described in more detail in Chapter 7.
5.5 summary
94
6
The Strengths and Weaknesses
of Backtracking Analysis
This chapter addresses the fifth and final research question about backtracking analysis:
Q5:
What are the strengths and weaknesses of backtracking analysis, compared
to other usability evaluation methods in current practice?
Answering this question required comparing backtracking analysis with a commonly-used
usability evaluation method. The user-reported critical incident technique compared with in
Chapter 4 is primarily a research technique, with little real-world adoption thus far in the
usability laboratory setting. Instead, for this comparison we chose traditional laboratory
usability testing.
Many variants of traditional laboratory testing exist, differing in their recommendations for running the tests and analyzing the results. Complicating matters, there is little
data about which variants are used most often in practice. There is, however, some
commonly-cited popular literature describing commonly-agreed best practices for laboratory
testing [33,34,93]. This study’s implementation of traditional laboratory testing follows the
advice of these best practices.
95
6.1 recruitment
96
We conducted a between-subjects empirical usability study of Adobe Photoshop (n =
48), comparing backtracking analysis with “best practices” traditional laboratory usability
testing conducted by a professional usability test moderator. After running the study, three
professional usability evaluators identified usability problems from both conditions. This
study resulted in two types of data: quantitative data (usability problem counts and severity
ratings), and qualitative data (semi-structured interviews with the professional evaluators).
This data were used to assess the strengths and weaknesses of backtracking analysis in three
ways. Section 6.5.1 evaluates the cost-effectiveness of backtracking analysis, finding it to be
significantly more cost effective than traditional laboratory testing when usability testing is
performed in groups of at least four participants. Section 6.5.2 compares the types of
usability problems found by backtracking analysis and traditional testing, revealing that
traditional testing may be better suited for identifying problems related to feature
discoverability and strategy formation. Section 6.5.3 investigates the practical applicability of
backtracking analysis, finding that usability evaluators were most excited about the use of
paired-participant retrospectives.
The following sections detail the recruitment process, experimental procedure, data
processing, results, and conclusions.
6.1 Recruitment
For the backtracking condition of the experiment, we reused usability problem data from
the previous Adobe Photoshop study (described in Chapter 4, Section 2). For the traditional
laboratory study condition, we recruited an additional 24 participants from Stanford
University. Participants in both conditions responded to flyers posted in academic buildings
at Stanford University.
We were careful to control for participants' prior expertise in Photoshop, in forming
the sample for traditional laboratory testing. To accomplish this, we recruited the
6.1 recruitment
97
participants for traditional testing within levels of Photoshop expertise, so as to match the
distribution of expertise in the backtracking sample. The 24 participants in each condition
had the exact same distribution of responses to the question asking them to rate their prior
experience retouching images in Photoshop. Of the 24 participants in each condition, 3/24
(13%) had never used Photoshop before for this purpose, 11/24 (46%) described themselves
as novices, 6/24 (25%) described themselves as intermediate users, and 4/24 (17%)
described themselves as experts.
We did not make any attempt to control for the educational/work background of
participants across conditions. Of the 24 participants in the traditional condition, there
were 10 graduate students, 13 undergraduate students, and one professional graphic
designer. This represents a trend toward undergraduate students in the traditional
condition, compared to the backtracking condition in which there were only 9 undergraduates. (We investigated whether this trend might confound the results of the study; see
Section 6.5.1.) The students in the traditional condition were from the following
departments: Undeclared (6); Computer Science (3); Management Science and Engineering
(2); Electrical Engineering (1); Economics (1); Engineering (1); Race and Ethnicity (1);
Civil and Environmental Engineering (1); Materials Science (1); Statistics (1); Education
(1); Architectural Design (1); English/Political Science (1); Art and Art History (1); and
Mathematics/Economics (1). For a 60 minute session, each participant received a $15 gift
check.
For the traditional condition, we recruited a professional usability test moderator to
run each session, and three professional usability evaluators to identify and report usability
problems. The moderator had two years of experience running usability tests as a user
experience researcher with two organizations (a design consulting company, and a software
company). She also had formal training in conducting usability tests while a Masters
Student. The three usability evaluators (whom we will refer to as Evaluator A, Evaluator B,
6.2 usability test procedure
98
and Evaluator C) had considerable industry experience in usability evaluation, and varying
degrees of experience with the Adobe Photoshop application. Evaluator A was a user
experience analyst with 18 months of experience conducting and analyzing think-aloud
usability tests. He described himself as an expert user of Photoshop, with prior job
experience developing Photoshop plug-ins for image retouching. Evaluator B was a freelance
usability consultant, with general expertise in design, rapid prototyping, and usability
testing. He had 10 years of experience moderating and evaluating think aloud usability tests,
both in his role as a consultant, and as an employee at a financial institution and a security
startup company. Before the test he was a beginning user of Photoshop, but had extensive
experience with other software for image editing and technical illustration. Evaluator C was
a freelance usability consultant with ten years of experience moderating and evaluating
think-aloud usability tests. She had the least experience of the three with Photoshop; she had
only used it occasionally to touch up her own personal photographs, and described herself as
a high-novice or low-intermediate user.
The usability test moderator received $2,500 as compensation for conducting the
entire test, while usability evaluators each received $1,500 for their work. Evaluator C
volunteered to work without payment. All three evaluators received a copy of Photoshop
CS3, graciously donated by Adobe.
6.2 Usability test procedure
For the backtracking condition, we reused data from the experiment described in Section
4.3. Please refer back to this previous section for a complete description of the experimental
protocol. The remainder of this section describes the test procedure for the traditional
laboratory testing condition.
The traditional laboratory experiment was performed at Stanford University (see
FIGURE 6.1 for a photograph of the laboratory setup). The computer was configured with a
6.2 usability test procedure
99
copy of Adobe Photoshop CS3, and screen capture recording software. We also placed a
single video camera behind the desk, aiming the camera to provide a clear view of the
participant’s face and body.
To facilitate comparison at the level of individual participants, we designed the experimental protocol for the traditional condition to approximately match the session length of
a typical session of backtracking analysis. Recall that each backtracking session was 90
minutes in length, but approximately 30 minutes of that time was spent on the selfreporting portion of the study (20 minutes of training in self-reporting, and approximately
10 minutes of retrospective commentary specific to self-report episodes). Accordingly, we
designed each traditional laboratory testing session to last 60 minutes.
Each 60 minute traditional laboratory test was divided into the following sections:
greeting (2 minutes), training in Photoshop (15 minutes), instructions on thinking aloud (3
minutes), practice (10 minutes), tasks (25 minutes), and retrospective (5 minutes).
Greeting (2 minutes)
Since the moderator plays a much more active role in traditional laboratory testing than in
FIGURE 6.1. The experimental setup for our traditional usability test of Adobe
Photoshop. Each participant worked alongside a professional test moderator, who
directed the participant to think aloud while attempting a task in Photoshop. We
recorded the interactions using screen capture software, and a video camera (visible in
left image) aimed at the participant’s face.
6.2 usability test procedure
100
backtracking analysis, we devoted careful attention to the initial greeting process. The goals
of the greeting included explaining the purpose of the study, making the participant as
comfortable as possible with the moderator, clarifying each person’s role in the study, and
obtaining informed consent. A rough transcript of the greeting is provided in Appendix B,
but the moderator adlibbed somewhat rather than reading verbatim from the script.
Training in Photoshop (15 minutes)
The training video was identical to that used in the previous study. Please refer to Section
4.3 for details.
Practice (10 minutes)
Participants were given 10 minutes to practice using Photoshop. As in the backtracking
condition, participants were provided a “rubber duck” image, and were allowed to freely
explore the interface during this time. The moderator purposefully did not ask participants
to think aloud during the practice phase. This was done for consistency with the backtracking study, in which participants did not think aloud. Pilot studies had also revealed a
concern that participants might explore the interface less thoroughly when their actions
were being actively watched by an observer. Accordingly, the moderator moved to the other
side of the room during the practice phase, and did not ask the participant to think aloud.
Training in Thinking Aloud (3 minutes)
To prepare the participant to think aloud while working on the task, the moderator
provided some training in how to effectively think aloud. She emphasized the distinction
between giving explanations and thinking aloud, encouraged the participant to speak as if
alone in the room, and informed the participant that she might occasionally interrupt to
remind the participant to think aloud, or ask questions. The moderator demonstrated the
think aloud process while replacing the staples in a stapler. She then asked the participant to
practice thinking aloud while refilling the tape in a tape dispenser.
6.3 usability problem extraction
101
Modeling Task (25 minutes)
As in the backtracking analysis study, we randomly assigned participants to one of two tasks:
half completed the tulips task, while the other half completed the portrait task. For
descriptions of these tasks, please refer back to Section 4.3. Note that the time allotted for
the task was 10 minutes longer than the time allotted in the backtracking condition; we did
not make any attempt to control for task time across conditions. (It would be difficult to
devise a fair control for time on task even if we had wanted; the think aloud process is likely
to change the speed at which participants are able to complete the task.)
The moderator followed the advice of Dumas and Loring in deciding how to interact
with each participant during the task [33]. This included advice on how to keep participants
talking, how and when to ask probing questions, how and when to provide encouragement,
how to deal with failure, and how to provide assistance (when needed). The complete
instructions are included in Appendix B.
Retrospective (5 minutes)
Immediately following the completion of the task, the moderator interviewed the
participant. This interview provided a chance for the moderator to ask follow-up questions,
and to probe the participant’s understanding of features used during the task. At the end of
the interview, the moderator always asked the participant for suggestions to improve the
software.
6.3 Usability problem extraction
This section describes the process for extracting usability problems from the raw data.
6.3.1
Training the usability evaluators
Usability evaluation is a subjective process; different evaluators may identify different
usability problems when reviewing the same data [57]. To help mitigate this effect, we
6.3 usability problem extraction
102
provided some instructions to the evaluators. The complete set of instructions is included in
Appendix B, highlights of which are described below.
To instruct evaluators in identifying usability problem instances, we provided a list of
criteria for identifying usability problems from Jacobsen et al. [57]. We also provided Table
1 from Skov and Stage [101], which classifies usability problems along two dimensions: how
the problem is detected, and how the problem impacts the user. Hornbæk and Frøkjær used
these same two resources to train usability evaluators to identify usability problems in a
recent study of problem matching techniques [53].
Identifying usability problems sometimes involved extra work in the backtracking
condition, because of a complication in reusing the data from the previous study. The
complication arose when a backtracking episode overlapped with a self-report episode, and
the commentary for the self-report episode was collected first. We resolved this in the same
manner that we handled overlapping episodes in the previous experiment; we included the
commentary from the overlapping self-reporting episode as additional evidence. We asked
evaluators to ensure that the evidence of a problem was visible in the backtracking episode
before reporting a problem described in the overlapping self-report episode.
We also provided instructions on how to report usability problem instances. To report a problem, evaluators filled out a form answering the following four questions:
1.
What actually happened in this episode, and what did the user say about it?
(2-3 sentences)
2.
How did the user work around the problem, if at all? (1-2 sentences)
3.
What was the broader context in which the problem occurred? What was the
user trying to accomplish? (1-2 sentences)
4.
Provide a one-sentence headline for the problem.
To help ensure that evaluators provided useful problem descriptions, we provided three
“golden rules” for reporting usability problem instances:
6.3 usability problem extraction
103
1. Focus on describing symptoms rather than inferring causes.
2. Avoid trying to read users' minds when describing their intentions or thoughts;
rely on evidence.
3. Clearly distinguish between the user's actions and explanations.
We specifically instructed the evaluators not to generalize their own instances to form new
problems; their job was only to report individual instances.
To ensure that evaluators had a chance to practice identifying and reporting usability
problem instances, we asked them first to evaluate a separate “training set” of four
participants (two participants from each condition, balanced according to the testing tasks).
The data obtained during this training phase was not included in the final results. After each
evaluator had finished reporting problems for the training set, we provided feedback on
problem identification and reporting. Evaluators B and C seemed to be classifying many
learning-related difficulties as false alarms; we reminded them that learnability should be
considered an important goal. We also needed to remind Evaluator C that it was not
necessary to report a problem for every backtracking episode; some might represent false
alarms.
6.3.2
Collecting usability problem reports
After the training was complete, we partitioned the original set of 48 participants into 3 sets
of 16 participants, one set for each evaluator. We randomly assigned participants to
evaluators, subject to the following constraints:
•
Each evaluator was assigned to 8 participants from the backtracking condition, and
8 participants from the traditional condition.
•
Each evaluator was assigned to 8 participants who attempted the “portrait” task, and
8 participants who attempted the “tulips” task; these task assignments were also balanced 4/4 within each experimental condition.
6.3 usability problem extraction
•
104
Each evaluator was assigned approximately the same distribution of participants’
prior Photoshop experience. (Some experience levels were not divisible by 3, so there
were slight differences across evaluators.)
To mitigate learning effects during evaluation, we required the evaluators to alternate
between conditions as they worked (participant 1 from backtracking, participant 2 from
traditional, participant 3 from backtracking, participant 4 from traditional, etc.)
This process resulted in 219 problem reports, including 72 backtracking reports and
147 traditional reports. Most of these reports originated from Evaluators A (94/219, 43%)
and B (97/219, 44%); Evaluator C, who had considerably less experience with Photoshop,
submitted only 13% of the reports (28/219). This asymmetry amongst the evaluators led us
to consider Evaluator C separately when evaluating the cost effectiveness of backtracking
analysis (see Section 6.5.1).
6.3.3
Generating usability problem instances
A researcher inspected all 219 problem reports to generate usability problem instances. In
most cases, the mapping was one-to-one; we simply copied the report description to form an
instance of a usability problem. There were a few exceptions, described below.
In some cases, there was no clear description of a difficulty apparent in the report.
(The evaluator was not clear what had happened, and could not pinpoint the difficulty.) We
discarded these 13 reports (5 backtracking reports, and 8 traditional reports). We discarded
one additional traditional report because the evaluator had misinterpreted the task
instructions, blaming a user for failing to accomplish a subtask that was not required.
Discarding these 14 reports yielded 205 problem reports (67 backtracking reports, and 138
traditional reports).
In some cases, a single problem report contained more than one separate instance of a
usability problem. We split such reports into individual usability problem instances. This
process resulted in an additional 13 usability problem instances (9 backtracking instances,
6.3 usability problem extraction
105
and 4 traditional instances). After the splitting process, we had compiled a final list of 218
usability problem instances.
6.3.4
Merging usability problem instances
A single researcher merged the 218 problem instances to form 134 unique usability
problems. As in the studies from Chapter 4, we took a conservative approach to the merging
process, matching instances only when their differences were superficial. The merge rate was
1.63:1, which is somewhat lower than what we found in previous studies. (It is likely that
traditional laboratory testing results in fewer duplicate problem instances than typically
found in backtracking analysis.) The full list of usability problems can be found in Appendix
A.
6.3.5
Coding for problem severity
Three knowledgeable Photoshop users coded each of the usability problems for severity. The
134 problems were rated as part of a larger set of 179 problems, which included 45 problems
from the self-reporting study described in Chapter 4, Section 2. Please refer to this earlier
section for a description of the rating process and inter-rater reliability scores.
A histogram of the severity rankings for the 134 problems in this study is shown in
FIGURE 6.2. (Problems with the same score were assigned to the same rank.) Inspecting the
final ranked list of problems, we assigned categories to ranges of problems. Problems with
median scores from 0-9 (ranks 1-9) were labeled as mild, those between 10-19 (ranks 10-14)
were labeled as medium severity, and those with scores >= 20 (ranks 15-24) were labeled as
severe. (The score ranges used to distinguish severity labels are the same as used in the
Photoshop self-reporting study, Chapter 4, Section 2.)
6.4 interviews of usability evaluators
106
number of problems
found by both methods
15
found only by backtracking
found only by traditional
10
5
5
mild
10
15
medium
20
severe
severity rank (1-24)
FIGURE 6.2. A histogram of the severity rank of problems discovered in Adobe Photoshop
by either backtracking analysis or traditional laboratory testing. The median rank was 5.
6.4 Interviews of usability evaluators
To supplement the quantitative data, we interviewed each of the evaluators individually to
capture the qualitative aspects of their experience with the two methods. The interviews
followed a semi-structured format, and lasted for approximately one hour each. We
structured the interviews around the following questions:
•
What do you see as the overall strengths and weaknesses of backtracking analysis?
•
What types of problems do you think backtracking analysis is best for finding? What
types of problems does it tend to miss?
6.5 results
107
•
How do you think backtracking analysis could be improved?
•
As an evaluator, how hard do you think that backtracking analysis is to learn to do
well?
•
What experience do you think an evaluator needs for backtracking analysis, and how
does this compare to the experience required for traditional lab testing?
•
Would you recommend backtracking analysis as a technique to a colleague? For
what kind of a product/problem/situation?
•
What other techniques would you combine backtracking analysis with (in a single
session, or in a set of studies on a single product)? In what ways do you see those
techniques being complementary?
•
Suppose someone asked you to do a cost benefit analysis of backtracking analysis
compared with traditional usability testing, to help them decide which to use. How
would you describe the cost/benefit tradeoffs for backtracking analysis vis a vis traditional lab testing?
6.5 Results
This section presents an analysis of cost effectiveness (Section 6.5.1), a characterization of
the problems found and missed by backtracking analysis (Section 6.5.2), and a discussion of
the usability evaluation contexts in which backtracking analysis might be most useful
(Section 6.5.3).
6.5.1
Cost effectiveness of backtracking analysis
This section presents some initial conclusions regarding the cost effectiveness of backtracking analysis, compared with traditional laboratory usability testing.
6.5 results
108
Measuring costs and benefits
To analyze cost-effectiveness, we first chose metrics for benefits and costs. As in the rest of
this dissertation, we measured the benefits of a usability evaluation method by computing
the total number of unique usability problems discovered. We measured the per-participant
cost of a usability evaluation method in terms of test moderation (expert hours spent
overseeing the running of the test), and test evaluation (expert hours spent analyzing and
reporting the results). We purposefully did not include the costs of recruiting, recognizing
that these costs would be consistent across methods, and will vary greatly depending on the
setting and location.
When measuring moderation costs, there is a key difference between traditional laboratory testing and backtracking analysis. In traditional laboratory usability testing, perparticipant test moderation costs are fixed, but in backtracking analysis they depend on a
single parameter (k): the number of participants that can be tested simultaneously with a
single human moderator. Doubling k effectively halves the cost of moderating the test. In
this particular experiment, limitations of laboratory space and computer hardware forced us
to run only two participants at a time (k = 2). However, the pilot studies with Google
SketchUp demonstrated that it was possible to test with as many as eight participants
simultaneously, with no significant strain placed on the moderator. To take into account the
scalability of backtracking analysis, the following cost-benefit analysis projects moderation
costs for k = 4, and k = 8, and reports the observed moderation costs for k = 2.
To account for evaluation costs, each of the three evaluators for this study recorded
the amount of time that they spent reviewing the videos and writing problem reports. In the
backtracking condition, evaluators recorded the time that they spent reviewing each
individual episode (regardless of whether the evaluator reported any problems for that
episode). In the traditional condition, evaluators reported the total time they spent
reviewing the entire video for a participant.
6.5 results
109
Aggregate cost-benefit analysis
An initial cost-benefit analysis, which aggregates results across all evaluators, is shown in
TABLE 6.1. At k = 2 (two participants per session, as in this study), backtracking analysis was
approximately 12% more efficient than traditional lab testing (35 minutes per problem in
backtracking analysis, compared to 40 minutes per problem with traditional testing). As the
number of participants per session increases, backtracking analysis would perform
significantly better. At k = 8, backtracking analysis would be approximately twice as efficient
as traditional laboratory testing. Since we have not yet tested with group sizes bigger than 8,
it would be inappropriate to extrapolate beyond k = 8. (It is certainly possible that a large
enough group would require multiple moderators to coordinate, effectively preventing the
cost from scaling.)
Was the number of undergraduate students across conditions (10 in the backtracking condition vs. 15 in the traditional condition) partially responsible for the difference in
cost effectiveness? To investigate, we compared the average number of usability problem
instances found for undergraduates and graduates. Summing across both conditions, the 21
graduate students accounted for 130 problem instances (an average of 6.2 instances per
Traditional lab testing
moderation time
evaluation time
total time
usability problems found
hours/problem
36:00
28:40
64:40
96
0:40
Backtracking analysis
k=8
4:30
12:54
17:24
53
0:20
k=4
9:00
12:54
21:54
53
0:25
k=2
18:00
12:54
30:54
53
0:35
TABLE 6.1. An aggregate cost-benefit analysis comparing traditional laboratory testing
and backtracking analysis. Moderation costs for backtracking analysis are projected for
different group sizes (k). The bottom row shows the aggregate number of hours required
to discover each unique usability problem; when k = 8, backtracking analysis is approximately twice as efficient as traditional lab testing. Note that evaluation time was much
shorter for backtracking analysis (in part because there was less video to watch, and in
part because evaluators reported fewer problems in this condition.)
6.5 results
110
graduate student), while the 25 undergraduate students accounted for 190 problem
instances (an average of 7.6 instances per undergraduate student). Since there were more
undergraduate students in the traditional condition, and undergraduates tended to account
for more problems, any confound of this type would bias the results against backtracking
analysis, not in favor of it.
Visualizing cost vs. benefit
FIGURE 6.3 provides a more detailed view of the data, plotting cost (hours of moderation
and evaluation time) vs. benefit (number of unique usability problems found). Each curve
shows a particular usability evaluation method; there is one curve for traditional usability
testing, and there are three curves for backtracking analysis (k = 2, k = 4, k = 8). The shape
of each curve was estimated by randomly sampling subsets of the original set of 24
participants in each condition, and computing the costs and average benefits for each subset
size. One can interpret these curves as meaning, “For a given amount of time one is willing to
spend on evaluation method X, how much benefit is expected?” Note that each curve
terminates at a different point along the cost axis; this is because the analysis is limited to the
24 participants for each condition (and the cost of running all 24 participants depends on
the evaluation method and its parameters).
The area of the chart above the traditional testing curve represents situations in
which backtracking analysis is more cost effective than traditional laboratory testing. As
evident in the figure, backtracking analysis outperformed traditional testing in this study for
k = 4 and k = 8, and is comparable to traditional testing for k = 2. The greatest advantage is
shown for k = 8, where backtracking analysis is approximately twice as cost effective as
traditional laboratory usability testing.
6.5 results
111
traditional
100
Benefit
(problems
found)
75
backtracking
k=8 k=4
k=2
50
25
20
40
60
Cost (hours moderating and evaluating)
FIGURE 6.3. A detailed cost-benefit analysis comparing backtracking analysis with traditional
usability testing. This chart plots costs (expert hours moderating and evaluating) vs. benefits
(number of unique usability problems found). Costs for backtracking analysis are projected
for three different test group sizes (k). To estimate the shape of each curve, we randomly
sampled subsets of the original set of 24 participants in each condition, and computed the
costs and average benefits for each subset size. For clarity of illustration, we have divided the
costs of running each backtracking analysis session evenly amongst the participants in the
session; a plot of the raw data would include discontinuities at multiples of the group size.
Note that each curve terminates at a different point along the cost axis, since the costs of
running all 24 participants depends on the evaluation method and its parameters. The
termination points correspond to the values listed in Table 6.1 (aggregate analysis).
It is tempting to try to extrapolate the cost-benefit curves for backtracking analysis
beyond the measured cost values. Eyeballing the chart, it seems possible that the curves for
backtracking analysis and traditional testing might cross at some point far along the cost
axis. Such a crossing-point would make sense from a theoretical perspective; since there are
certain problems that backtracking analysis is poorly suited for detecting, backtracking
analysis may detect asymptotically fewer problems than traditional testing. In an effort to
investigate this possibility, we did try fitting our data to a binomial model [83], but the fit
6.5 results
112
was quite poor. To improve upon this, we would need to apply a more sophisticated model
of the usability evaluation process -- one which takes into account heterogeneity of
problems, and the conditional dependence among problems, evaluators, and tasks. This is
left as future work..
Differences among evaluators
We also looked for differences among the evaluators. TABLE 6.2 breaks down the evaluation
times and numbers of problems found by each evaluator, and FIGURE 6.4 shows individual
cost-benefit curves for each evaluator, side by side. Evaluators A and B were remarkably
similar; the only major difference was that Evaluator B spent less time performing analysis in
the backtracking analysis condition. Evaluator C reported far fewer problems than either of
the others – less than 20% as many problems in the traditional condition, and only about
50% as many problems in the backtracking condition. Evaluator C was also the only
evaluator of the three to spend more time and report more problems in the backtracking
condition than in the traditional condition.
We formed four hypotheses to explain the results for Evaluator C. The first possibility
is that Evaluator C was less motivated since she worked for free. This would help to explain
Backtracking analysis
Traditional lab testing
Eval A
evaluation
time
usability
problems
hours per
problem
Eval B
Eval C
All
Eval A
Eval B
Eval C
All
11:50
11:35
4:44
28:09
4:56
3:15
5:10
13:21
50
53
8
96
25
27
13
53
0:14
0:13
0:36
0:18
0:12
0:07
0:24
0:15
TABLE 6.2. Evaluation times and problems found, broken down by evaluator. While
Evaluator A and Evaluator B were remarkably consistent, Evaluator C reported far fewer
problems. Intriguingly, Evaluator C was the only evaluator who spent more time and
reported more problems in the backtracking condition than in the traditional condition.
6.5 results
113
Benefit (# problems)
60
40
Benefit (# problems)
6
T
B
k=8,4,2
00
0
20
4
Benefit (# problems)
6
T
00
B
k=8,4,2
0
2
16
24
B
2 k=8,4,2
T
0
0
8
4
8
16
Cost (hours)
Cost (hours)
Evaluator A
Evaluator B
24
8
16
24
Cost (hours)
Evaluator C
FIGURE 6.4. A detailed cost-benefit analysis, broken down by evaluator. These three charts,
one per evaluator, plot costs (expert hours moderating and evaluating) vs. benefits (number
of unique usability problems found). For all three evaluators, backtracking analysis was more
cost-effective than traditional testing, for k = 4 and k = 8. Evaluator A and Evaluator B
performed similarly, while Evaluator C reported fewer problems.
the decrease in problem reporting, but not the tendency to report more problems in
backtracking analysis than traditional testing. Moreover, a motivation hypothesis would not
explain why Evaluator C spent more time evaluating the backtracking condition than
Evaluators A or B did. A second possibility is that Evaluator C wanted to please the
experimenter by spending more time on the backtracking condition than the traditional
condition. This would help to explain the tendency to report more problems in backtracking analysis than traditional testing, but does not explain the overall drop in reporting
rates. (We also emphasized to evaluators during training that the intention of the study was
not to demonstrate the superiority of one usability evaluation method over another.) A
third possibility is that Evaluator C may have used a lower threshold for false alarms, seeing
false alarms where the others saw problems. While the study did provide training and
guidelines on identifying usability problems, there was still plenty of room for subjective
interpretation. But like the motivation hypothesis, this hypothesis would fail to explain her
6.5 results
114
tendency to report more problems in the backtracking condition than in the traditional
condition. A fourth possibility is that Evaluator C’s lack of Photoshop expertise made it
difficult for her to detect usability problems. This would help to explain the decrease in the
problem reporting rate, and it might also explain the tendency to report more problems in
backtracking analysis than traditional testing. (Backtracking analysis draws the attention of
evaluators to specific episodes, forcing them to consider the difficulties that a user might
have been experiencing.)
After the experiment, we interviewed Evaluator C to investigate these four hypotheses. Without directly confronting her about the low reporting numbers, we asked about her
level of motivation, how she decided what problems to report, how qualified she felt in
judging the interface, etc. She said that she was highly motivated during the test (explicitly
rejecting hypothesis 1, lack of motivation). Asked what her biggest motivation was, she
stated that she “enjoyed learning a lot about Photoshop” (consistent with hypothesis 4, lack
of domain expertise). Asked how she decided whether to report a problem, she explained
that many difficulties were not worth reporting; they were part of the “natural” way of using
Photoshop (consistent with hypothesis 3, subjectivity of usability evaluation).
Summary
This experiment represents an encouraging first step toward a full understanding of the cost
effectiveness of backtracking analysis. Backtracking analysis certainly seems to be more costeffective than traditional laboratory usability testing, but this experiment should be repeated
with different applications and/or evaluators. It might also be interesting to run a study with
more participants in the backtracking condition, to try to find the hypothesized cross-over
point where traditional laboratory testing begins to outperform backtracking analysis in
terms of cost-effectiveness. A thorough cost-benefit analysis is left as future work, as
described in Chapter 7.
6.5 results
6.5.2
115
Types of problems found and missed by backtracking analysis
This section compares the types of problems found by backtracking analysis and traditional
laboratory usability testing.
Classifying problems by severity
Did the median severity of usability problems differ between backtracking analysis and
traditional laboratory testing? If backtracking analysis was only better for detecting mild
problems, then the cost-benefit results of the preceding section would carry little meaning.
To investigate, we computed the median severity rank of problems discovered with each
method. The median severity for problems found with traditional laboratory testing (6) was
slightly higher than that of backtracking analysis (5). We employed the Mann-Whitney test,
and the result was not statistically significant (z = 0.901, p = 0.34).
We also tested for severity differences between problems found uniquely by either
method, and problems found by both methods. The difference between backtracking (4)
and both methods (11.5) was significant (z = 10.17, p = 0.001). The difference between
traditional (5) and both methods (11.5) was also significant (z = 4.99, p = 0.03). These
results are consistent with the findings of Chapter 4, which also suggest that problems found
by multiple methods tend to be more severe. As discussed in Section 4.2.4, one caveat is that
the Mann-Whitney test assumes that problems are independent. Strictly speaking, problems
are not independent. It is difficult to say how dependence might affect the results of the
analysis.
Employing other problem classification schemes
Classifying usability problems only by their predicted severity leaves something to be
desired; a usability evaluator considering the use of backtracking analysis might want to
know more about the nature of the problems found and missed. Besides severity, how else
can one classify the problems found and missed?
6.5 results
116
To answer this question, we first considered applying an existing usability problem
classification scheme. The User Action Framework (UAF) [10] adapts Norman’s concept of
the user action cycle [86], classifying usability problems hierarchically based on the cognitive
stage at which they occur. At the top level of the UAF hierarchy, problems are categorized as
relating to one of four stages in the action cycle: planning, translation, physical action, or
evaluation. We ran a pilot study applying this top level of the UAF hierarchy to classify the
usability problems found in the SketchUp self-reporting study (see Section 4.2). The interrater agreement among three evaluators was poor, even after two 30-minute training sessions
in the use of the UAF. Consulting with a UAF expert, we were advised that the UAF is
meant to be a “real time” tool, applied while the user is still in the laboratory [47]. As in a
medical diagnosis, the usability evaluator is meant to classify each problem by asking a series
of questions of the participant, gradually ruling out hypotheses. Due to resource limitations,
we rejected the idea of re-running the entire experiment to collect this information.
We considered a simpler scheme, classifying problems as mistakes or slips [68]. A
mistake results when the intention of the user is inappropriate, whereas a slip results when
the actions of a user are inappropriate. However, a quick inspection of the usability
problems found in Photoshop suggests that almost all would be classified as mistakes. To
reach a useful classification scheme, we needed some way of further subdividing mistakes.
Reason further distinguished between “rule-based” mistakes and “knowledge-based”
mistakes [91]. A rule-based mistake involves inappropriate application of a learned rule,
whereas a knowledge-based mistake involves an error encountered while trying to solve a
problem from first principles. However, again there was a problem; nearly all of the
problems found in Photoshop seemed likely to fall into the knowledge-based mistakes
category.
6.5 results
117
Faced with these challenges in applying existing top-down classification schemes, we
invented our own bottom-up classification scheme for the problems found in the
experiment. We established the following categories:
•
Forming strategies: difficulty developing a high-level strategy for accomplishing a
goal (e.g., “What selection tools should I use to make this selection?”).
•
Finding features: difficulty locating an application feature. This category includes
cases when the user knows exactly what she is looking for (e.g., “Where is the lasso
tool located in the toolbar?”), and cases where the user does not yet know what she is
looking for (e.g., how can I make this image darker?)
•
Choosing parameters: difficulty choosing the right parameters for an action (e.g.,
trying many different tolerances for the magic wand tool before finding one that
works).
•
Executing actions: difficulty executing an action with the interface. This category
includes both cases where the user was surprised by the effect of the action (e.g.,
“Why did the dodge tool just change the hue of my image?”), and cases where the
user was frustrated by an expected system response (e.g., “Why does Photoshop always feather selections along the edge of my image?”). It also includes mistaken
clicks of the mouse, or errors using the keyboard.
•
Perceiving state: difficulty interpreting and/or remembering application state. This
category includes mode errors (e.g., “Oops, I thought I had the dodge tool selected”),
and difficulty interpreting state (e.g., “I couldn’t see that there were holes in my selection.”)
For this informal pilot classification, we set aside 28 problems that did not clearly fit into
one of the above categories. We classified the remaining 106 problems (61 uniquely found
by traditional testing, 32 uniquely found by backtracking, and 13 found by both methods),
and the results are shown in FIGURE 6.5.
6.5 results
118
Traditional
Backtracking
0%
25%
50%
75%
100%
finding features
executing actions
perceiving state
choosing parameters
forming strategies
FIGURE 6.5. An informal comparison of the types of usability problems found by traditional
laboratory testing and backtracking analysis. Traditional laboratory testing detected a higher
percentage of problems related to finding features and forming strategies.
Two conclusions are apparent from the data in the figure. The first is that difficulties
related to finding features are much more commonly found by think-aloud testing than by
backtracking analysis. Backtracking analysis only detected feature discoverability problems
when the user did not know what they were looking for, and experimented by trial-anderror. The second conclusion is that difficulties forming strategies were absent with
backtracking analysis. This makes intuitive sense, since these problems generally manifest as
“menu-cruising” behavior or long pauses of inactivity – not as backtracking operations. It
should be emphasized that this is only an initial exploratory classification performed by a
single evaluator. Future work will continue to seek to evolve a problem classification scheme
that yields reliable classifications across multiple independent raters.
We also asked each of the three usability evaluators to speculate on the types of
problems found and missed by backtracking analysis. After some consideration, Evaluator A
volunteered that backtracking analysis might systematically fail to detect feature discoverability issues, confirming what was evident in the data. He admitted that it did find some of
6.5 results
119
these issues, when participants did not know what they were looking for, and experimented
by trial-and-error.
Evaluator B speculated that backtracking analysis might be particularly useful for
identifying problems during fast-paced interaction episodes where participants’ actions are
triggered by muscle memory rather than conscious thought. As he put it,
“People don’t usually talk about actions that are almost reflex, like undo… things that
happen so fast moderators might miss them or participants don’t remember clearly when
asked. Backtracking analysis zeroes in on reflex actions that go by too fast for humans
(even though hang-ups here lead to unfortunate chain reactions and break flow).”
Evaluator B also indicated that backtracking analysis may be particularly ill-suited for
finding “big picture” problems, because the short, automatically selected episodes don’t
always give a complete picture of the participants’ experience. He suggested that it might be
possible to partially address this context issue by providing a short general purpose question
period at the beginning of the retrospective section. One might ask participants about the
hardest parts of the task, for example.
Evaluator C found it impossible to speculate on this topic. It is possible that because
she reported so many fewer problems, she did not have enough examples to effectively
generalize.
6.5.3
How backtracking analysis fits into practice
During the interviews, we also probed evaluators on how they thought backtracking analysis
might fit into usability evaluation practice. Their responses are summarized below.
Suitability for different application types and usability evaluation goals
Evaluator B indicated that he thought backtracking analysis would work better for released
applications than for early prototypes. He suggested that it would not be good for answering
basic questions like, “Do the users even understand our interaction model?” This relates to
6.5 results
120
his earlier comment that backtracking analysis might tend to miss “big picture” problems. In
contrast, Evaluator A said that backtracking analysis was unsuitable for summative
evaluations of complete systems, because it might systematically fail to detect certain types of
problems. He recommended it only for informal, formative evaluations of software.
Evaluator C focused on the expertise of the participants, reasoning that backtracking
analysis tended to work better with expert participants than for novices. She said that
experts tended to “talk about their difficulties more effectively”. These comments from
Evaluator C might have been influenced by her own lack of experience with Photoshop.
Expertise required to be an evaluator
There was no consensus amongst the evaluators concerning the usability or domain
expertise required to be an evaluator. Evaluators A and C thought that the expertise
required to evaluate would be roughly the same as for traditional usability testing. Evaluator
B said that he believes that prior usability evaluation experience is less important in
backtracking analysis. Since backtracking analysis is less subjective and more systematic, he
indicated that even an engineer with no usability experience might be able to function as an
effective evaluator. He did provide a caveat: a less-trained evaluator would need to have an
open mind about usability problems; backtracking analysis would not help anyone who was
“determined to be skeptical” of the existence of usability problems in the interface.
Combining backtracking analysis with other methods
Both Evaluators A and B suggested combining backtracking analysis with real-world usage
log data. Among other things, this would indicate which system commands are most often
reversed, giving a real-world context for the usability problems found by backtracking
analysis.
For Evaluator B, the chief concern when choosing between usability evaluation methods was not cost-effectiveness, but thoroughness. Backtracking analysis might provide a
6.5 results
121
way to catch problems that would otherwise be missed during traditional testing. As he put
it, “I think I would like a system that makes sure I go through all the undos during the
retrospective.” He suggested building support for this into usability testing software tools
like Morae [4]. He also suggested that a positive attribute of backtracking analysis is that it
does not interfere with a participant’s natural interaction with the software. Since
backtracking events are logged without the participant’s knowledge, quantitative measures
such as task time or error counts are not tainted by the experimental manipulations.
Evaluator C suggested combining backtracking analysis with eye tracking data; she
thought that this additional context would help her to interpret the episodes, and might also
help the participant to remember what was happening in the episode during the retrospective.
Paired participant retrospectives
While we did not specifically ask for feedback on the use of paired-participant retrospectives, all three evaluators expressed excitement about this technique. Evaluator B was
particularly keen on the idea. Pairing up the participants, he said, makes participants more
comfortable in admitting their mistakes. Since each participant has attempted the same task,
they can empathize with each other and understand the context of each others’ difficulties.
As he said,
“A big problem with think aloud is that people make up explanations to preserve their
image of themselves as being competent and logical. One thing I like about backtracking
is that it addresses this by pairing you up with another participant who has been
through similar experiences; it's not so hard to admit that you got confused, especially
because you are instantly confronted with video evidence.”
On the other hand, Evaluator B did raise a concern about the retrospective nature of the
commentary in backtracking analysis. There is, he explained, a “theatrical” aspect to
6.6 discussion
122
convincing developers that usability problems should be addressed, and it often helps to
extract video clips showing evidence of users having emotional responses to a problem. He
noticed that participants were often laughing about their problems when they reviewed
them in the retrospective for backtracking analysis, whereas participants were more often
annoyed or frustrated in the concurrent think-aloud condition. He speculated that
participants become detached from their emotional involvement over time, and that any
usability evaluation method purely based on retrospective analysis would fail to capture their
original, raw emotion.
6.6 Discussion
This section reflects on the results of the experiment, and discusses possible threats to
construct validity, internal validity, and external validity.
Interpreting the comparison
Because backtracking analysis turned out to be so much less expensive than traditional
testing, we could only compare benefits for costs on the low end of the spectrum
(see FIGURE 6.3 and FIGURE 6.4). Nevertheless, these comparisons are meaningful. The 24
participants in the backtracking condition correspond in cost to 11.5 participants in the
traditional condition (when k = 2), 8.1 traditional participants when k = 4, and 6.5
traditional participants when k = 8. These sample sizes (6-11) are within the typical range of
scales for traditional usability tests, indicating that the comparisons are still relevant to
practitioners.
Construct validity
In choosing a single way to operationalize traditional laboratory testing, this study has a
mono-operation bias. One cannot know how the study results might have been different if
we had provided different instructions to the usability test moderator, or the three
6.6 discussion
123
evaluators. Even the choice to recruit different individuals to perform the testing and the
evaluation can be questioned; it is certainly possible that there is an efficiency gain when the
moderator and the evaluator are the same person. (The moderator-evaluator could then
make use of her notes during the evaluation phase.) However, it is also possible that
moderator-evaluators would make more mistakes during evaluation, in the process of
reconstructing what happened from partial memories and hastily-scribbled notes. Follow-up
studies should seek to resolve these competing hypotheses.
Internal validity
As previously mentioned, reusing the backtracking analysis data from a previous study made
it impossible to randomly assign participants to conditions. Without random assignment, it
cannot be certain that the participants in each condition were similar along all important
dimensions. We attempted to compensate for this shortcoming by applying tight statistical
controls on what we considered to be the most significant individual difference factor: the
prior Photoshop expertise of participants. The 24 participants in each condition had the
exact same distribution of prior experience, as measured by self-report.
External validity
This study is limited in scope. Researchers should be cautious when generalizing from the
success observed with backtracking analysis from usability testing experiments in a
laboratory setting with three evaluators, two tasks, and a single application.
However, a broader perspective emerges when one considers the successes of this
study in combination with those of previous studies described in Chapter 4. Together, these
studies suggest that backtracking analysis has proved effective for evaluating two different
applications, with two different types of tasks (creating content vs. modifying content), with
a total of four evaluators with differing backgrounds. This is reason for optimism among
practitioners who consider experimenting with backtracking analysis.
6.7 summary
124
One additional concern about generalizability specific to this study is the reliance on
a single usability test moderator to run all of the studies in the traditional laboratory testing
condition. It is possible that the test results would have differed if we had chosen a
moderator with a different style of interacting with participants. (We are not aware of any
formal studies of the “moderator effect,” but it seems likely that meaningful differences
could exist among moderators.) It is at least encouraging that all three evaluators gave
positive feedback on the job performed by the moderator in this study.
6.7 Summary
The results of this experiment touch upon some the strengths and weaknesses of
backtracking analysis compared to traditional laboratory usability testing. Data from the
experiment revealed that backtracking analysis is significantly more cost effective than
traditional laboratory usability testing, when one takes into account the ability to test
participants in large groups. An analysis of the problems found by each method reveals that
traditional laboratory testing might be better suited for detecting problems related to feature
discoverability and strategy formation. Interviews with the three evaluators provided
information about the practical applicability of backtracking analysis; evaluators were most
excited about the use of paired-participant retrospectives, even outside the context of
backtracking analysis.
The experiment described in this chapter only begins to scratch the surface of these
issues, suggesting avenues for future work. Chapter 7 provides a more in depth look at some
ways to expand upon the study described here.
7
Conclusions and
Future Work
This dissertation has established that backtracking events can be effective indicators of
usability problems, and can provide a scalable alternative to traditional laboratory usability
testing of creation oriented applications. In demonstrating this claim, we employed a
combination of iterative pilot testing (Chapter 3), controlled empirical studies (Chapters 4
and 6), and theory building (Chapter 5). The result of this work is a new cost-effective
usability evaluation method called backtracking analysis. We tested backtracking analysis by
experimenting with two real applications: Google SketchUp (Chapters 3 and 4), and Adobe
Photoshop (Chapters 4 and 6).
7.1 Summary of findings
This section reviews the specific research questions answered by the dissertation. Below each
question, we highlight the most significant findings.
125
7.1 summary of findings
Q1:
126
Is it feasible to automatically characterize usability problems from backtracking
events and their associated context?
It was possible to automatically detect backtracking events in the chosen test applications
without modifying the source code to either application (Section 3.1). A series of pilot
experiments showed that it is possible to automatically characterize usability problems from
backtracking events using a paired-participant retrospective technique (Section 3.2).
Q2:
How do backtracking events compare in effectiveness to other automatic indicators
of usability problems?
An experiment with the Google SketchUp application revealed that backtracking events are
comparable in effectiveness to self-reported difficulties (Section 4.2). Backtracking events
detected 5% more severe problems than self-reporting, and the false alarm rate for
backtracking episodes was 27%.
Q3:
How does the effectiveness of backtracking events generalize across software
applications?
Repeating the above experiment with Adobe Photoshop, generalized the result to another
creation-oriented application (Section 4.3). In this case, backtracking events revealed 87% as
many problems as self-reporting, and the same number of severe problems. The false alarm
rate for backtracking episodes was 12%, less than half what was found with SketchUp.
7.1 summary of findings
Q4:
127
How does the type of task affect the types of usability problems and false alarms
indicated by backtracking events?
Chapter 5 introduced a taxonomy of purposes for backtracking (Section 5.1), and a
taxonomy of creation-oriented tasks (Section 5.2) organized around two dimensions: how
clearly the task goals are specified, and how clearly the methods to achieve these goals are
specified. The chapter also presented a theory explaining what types of backtracking
behavior would occur in each part of the task space (Section 5.3). This theory suggests that
false alarms in backtracking analysis can be reduced by choosing tasks with high goal and
method specificity, but that more usability problems will be identified when the method
specificity is low (Section 5.4).
Q5: What are the strengths and weaknesses of backtracking analysis, compared to other
usability evaluation methods in current practice?
Chapter 6 described a final experiment with Adobe Photoshop comparing backtracking
analysis with traditional laboratory usability testing. We collected usability problem data
and interviewed the three professional evaluators who took part in the study. This data
revealed that backtracking analysis was more cost effective than traditional testing (Section
6.5.1). However, the data also showed that traditional testing might be better suited than
backtracking analysis for revealing problems related to feature discoverability and strategy
formation (Section 6.5.2). Finally, interviewing the professional evaluators revealed that
they were most excited about the use of paired-participant retrospectives as a means of
facilitating useful commentary(Section 6.5.3).
7.2 limitations and near-term future work
128
7.2 Limitations and near-term future work
The limitations of this work primarily relate to the issue of generalizability; one should
exercise caution when generalizing beyond the tasks, settings, applications, and participants
that we were able to test. The following sections suggest directions for future research to
address questions of scope. Section 7.2.1 proposes experiments that would clarify our
understanding of the scope of backtracking analysis. Section 7.2.2 proposes modifications to
backtracking analysis that would seek to expand its scope.
7.2.1
Understanding the scope of backtracking analysis
The following research directions seek to enhance our understanding of backtracking
analysis as it is currently conceived.
Measuring the evaluator effect for backtracking analysis
It is already well-known that usability evaluation in traditional laboratory testing is a highly
subjective process; what is deemed a usability problem by one evaluator may be considered a
false alarm by another [57]. This “evaluator effect” has serious consequences for practice,
since it implies that one cannot trust the judgment of individual evaluators to provide
objective accounts of the usability problems present in a product. The results described in
Chapter 6 teasingly hinted that the evaluator effect may be less severe for backtracking
analysis than for traditional usability testing: the evaluator with less domain expertise
reported fewer problems overall, but the reduction in reporting was much less severe for
backtracking analysis than for traditional testing. However, since each evaluator worked on a
different set of participant data, it was not possible to investigate specific discrepancies in
reporting. It would be useful to conduct a new experiment in which the evaluators worked
on the same set of data. A follow-up study would also benefit from recruiting a larger sample
of evaluators.
7.2 limitations and near-term future work
129
Characterizing the cost-effectiveness of backtracking analysis
Chapter 6 introduced evidence that backtracking analysis may be more cost effective than
traditional usability testing. However, cost effectiveness is a subject of its own, and in reality
would depend on a number of variables: the experience of evaluators, the cost of laboratory
space, the tools available to evaluators, etc. The study in Chapter 6 provides only a single
data point in what is surely a high-dimensional parameter space. Further studies are needed
to more fully explore this space.
Exploring the role of user expertise
Does backtracking analysis work better or worse for studying expert users, compared with
novices? How do experts use backtracking commands differently? The experiments in this
dissertation hinted that problems found by experts were more likely to be slips of physical
action, rather than mistakes of intention (see Section 4.2.4). It also seemed that experts were
more likely to use backtracking as a way to reverse temporary actions (e.g., the erasing
temporary construction lines in Section 4.2.3). However, there were not enough experts in
these studies to formally investigate the role of user expertise in backtracking analysis.
Comparing own-tasks with assigned-tasks
The studies in this dissertation focused exclusively on assigned tasks; participants were given
no choice in the creation goals. There is reason to consider relaxing this restriction; a recent
study by Russell and Grimes [94] demonstrated significant effects of task choice on
motivation level and web search behavior. How would user behavior change if users had
some choice in their task goals, and what would the implications be for the effectiveness of
backtracking analysis?
7.2 limitations and near-term future work
130
Testing the task/backtracking mapping theory
The theory proposed in Chapter 5 was inspired by the results of the experimental studies in
Chapter 4, but the theory itself has not yet been tested. In particular, all of the usability
studies from this dissertation fall within the upper-left quadrant of the task taxonomy (high
goal specificity, and low method specificity). To test the predictions of the theory, one
would need to run additional studies in different parts of the space, and compare the results.
It is certainly possible that one would discover other task-related axes besides goal and
method specificity that would help to differentiate backtracking behaviors.
Exploring alternative command history models
Both of the test applications, SketchUp and Photoshop, utilize a linear command history;
the history of commands is maintained as a simple ordered list of commands. It would be
interesting to try backtracking analysis with other applications that use a branching
command history. It is possible that a branching command history would lead to increased
use of undo to explore design alternatives, increasing the percentage of false alarms for
backtracking analysis. Future studies are needed to test this hypothesis.
Combining backtracking analysis with other methods
Experimentally comparing backtracking analysis with the user-reported critical incident
technique revealed that these two techniques were complementary; there were substantial
benefits to using the two techniques in combination. It would be useful to explore other
usability evaluation methods that might be complementary to backtracking analysis. This
includes comparisons with other event-based critical incident detection techniques (Section
2.4.1), or behavioral/physiological approaches (Section 2.4.2). The professional usability
evaluators from the Chapter 6 study suggested combining backtracking analysis with usage
log analysis techniques, eye tracking studies, or traditional think-aloud usability testing (see
7.2 limitations and near-term future work
131
Section 6.5.3). In each case, it would be valuable to determine the unique contributions of
each method.
Measuring the downstream utility of backtracking analysis
This dissertation measured the effectiveness of backtracking analysis by estimating the
number and type of usability problems that it identifies. But as Wixon has observed, it does
not matter how many problems one finds if these problems do not get fixed in the software
[114]. During the past decade, Wixon and others have advocated alternative metrics for
success that more faithfully capture the “downstream utility” of a usability evaluation
method [58]: how often do the findings of a method lead to actual design changes that
improve the software? A key element of downstream utility not addressed by this
dissertation is persuasiveness; how effectively does a usability evaluation method communicate its findings to developers, convincing them to instigate changes? As described in
Chapter 6, one of the professional usability evaluators speculated that backtracking analysis
might be less persuasive because of its extensive reliance on a retrospective protocol, which
may artificially distance participants from the negative emotions they felt while experiencing
usability problems. Further studies would help to determine the extent to which this is
indeed a limitation of backtracking analysis.
7.2.2
Expanding the scope of backtracking analysis
This section describes ways in which one might adapt backtracking analysis to improve its
scope of usefulness.
Extending outside the laboratory
This dissertation only tested backtracking analysis in laboratory settings. There is a strong
desire to perform usability testing outside of the laboratory, both to increase ecological
validity of the results and to reduce the costs of recruiting participants. However, there are
7.2 limitations and near-term future work
132
several significant challenges associated with “usability in the wild”. First, there are privacy
concerns associated with the data being transmitted back to the developers [103]. Second,
users are typically more interested in getting their work done than in taking time to assist the
design team by explicitly providing contextual information. Nichols and Twidale suggested
strategies to help cope with these two issues [81] (e.g., providing a way for users to track
what happens to their problem reports, or providing them with financial incentives), but the
research in this area is still in its infancy. Regarding backtracking analysis, a first step would
be to adapt the technique to work in remote usability testing (where the users are situated in
their home or work environment, but are still compensated for their participation in the
study). One would need to investigate ways of collecting useful commentary without
physically pairing up participants, as is possible in the laboratory.
Moving beyond creation-oriented applications
It is possible that backtracking analysis would usefully apply to other applications besides
those that are creation-oriented. This includes web search, where the “back” button is
sometimes used as an undo command. One key difference between creation- and noncreation-oriented applications lies in how progress is measured during a task. In creationoriented applications, we measure progress by the state of our creation; are we close to the
end goal we are envisioning? But in non-creation-oriented applications, we often measure
progress by the state of our knowledge. When we press the back button during a web search,
we are not necessarily taking a step backward from the goal. We may have learned something
valuable from the previous search, and pressing back simply enables us to continue the
exploration with a new search. Such innocuous behavior might lead to a high percentage of
false alarms for backtracking analysis.
7.3 technology trends
133
Supporting “think aloud” protocols during test sessions
One of the drawbacks of usability testing in large groups is that it is difficult to gather useful
think-aloud commentary during the tasks. There is no easy way to remind participants to
think aloud when they fall silent, nor is there a way to ask clarifying questions of participants. Moreover, group think aloud might be distracting to the participants; it could be
difficult to “tune out” the commentary of one’s neighbors. If one could somehow overcome
these problems, there would be several benefits. For participants, concurrent think aloud
commentary might improve the ability to remember the episode during retrospective
reviews. For evaluators, concurrent think aloud might improve the ability to understand the
nature of the participants’ difficulties.
7.3 Technology trends
Several trends in technology may make backtracking analysis more of an attractive option to
usability evaluators in the future.
7.3.1
Software instrumentation
Software is becoming increasingly scriptable. The entire Adobe Creative Suite, for example,
allows scripting of the application in a variety of languages (JavaScript, Action Script, and
VBScript). Scripting APIs often allow the programmer to attach “listeners” for particular
events, including backtracking commands like undo and erase. This has the potential to
make it significantly easier to perform the instrumentation required for backtracking
analysis.
7.3.2
Tools for qualitative video analysis
Backtracking analysis may also benefit from the continuing development of tools for
qualitative video analysis. This includes research tools such as VACA [22] and d.Tools [46],
and commercial products such as Morae [4]. These tools can make the evaluation process
7.4 concluding remarks
134
much easier (for example, by seamlessly integrating multiple synchronized video streams
into a single view, or by providing “focus plus context” navigation techniques for viewing the
video around particular backtracking events).
7.4 Concluding remarks
By facilitating automatic detection and characterization of usability problems, this
dissertation has dramatically decreased the costs of moderating a usability test. The cost has
transformed from linear in the number of participants to nearly constant. We’ve done
nothing, however, to address the costs of recruiting, which remain linear in the number of
participants. And we’ve done little to reduce the costs of evaluation, which also remains
linear in the number of participants.
backtracking analysis
finds fewer problems…
Benefit
(# unique
problems
found)
Traditional
in the long run…
Backtracking
… but it finds them
more efficiently!
Cost (recruiting, moderating, evaluating)
FIGURE 7.1. A hypothetical sketch of the long-term cost/benefit relationship between
backtracking analysis and traditional laboratory testing. We suspect that backtracking
analysis finds fewer usability problems in the long term, but those that it does find, it finds
more efficiently. The area of shaded region between the curves indicates the area of
advantage for backtracking analysis.
7.4 concluding remarks
135
FIGURE 7.1 sketches how we hypothesize that backtracking analysis would compare
with traditional laboratory testing in a full cost-benefit analysis. These curves are
extrapolations of the experimental data obtained in Chapter 6, and take into account
recruiting costs as an additional cost factor. The exact shapes of these curves are unknown,
but are not important for the argument below.
As depicted in the figure, it seems likely that backtracking analysis finds fewer problems in the long run, but it finds them more efficiently. To justify the former expectation, it
is certain that there are some problems that backtracking analysis is unlikely to find (see
Section 6.5.2), no matter how many resources are devoted to testing additional participants.
While traditional laboratory testing is not a gold standard, it is likely to find a wider variety
of problems than backtracking analysis in the long run. However, the results from Chapter
6 suggest that backtracking analysis finds problems more efficiently than traditional testing.
The shaded region on the left shows the area of advantage for backtracking analysis.
While there are clear advantages to using backtracking analysis, there is still substantial
room for improvement; it still requires considerable resources to identify problems with
backtracking analysis. This is because backtracking analysis has parallelized the moderation
phase of the study, but the evaluation and recruiting costs still grow linearly with the
number of participants.
How can we make the overall approach more efficient – not just more efficient, but
asymptotically more efficient? We can do this by focusing research next on the challenges of
reducing the costs of recruiting and evaluation. To reduce recruiting costs, what if we could
provide minimal compensation to participants, but still manage to characterize the nature of
their difficulties? Is it possible that users could document usability problems as part of their
normal workflow? While this may sound unlikely, somewhat similar problems have been
addressed successfully with “crowdsourcing” approaches such as Amazon’s Mechanical Turk
[5], or von Ahn and Dabbish’s ESP Game [109]. And to reduce the costs of evaluation,
7.4 concluding remarks
136
what if we could also automatically detect false alarms, and automatically group problems
that are similar? The first is a classification problem, and the second is a clustering problem.
We know how to approach these kinds of problems in computer science.
These possibilities yield a long-term vision for this research. What if we could automate enough aspects of usability evaluation so that the cost becomes a function of the
number of problems in the interface, instead of a function of the number of participants?
What if we could distribute instrumented software into the field, wait for some time, and
receive a set of screen capture video episodes, automatically grouped by distinct usability
problems? It may seem far-fetched, but this dissertation itself seemed far-fetched when the
work began.
A
Usability Problem Data
A.1 Google SketchUp usability problems
The following pages present the data from the Google SketchUp usability study described in
Section 4.2. The “Methods” column indicates which usability evaluation method(s) found
each problem (S = self-reporting, B = backtracking analysis). The Severity column indicates
the median severity score given by the three raters, ranging from 1 (mildest) to 9 (most
severe). The highest observed score was 8 (for problem #12).
ID
Description
Methods
Severity
1
After erasing an edge to join two faces, one user was uncertain if
he had succeeded at joining the faces. It is not clear what the
source of his uncertainty was, but he reported it. He seems to
have taken some time to inspect the results of the action by
orbiting, but then proceeded assuming things were okay.
S, B
1 (MILD)
2
This is a bug in SketchUp that one user encountered, caused by
an interaction between break-edges functionality and the VCB.
If you draw a line that partially overlaps with an existing line,
the new line will automatically break into two segments. If you
subsequently try to change the length of this line by typing a
dimension into the VCB, you will find that SketchUp modifies
the length of one of the two segments, not the original line. The
one user who experienced this problem recovered quickly (in a
S, B
3 (MEDIUM)
137
Appendix A
138
matter of seconds) by redrawing the line so that it did not
overlap with the original.
3
One user experienced the following SketchUp crash: She
double clicked to edit the bed component, then right clicked on
the mattress piece to bring up the context menu. She speculates
that there was nothing remarkable about her interaction
sequence - she does this kind of thing all the time. We have not
been able to reproduce this problem, however, so it may have
been caused by a particular sequence of interaction steps.
S
5 (SEVERE)
4
One user had trouble working on some geometry because other
geometry occluded his view. He commented that he needed a
way to make geometry temporarily invisible. Not knowing how
to do this, he thought that maybe he would move the geometry
away from its occluders, work on it, and then put it back. He
was concerned however that it might be hard for him to return
the object to its original position. He was running out of time
when this happened, but says that it would likely have taken
quite a bit of work to overcome.
S
3 (MEDIUM)
5
One user, looking at a line, thought that it was actually two
parallel lines. He attributes this confusion to the default
rendering style in this build of SketchUp 7, which can make it
look like lines are doubled.
B
1 (MILD)
6
Several users had mentally grouped some of the geometry of the
scene according to semantic relationships (e.g. 'wall'), and
expected tool operations to operate on these groups rather than
the individual points, edges, and faces that SketchUp
understands. They were surprised when their operations only
operated on the individual elements rather than the groups that
seemed salient to them. These problems indicate a lack of
understanding of the system model; geometry in SketchUp is
not grouped by default - you must indicate the groupings that
are relevant, and SketchUp will not infer this. It is hard to
quantify the impact the misconception had, but it is safe to say
that these users were struggling.
S, B
5 (SEVERE)
7
One user struggled to try to understand what combination of
tools he could use to create a smooth surface (the top to the
bridge). His initial difficulty was sufficient that he reported an
issue with his difficulty. He says that he read through the quick
reference card to find the arc tool, and then proceeded from
there. One aspect to this problem was that this user did not
think to combine a smooth curve (such as an arc) with an
existing tool like Push/Pull in order to form a smooth surface.
He instead gravitated toward the 'Follow Me' tool, apparently
not realizing that the Push/Pull tool could be used to create
S
4 (MEDIUM)
Appendix A
139
smooth surfaces.
8
One user developed the following strategy for scaling an object
to a precise size. He scaled the object using the scale tool,
switched to the dimension tool to measure it, then scaled it
again, then measured it again, etc. He says that he knew there
was a better way, but could not think of it.
S
3 (MEDIUM)
9
One user experienced difficulty when he tried to use inferences
to match the lengths of two geometric entities along two
different dimensions (i.e., width and height). He could easily
match one of the dimensions at a time, but could not find a way
to match the other dimension. He mentioned that his prior use
of AutoCAD led him to expect multiple simultaneous
inferences to work. He did not find a workaround.
S, B
7 (SEVERE)
10
When using the 'Value Control Box' to specify precise
dimensions for geometry, users sometimes assume that the
default units are feet (when in fact the default units are inches).
This problem was usually easy to recover from (e.g. 91, 185 and
260), but sometimes caused more serious problems (e.g. 26).
S, B
4 (MEDIUM)
11
One user experienced the following bug with SketchUp: she
used extensive construction geometry to construct four
rectangles that were evenly spaced in a grid. She then erased the
construction geometry (leaving only the rectangles behind) and
pulled upwards with the Push/Pull tool on each of the
rectangles. But her shapes were missing two faces. This may be a
problem with the new break-edges functionality of SketchUp 7,
or it may be unrelated. We have not tried to reproduce the
problem yet.
B
4 (MEDIUM)
12
Sometimes users have difficulty determining whether a set of
points and edges are coplanar. This problem can cause users to
falsely believe that two pieces of geometry are aligned, only to
find out later (e.g. when they orbit to a different viewpoint, or
try to erase what they think is an internal edge) that the two
pieces of geometry were in fact not aligned at all.
S, B
8 (SEVERE)
13
One user tried to select some geometry by clicking and dragging
from right to left, and seemed surprised that he had selected
geometry that only partially overlapped his selection rectangle.
He did not show any evidence of understanding the difference
between left-right selection and right-left selection, and seemed
to expect right-left selection to work like left-right selection.
This problem happened near the end of his session, so it is
unclear if he would have recovered, or how long it would have
taken.
S
4 (MEDIUM)
14
When performing a copy/paste operation, one user expected
B
1 (MILD)
Appendix A
140
that both copies would remain selected after the paste. This
caused him to make a subsequent mistake (since in fact, only
the new copy was selected). See the episode for details - the user
recovered quickly from this mistake.
15
Several users had the problem that the inference that they
wanted SketchUp to provide was hidden by another inference
line that happened to have a similar projection on the screen.
They worked around the problem by orbiting to a different
angle (in which the inference line they wanted had an
unambiguous projection), but they did not immediatley
recognize this as a solution.
S, B
6 (SEVERE)
16
While drawing geometry, some users did not notice inferences
that were being suggested by SketchUp. In some cases this may
have been due to the ability to perceive them on the screen,
while in other cases, the user may not have been paying enough
attention (thinking about the colors or reading the tooltips).
S, B
6 (SEVERE)
17
One user tried to find a single bed in the 'architecture'
collection, but could not find one. She was surprised by this,
expecting to find it there. She proceeded by trying to adapt the
double bed component to form a single bed, a time-consuming
process.
S
3 (MEDIUM)
18
Several users were confused by the 'offset limited' messages that
SketchUp provides when one tries to Push/Pull some geometry
past a parallel face. They see the message 'offset limited' but do
not understand how to continue push/pulling past the parallel
face. This confusion was never overcome in any of the episodes;
nobody managed to figure out why it was happening, or how to
overcome it. (Note that this problem describes the confusion
about the message only - there is a separate problem description
for the expectation that SketchUp should let them perform the
action.)
S, B
6 (SEVERE)
19
After creating a hole, one user judged the result by what he
could see through the hole. Because the background (the other
side of the hole) was similar to the material surrounding the
hole, he had low confidence in his success and spent 10 seconds
making sure that the action had the intended effect.
S
2 (MILD)
20
Several users experienced difficulty when they tried to copy and
paste a rectangle, and align their copy to a point on an existing
rectangle. The paste operation automatically triggered a “Move”
command on the copied geometry, selecting a particular corner
on the copied rectangle as the anchor point for the move. Users
could not find a way to “snap” the copied rectangle into
alignment with the edges of the target rectangle, since the
anchor point did not correspond to any point on the existing
S, B
7 (SEVERE)
Appendix A
141
rectangle. They could not find a workaround, and ended up
with unaligned geometry.
21
Several users, when looking at the icon of a tool, incorrectly
inferred functionality that did not match the real functionality
of the tool. This led them to select the wrong tool and begin
trying to use it. Usually the recovery was quick; users realized
that they had the wrong tool and found the right one. See the
episodes for examples.
S, B
3 (MEDIUM)
22
Several users confused two icons in the toolbar because they
looked similar. See the episodes for details on which icons were
confused and why.
S, B
3 (MEDIUM)
23
Several users had difficulty estimating the lengths of edges in
the perspective view. This caused them to imagine a shape's
geometry to be different from its reality. Consequences
included thinking that one had made a mistake typing in
dimensions in the VCB, and realizing that a shape had much
different proportions than intended. Users recovered from
these problems rapidly.
S, B
3 (MEDIUM)
24
One user was trying to figure out what direction was north in
the scene. He opened the help center and searched for
'coordinate axes,' and then tried searching for 'axes,' but did not
find what he was looking for. In his retrospective commentary,
he also mentions trying to search for 'directions' and 'compass.'
None of these worked. He never did find the solution, but
spent several minutes trying.
S
4 (MEDIUM)
25
Several users had difficulty determining what tool to use to
rescale an entire object (e.g., the bridge). Several tried using the
dimension tool. One tried to edit the label indicating the length
of a segment, hoping that this would actually change the length
of the segment. Another tried using the Move/Copy tool, but
was surprised when only the selected face moved. These
misconceptions took quite some time for them to recover from
(many minutes of wasted effort). This problem is part of a
broader difficulty figuring out how to scale geometry, and in
understanding grouping and selection concepts.
S, B
6 (SEVERE)
26
Several users attempt to use tools (e.g. Push/Pull or
Move/Copy) to operate directly on objects under their mouse
cursor. They assume that SketchUp will 'auto-select' what is
under their cursor, and act on it. This assumption holds true
when there is no existing selection. But if there is an existing
selection, then this existing selection becomes the target of the
action, and the mouse click location becomes irrelevant. See the
episode descriptions for information on the impact that these
problems have.
S, B
3 (MEDIUM)
Appendix A
142
27
One user had difficulty changing the time from AM to PM in
the shadow settings dialog box. He clicked on the text for PM
and tried to type 'AM' on the keyboard. This had no effect at
all. After a short time, he realized that there are buttons to the
right of the text that you can click to change from AM to PM
or vice versa. Once he figured this out, he had no more troubles
with this.
S
1 (MILD)
28
Upon visiting the help center for the first time, one user
expected to find a search box somewhere on the main page.
After searching for 10 seconds, he reported an issue to indicate
that he couldn't find a place to type in a keyword search. Then
he found the button labeled 'search' in the lower left, and it
opened a page in which he could type his search query.
S
1 (MILD)
29
One user could not find a way to decompose the shape he was
drawing (a bridge) into rectangles. As a result, he spent nearly
the entire time modeling the bridge line-by-line with only the
pencil tool, eventually running out of time. He never did get
around the issue and learn to model with the rectangle tool.
B
5 (SEVERE)
30
Several users had a misconception about the meaning of values
typed into the VCB, when *moving* endpoints, edges, or faces.
They thought they were typing in absolute lengths (e.g. 'make
this line 10 feet long') when in fact they were typing in relative
lengths (e.g. 'make this line 10 feet longer than it was'). Neither
of the two participants who experienced this problem learned
from their mistakes. One of them ended up with a bridge with
uneven legs, and did not realize it.
S
4 (MEDIUM)
31
Many users experienced difficulties determining whether edges
were internal (of aesthetic importance only) or structural
(critical to the existence of faces that adjoin them). Believing
edges to be internal when they are actually structural, many
users erased edges only to find the adjoining faces disappearing.
Most of these users recognized the reason that the faces
disappeared (that the edges were not coplanar), but only after
they noticed face(s) disappear after the edge deletion.
S, B
6 (SEVERE)
32
One user, after copying and pasting some geometry, was
surprised that his active tool was changed to the Move/Copy
tool. He accidentally moves some geometry before realizing his
mistake.
S, B
2 (MILD)
33
One user was surprised that the tape measure tool left behind a
construction line that he did not want. He used undo to
remove it. He says that it seemed like a minor issue to him.
B
1 (MILD)
34
One user tried using the 'paste in place' command, and was
confused at whether the command had succeeded at making a
B
1 (MILD)
Appendix A
143
copy of his original object. (He thought that maybe the second
copy was perfectly superimposed on the first one, such that it
was effectively invisible.) Since he could not tell what was
happening, he abandoned this strategy in favor of the regular
paste operation.
35
Several users failed to realize that a hole existed in their model,
and this led them into trouble. They each tried to use the
Push/Pull tool on the hole itself (thinking it was a solid face),
only to discover that they were acting on the geometry that was
on the other side of the hole. One used Push/Pull tool to click
on what he thinks is a rectangle superimposed on the bottom
face of a large rectangle, but in reality he is clicking through a
hole in the large rectangle, and ends up moving the hidden face.
He realized his mistake right away, and draws a rectangle to fill
the hole. Another user clicks with the Push/Pull tool on what
he thinks is a solid face, and ended up clicking through a hole
onto a piece of curved geometry (which SketchUp would not
allow him to move). This user was confused for some time, but
did eventually figure out what was wrong.
B
3 (MEDIUM)
36
One user, while editing a component, became confused at some
point when he finally noticed the display of the local coordinate
system (the three axis lines). He thought that these were lines
that he might have drawn at some point by accident. He did
not attempt to delete them, but commented that they were
confusing.
B
2 (MILD)
37
One user used the Push/Pull tool to drag an arc across the top
of a solid rectangle. He was surprised when he noticed that the
rectangle disappeared when he reached the opposite side. He
was confused for some time, but eventually found a
workaround by drawing a rectangle over the top of the hole
(healing the face).
S
5 (SEVERE)
38
Several users, after invoking the scale tool on a set of geometry,
decided to change the target of the scale operation. They
expected to be able to change the selection while still in the
scale tool, but could not find a way to do this. One even left the
scale tool completely (by selecting the line tool), only to find
out when she returned to the scale tool that it was still focused
on the same old target. One user found a way around the
problem with considerable effort, and the other one gave up.
B
5 (SEVERE)
39
Several users had difficulty estimating whether lines were
parallel in the perspective view. This caused them to imagine a
shape's geometry to be different from its reality. Consequences
included having trouble triggering SketchUp to suggest an
inference line, and not trusting SketchUp's inference
S, B
5 (SEVERE)
Appendix A
144
suggestions.
40
Several users after typing numbers into the 'Measurements' box,
forgot to hit the enter key. They were confused that nothing
happened, and spent a lot of time repeatedly typing and hoping
something would happen. They realized the problem
eventually, but it took them a minute or more.
41
One user experienced difficulty figuring out how to set the
location of the model (so that his shadows would come out
correctly. He expected the location setting to be under the
shadows palette, but it wasn't. He never found it, despite
looking for a long time.
S, B
3 (MEDIUM)
S
4 (MEDIUM)
42
SketchUp Bug - somehow when this user tries to use Push/Pull
on a rectangular face, the Push/Pull tool acts like the Move tool.
(It does not extrude the face into a box, but rather simply moves
it up and down.) Episode 210 has the best commentary.
S, B
4 (MEDIUM)
43
One user experienced difficulty converting three copies of a
grouped set of geometry into instances of a component. He had
laid three copies of his group back-to-back. He couldn't simply
ungroup the geometry and form it into a component, because
in that case the adjoining faces would stick. So he had to delete
the two copies of his group, convert the single copy into a
component, and then re-copy and align the instances of his
component. This was inefficient, but it worked.
B
3 (MEDIUM)
44
Several users were unaware of their selection. One commented
that selected geometry looks very similar to unselected
geometry (see episode #286 end of commentary). Another did
not realize that the floor was selected until it moved along with
the bed he was trying to move. These problems were nuisances
to the two users, but seemed to happen repeatedly.
S, B
4 (MEDIUM)
45
One user found it difficult to tell whether a Copy/Paste
operation had succeeded. His selection was empty at the time of
the copy, and therefore nothing was copied. But neither the
copy command or the paste command gave him feedback that
his selection was empty. He thought that it might have worked
(and that the copy was placed immediately on top of the
original). It took him a while to investigate (since he thought
the two copies were on top of each other).
S
1 (MILD)
46
Several users had difficulty in typing dimensions for rectangles.
Some users forgot to type a comma between the dimensions,
while others were uncertain as to the order of the dimensions.
Some users did not figure out how to type in the dimensions
properly, and resorted to drawing lines (which they could
properly dimension.) Others were able to discover the correct
S, B
5 (SEVERE)
Appendix A
145
syntax by trial and error.
47
Several users found it difficult to draw a rectangle within the
plane that they wanted. SketchUp would infer a different plane,
and it was difficult to override this inference. Users who had
this problem did learn that they could orbit to another
viewpoint from which this problem would not happen.
48
Several users found it difficult to draw an arc within the plane
that they wanted. SketchUp would infer a different plane, and
it was difficult to override this inference. Users who had this
problem did learn that they could orbit to another viewpoint
from which this problem would not happen.
S, B
5 (SEVERE)
S
4 (MEDIUM)
49
Several users had the following strategy for creating the curved
surface to a bridge. They each began by drawing an arc on top of
one of the side faces, such that the top of the arc lay tangent to
the top edge of the face. Then they used the Push/Pull tool to
carve away the geometry above their arc, on both sides of the
arc. When they finished, there was a line joining the seams in
the middle. This seemed to them like an internal edge, but
when they tried to erase it, they found that a segment of their
curved surface disappeared. The did not know how to fix this,
so they undid their erase operation and left the line there.
S, B
4 (MEDIUM)
50
One user became momentarily confused between incremental
and absolute distances, when creating evenly spaced parallel
reference lines with the tape measure tool and typing the
separation distances into the VCB. He was creating three
parallel lines, intended to be spaced evenly 5' apart. He created
the first two successfully, then clicked and dragged on the first
one and typed 5' again. But he needed to type 10' instead, since
he started his drag at the first line, rather than the second. He
recovered right away.
B
2 (MILD)
51
One user tried to scale some geometry by editing a dimension
label, and was surprised to find out that the label was purely
cosmetic; changing it had no effect on the geometry. He says
that his assumption may have come from using other CAD
software, in which editing the label would scale the geometry.
S
3 (MEDIUM)
52
Several users ran into trouble when they used the Move/Copy
tool in a case when the Push/Pull tool would have been more
appropriate. (They clicked on a face with the Move/Copy tool,
but only intended to move it along its perpendicular axis.) Since
the Move/Copy tool has more degrees of freedom, it is easy to
make errors. See the episodes for examples.
S, B
3 (MEDIUM)
53
Several users were surprised to discover that their entire model
was not at the scale that they imagined it to be. Invariably they
S, B
5 (SEVERE)
Appendix A
146
would make this discovery as soon as they made some edge or
face a particular size. It would seem out of proportion to the
rest of their model, which would make them realize that their
perception had been incorrect. One user commented that he
realized in retrospect why the billboard model of Sang is
included in the scene in the default template. This problem was
hugely problematic for those that encountered it. It forced
them to rescale their entire existing model to a reasonable size,
which tended to be a difficult task.
54
Many users had difficulties figuring out how to use the arc tool.
They struggled to determine how many points they needed to
specify, which points they needed to specify, and in what order
to specify them. Often they expected the second point to define
the top of the arch, rather than the second endpoint. Users who
had these problems tended to experience them repeatedly, and
often failed to work around them. One even decided to change
modify his goal so that he would not have to draw an arc.
S, B
3 (MEDIUM)
55
Several users tried to select multiple parallel faces and operate
with the Push/Pull tool on all of them simultaneously. They
were surprised when their selection was reset when they
selected the Push/Pull tool. One user thought that maybe he
had accidentally deselected the geometry himself, so he tried it
again before realizing it would not work.
S, B
2 (MILD)
56
Several users could not figure out how to abort an action in the
middle, while using the line tool. One tried clicking the right
mouse button, saying that this is how AutoCAD works. Some
users eventually discovered that the escape key could be used to
abort an action, but others failed to discover this.
S, B
4 (MEDIUM)
57
Several users tried to click and drag on a point to move it,
regardless of the tool that was selected. This happened with the
arc tool (episode 66) and dimension tool (episode 306). Users
who experienced this problem tended to experience it
repeatedly; eventually they figured out that they needed to use
the Move/Copy tool, but this often took a while to discover.
S, B
5 (SEVERE)
58
Several users planned to split a double bed component into two
single beds by drawing a rectangle through it. It is not clear how
they planned to actually divide the bed simply by drawing the
rectangle. It did not occur to them to scale the width of the
double bed (and remove a pillow).
B
3 (MEDIUM)
59
Many users tried to use the undo command to abort their
current action, and their *previous* action was undone as a side
effect. Users who noticed the extra undo often manually
repeated their previous step, a time consuming process. Some
users did not even notice the extra undo (especially if the
B
5 (SEVERE)
Appendix A
147
change was not visible from their current viewpoint), and
continued oblivious to the fact that they were now missing
important changes to their model.
60
One user was trying to draw a line centered at a point, and had a
small amount of trouble planning the set of steps necessary to
do this. After trying unsuccessfully to draw the full length line
and position it, he eventually settled on a strategy of dividing
the length by 2 and drawing two lines of this length in opposite
directions. (He didn't have to draw two lines; instead, he could
have just dragged the midpoint of the full-length line to align it
to the point.)
B
1 (MILD)
61
Several users were surprised when keyboard shortcuts were
triggered as they tried to type imperial units into the
'measurements' box. Typing 'ft' causes the tape measure tool to
trigger, for example. While users tended to figure out what was
causing the problem, they did not find a workaround. They
abandoned their strategy of typing in precise measurements at
all, resorting instead to approximate alignment of geometry.
S, B
5 (SEVERE)
62
One user had trouble remembering how to move a component
that had already been placed in the scene. After initially placing
a bed component in her scene, she realized that she didn't know
how to move it. She decided it would be easier to drag it again
into the scene and place it, rather than trying to figure out how
to move something that was already placed. She says that she
did know the 'drag' tool but didn't bother to learn how it works.
B
2 (MILD)
63
One user experienced difficulty resizing a rectangle with the
Move/Copy tool. He said that he was surprised that it distorted
into non-rectangular shapes as he dragged on an edge. He
expected that SketchUp would remember that this shape was
created as a rectangle, and keep that rectangle constraint
through the rest of the modeling process. He worked around
the problem by reversing his action and redrawing the rectangle
in the new shape.
B
3 (MEDIUM)
64
One user thought that he was editing a component, when he
was in fact *not* editing it. When he erased a line, the entire
component instance disappeared. (He was expecting that only
the line would disappear.) He realized what was happening and
recovered immediately.
B
3 (MEDIUM)
65
One user thought that he was *not* editing a component, when
he *was* in fact editing it. He was trying to select just one of the
four bedposts and move it. But he did not realize that he was
editing the component (had double clicked on the component).
When editing a component, selecting one instance of a
component selects all instances of it. It took him quite some
B
4 (MEDIUM)
Appendix A
148
time to figure out how to recover, but he eventually clicked
outside the component to recover.
66
Several users reported uncertainty as to whether the dimensions
they typed into the Measurements Box were correctly
interpreted by SketchUp. They wished they had some way to
easily tell whether SketchUp had made their geometry the
dimensions that they intended.
B
4 (MEDIUM)
67
One user accidentally used the 'cut' command instead of the
'copy' command. He realized it as soon as he saw his object
disappear, and attributed this problem to 'me being a
bonehead'.
B
1 (MILD)
68
(This may be a SketchUp bug.) Several users experienced a
surprising difficulty cutting holes in objects, when cutting along
two perpendicular directions. The first hole worked correctly,
but the second failed, even though the edges of the holes are
lined up precisely. This caused quite a bit of trouble for the
participants who experienced it; they eventually worked around
the problem by using the erase tool to get rid of the offending
face, but couldn't understand why the Push/Pull tool wouldn't
cut the hole. See episode #382 for a clear example (and trust
that the top edges are lined up precisely -- or try it yourself).
S, B
3 (MEDIUM)
69
One user had trouble using the Push/Pull tool to align a face to
be parallel with an adjacent face. When he got close to
alignment, he expected SketchUp to automatically snap to the
other face (without him doing anything to initiate the snapping
behavior). Instead, SketchUp kept allowing him to slide
continuously past the point of alignment, which made it
difficult for him to get the two faces exactly aligned. (This must
have happened just before this episode began, but the
commentary is clear enough to understand it.)
B
3 (MEDIUM)
70
One user thought that the 'Create Options' menu item under
'Dynamic Components' would help her to *use* a dynamic
component, rather than to build one. She remained confused
about this for some time, hoping to find a way to automatically
adjust the number of pillows on her bed as she resized it.
S
2 (MILD)
71
Many users experienced difficulties using the control handles in
the scale tool. They often wanted to scale along just one
particular dimension, but did not easily figure out which handle
would accomplish this. Users who had this problem generally
took a long time to recover from it; they eventually figured it
out, but not without some trouble. One mentioned that he
'wasn't going to take the time to read the tooltips,' so they
didn't help him.
S, B
2 (MILD)
Appendix A
149
72
One user encountered this bug in SketchUp caused by an
interaction between break-edges functionality and the VCB.
(This is similar to problem #2, but not the same problem.) The
user drew a line that connected to an existing perpendicular
edge. Next, he drew a second line back some distance along the
original line (so that it overlapped with this line). Next, he
decided to modify the length of this line. But the line that was
modified was not the line he just drew, but a line that was
created by SketchUp internally (by the break-edges logic). This
surprised him, and he concluded that it might be a bug in
SketchUp. He did recover quickly; he says that he undid the
operation and tried it again, and it worked.
S, B
2 (MILD)
73
One user expected measuring distances to work exactly as it
does in Google Earth. He selected the 'tape measure' tool, rightclicked on a point in his model, hoping to find a 'From here'
option, and then planned to click on the end point and select a
'To here'. He easily found another way to measure the distance.
S
1 (MILD)
74
One user selected the paint bucket tool (which opened the
Materials browser), and was surprised that the Materials
browser did not automatically disappear when he selected
another tool. This did not affect his performance; he simply
closed the Materials dialog and continued.
S
2 (MILD)
75
Several users had difficulty determining how to modify the
shape of an existing arc. One user tried clicking on the top of
the arc with the move tool, and was surprised when the entire
arc moved as a unit (instead of changing shape). Another user
thought that the arc tool itself could be used to bend an arc. He
clicked on the arc with the arc tool, and was surprised that a
new arc was generated. None of these users discovered a way to
reshape the arc, without drawing it over again from scratch.
S, B
5 (SEVERE)
76
Several users had difficulty precisely positioning their mouse to
delete sequences of edges; they would alternately click on edges
and press the delete key. When they were deleting large
numbers of edges, they would invariably erase an edge by
accident. They recovered quickly from this, simply by recreating
the missing edge.
S, B
3 (MEDIUM)
77
One user experienced difficulty precisely positioning his mouse
to delete a set of edges; using the Erase tool, he dragged over the
edges that he wanted, but accidentally dragged over an extra
edge. He recovered quickly by replacing the missing edge, and
continuing. (Note: this is different from #75 in that the
behavior was to drag with the mouse, rather than alternating
selections and deletes.)
S, B
2 (MILD)
Appendix A
150
78
Several users tried to use the Push/Pull tool to compress a box
to a very shallow thickness, and accidentally removed the box
completely. SketchUp 'snapped' to the back face more easily
than they expected. Compounding the problem, once it
snapped to the back face, it wouldn't 'unsnap' - this is evident in
the video for episode #55. These problems tended to occur
repeatedly, until the user recognized that zooming in would fix
the problem.
S, B
4 (MEDIUM)
79
Several users were working on their models from camera
viewpoints that were very far away, and this caused them to
make mistakes in clicking on a geometric entity. (Selecting the
right entities required precise mouse movements because the
entities projected onto very small areas of the screen.)
Sometimes they realized that zooming in would help, but other
times they continued to operate on their geometry from afar,
and made further errors.
S, B
5 (SEVERE)
80
This user tried to use the Push/Pull tool to scale a grouped
object (the mattress from the bed), and SketchUp would not
allow him to do this. He says that he knew SketchUp did not
allow Push/Pull on curved surfaces (he did not realize that the
mattress was a group - not merely a curved surface), but could
not think of any alternative. He never found a workaround.
S
3 (MEDIUM)
81
One user, while working in the components browser,
accidentally selected a component by left-clicking on it, and was
surprised when this component became instantiated as soon as
he moved his mouse outside of the window. He simply got rid
of the object and continued.
B
2 (MILD)
82
One user tried to select some geometry by clicking and
dragging, and accidentally selected some extra geometry that he
did not want. He did not realize this until he erased what was in
his selection, which included geometry that he did not want to
erase. He recovered quickly from this problem.
B
4 (MEDIUM)
83
Several users had difficulty determining how to change the
length of an existing line. One tried to find a special tool to
lengthen or shorten lines, but did not succeed. He said that
most software would allow one to drag on the endpoint of a line
to change its length. For all users, the workaround was to erase
the line and redraw it with a new length.
S, B
5 (SEVERE)
84
One user, while aligning two rectangles, lost an inference line
just before he released the mouse button, and so his geometry
ended up unaligned. (He was trying to draw a rectangle on top
of another rectangle, and line up the left and right edges of the
two rectangles.) He recognized the problem right away and
fixed it by drawing the rectangle again and being more careful
B
4 (MEDIUM)
Appendix A
151
with his mouse movement.
85
One user had trouble using the Push/Pull tool because he
misjudged the 'hot spot' on the mouse cursor. He consistently
clicked above where he should, thinking that the hot spot was
somewhere in the middle of the cursor. In the episode, the user
had drawn two rectangles which he was planning to extrude
into walls of a room. He extruded one rectangle successfully,
but the other would not move. The user thought that it would
not move because the rectangle was overlapping with the first
rectangle. In reality, we can see in the video that the *real* cause
was his hot spot confusion. He never realized that this was the
source of his trouble, and the consequences were serious: He
redrew the second rectangle with some space between the two
pieces of geometry, afraid that they might overlap. Thus, there
was a hole in between his walls.
B
4 (MEDIUM)
86
One user commented that he was confused that the backspace
key did not work for erasing geometry. After some time, he
figured out that the delete key worked, but his first thought had
been to try the backspace key.
B
2 (MILD)
87
One user was unaware that the Measurements box displays the
length of lines as one draws them. He commented that
'SketchUp would be easier to use if you could see the length of a
line while drawing it.' He never found a workaround.
B
4 (MEDIUM)
88
One user was surprised that the orbit tool does not orbit
directly around the origin. 'It seemed to be rotating about some
arbitrary point along the green axis.' At the time this user was
frustrated by this, he had not yet drawn any geometry. He
thinks that he 'worked around this' by using the pan tool to
shift the point around which the orbit tool moved (although it
is not clear why he needed to work around this).
S
1 (MILD)
89
Many users experienced surprise when they drew a large
rectangle directly on top of (coplanar with) some other
geometry, and found that the large rectangle did not 'cover up'
the geometry. Episode #146 provides a good example of this the user has drawn a large rectangle on top of the four legs of his
bridge. He then tries to pull up in the center of his large
rectangle, but finds that it has been broken into pieces: one
large cross in the middle, and four rectangles on the outside.
This surprised him. This problem caused quite a bit of trouble
for this user, and for the others who experienced it. Some never
recovered, while others took a long time to find a workaround.
S, B
7 (SEVERE)
90
One user had difficulty entering values into the 'Measurements'
box, because she could not figure out where to type. She said
that she went to the help box, and it told her to 'find some type
S, B
5 (SEVERE)
Appendix A
152
of box,' but she could not find this anywhere. She said that she
was expecting some kind of dialog box to appear for her to type
in. Her inability to figure this out had severe repercussions. As
seen in episode #303, she resorted to a strategy of making a line,
measuring its length, erasing the line, making a new line,
measuring its length, etc.
91
One user commented that he expected that if you aligned two
coplanar faces such that they adjoined, that the internal edge
along the seam should automatically disappear. He worked
around this simply by erasing these internal edges by hand.
B
1 (MILD)
92
(This may be a SketchUp bug.) Several users experienced the
following surprising behavior. They copied some geometry, and
after pasting it, found that their selection had changed to
include an extra edge that adjoined the pasted copy. They did
not immediately notice this, but did notice it when they
subsequently tried to copy what they had just pasted. None of
the episodes here show the source of the problem clearly, but try
replicating it yourself: Draw a large rectangle. Draw a small
rectangle in the corner of the large rectangle. Copy the small
rectangle, and place the copy in another corner of the big
rectangle (perfectly aligned to the corner). As soon as you place
the small rectangle, notice that your selection will have changed
to include an extra edge of the large rectangle.
S, B
3 (MEDIUM)
93
One user tried to use the push/pull tool to shrink a box shape
along one axis, but he tried to accomplish this by dragging on
the wrong face (a face that was oriented on a different axis).
The result was that the dimension changed drastically along
*that* axis. He realized what was wrong immediately, and
rotated his view so that he could Push/Pull on the correct face.
B
2 (MILD)
94
Several users became confused which tool they had selected pencil or rectangle. They acted with the tool, only to find out
that it was not what they expected. These were relatively minor
problems; users recovered from them easily. This is purely
speculation, but it seems likely that their confusion was
reinforced by the fact that the mouse cursor for the pencil tool
looks very similar to the mouse cursor for the rectangle tool.
S, B
2 (MILD)
95
Several users experienced difficulty determining where an
object that they were drawing was positioned in 3D. One
(#104) had difficulty drawing a vertical line, while another
thought he had succeeded drawing a rectangle in the green/red
plane (when in fact it was drawn in the green/blue plane).
These users figured out that orbiting helped their process of
understanding 3D shape and position.
B
4 (MEDIUM)
Appendix A
153
A.2 Adobe Photoshop usability problems
The following pages present the combined results of the Adobe Photoshop usability studies
described in Section 4.3, and Chapter 6. The “Methods” column indicates which usability
evaluation method(s) found each problem (B1 = backtracking analysis, Chapter 4 study; B2
= backtracking analysis, Chapter 6 study; S = self-reporting, Chapter 4 study; T = thinkaloud, Chapter 6 study). The Severity column indicates the median severity score given by
the three raters, ranging from 0 (mildest) to 500 (most severe). The highest observed rating
was 135 (for problem #103).
ID
1
2
3
Description
One user experienced difficulty with the quick
selection tool; she used a brush that was slightly bigger
than the region she intended to select, resulting in a
selection that was much larger than intended. The
user said that she was surprised. She then reduced the
brush size, and tried again a few seconds later. This
time, she got what she wanted.
One user was surprised to discover that the color
replacement tool requires you to first set the
foreground color. With the foreground color set to
black, the user painted with the color replacement
tool on part of his image. The result was gray. He says
that he was trying to make it red, as required by the
task. He laughed during the retrospective
commentary, saying 'it makes sense: how would the
program know i wanted the flower to be red?' He
realized his mistake right away, and chose red as the
foreground color.
One user had difficulty finding the right opacity
setting for the paint bucket command; he said that he
was surprised by the strength of his paint bucket
command with a medium opacity setting. With the
teeth of a woman selected in his image, he selected the
paint-bucket tool. He then fixed the opacity of the
tool to 46%, and proceeded to click on a tooth. He
says that the teeth ended up much whiter than he
expected. In retrospect, he thinks that it might have
worked if he tried a lower opacity setting. However,
Methods
Severity
S
10 (MEDIUM)
B1, S
4 (MILD)
B1
5 (MILD)
Appendix A
4
5
6
7
8
this did not occur to him at the time. He reversed his
painting action and pursued an alternate strategy. The
user immediately gave up on the paint bucket, trying
to brighten the teeth by other means.
One user said that he could not understand how to
control the amount of brightening caused by the
dodge tool. He played with the exposure setting for
the tool, and then used the tool on the teeth of a
woman. He does not mention the exposure setting in
his commentary, meaning that perhaps he was not
convinced this had anything to do with brightness. He
says that expected the tool to 'ask him' how much
brightening to occur, but it 'let him work right away.'
He says that he clicked multiple times in order to
brighten an area more.
Several users had difficulty clearing their selection.
One tried pressing the escape key, but this did not
have any effect on the selection. Another pressed AltD (which did nothing). All of these users found
workarounds after a short period of experimentation.
Two discovered deselection by clicking outside of the
selection with a selection tool. The third managed to
deselect by starting a 'crop' operation and then
canceling it.
One user wanted to change the color balance of a
bright region of an image, but never experimented
with the Tone Balance (Shadows/Midtones/Highlights) radio buttons (even after
noticing them). It is not clear why she did not try
these settings.
Several users became very confused when moving their
mouse outside an image window caused the view to
pan dramatically while defining a selection with the
magnetic or polygon lasso tools. Neither user was
holding the mouse button down while they moved the
mouse outside the window, and it is not clear that
either of them realized that they were in the process of
defining a selection. After the view panned, one user
thought his picture had been deleted, and so used
undo to backtrack. Another was totally flabbergasted,
left wondering why the view had 'zoomed out.' These
users both tried to use undo to recover, but this was
not possible (since the change was not on the undo
stack). They avoided the use of lasso tools going
forward.
One user had difficulty figuring out how to invert his
selection. He began by selecting the background with
154
B1, S
20 (SEVERE)
S, T
60 (SEVERE)
T
4 (MILD)
B1, B2, S
20 (SEVERE)
S
10 (MEDIUM)
Appendix A
9
10
11
12
the magic wand tool, and says that he intended to
invert this selection in order to select a photograph in
the foreground. He tried holding down Alt and
clicking on the selection with the magic wand tool,
but this brought up a warning message that he did not
understand. (His action had cleared his selection, and
Photoshop wanted him to know this.) He says that he
eventually found a solution, but this took more than
one minute.
One user experienced difficulty with the magic wand
tool when subtracting from one of several disjoint
selections; sometimes the tool removed parts of
disjoint selections. (After using the 'Select Color
Range' command to select all the white-ish colors in
her image, she wanted to remove those regions of the
selection that were outside the teeth - hence was using
the magic wand tool in subtract mode.) She never
found a way around this problem, after several
minutes of trying.
One user said that he did not like to use the keyboard
(modifier keys, keyboard shortcuts, etc) in Photoshop.
Early on, he explains that he always uses the
navigation box 'usually because I don't like to move
my hand over to the keyboard.' He also doesn't use
Shift to expand selections, but uses the toolbar item
(8:38). At 9:58, he says 'Whoa!' in a surprised tone
when he forgets to use the Alt key to select a source for
the healing brush. He keeps his fingers mostly off the
keyboard during the study, his left hand is in his lap or
just to the left edge of the keyboard. He also seems
not to use any shortcut keys, even ones common to all
GUI apps.
Several users experienced difficulty when subtracting
from their selection with the quick selection tool they expected it to remove only areas inside the
selection brush. 'I don't have a handle on this tool at
all,' said one user. Another said that the experience
was 'very frustrating.' In her case, the tool removed
areas of her selection that were all the way across the
screen (and disjoint to the selection region she meant
to subtract from). Users said they were surprised by
the behavior of the software, and had difficulty
working around it. They abandoned the quick
selection tool and used other (e.g. lasso) tools to
subtract.
Several users mistakenly tried to use the Color
Replacement tool in 'Color' mode to brighten an area
155
B1, B2
12 (MEDIUM)
T
2 (MILD)
B1, B2, S, T
30 (SEVERE)
B1, B2, S
4 (MILD)
Appendix A
13
14
15
16
of the image, using a foreground color of 'white'. Most
expressed surprised when the hue of the area changed
significantly, and abandoned the tool in search of
other strategies.
One user found it difficult to tell whether there were
tiny holes in her selection while working with a large
image, without zooming in to at least 100%. She was
using the magic wand to select the background in an
image. She had clicked multiple times so that it
appeared when zoomed out (33%) that everything she
wanted was selected. Later when she zoomed in she
noticed several marquee dots indicating some pixels
were left out. She said 'I assumed that because it all
seemed white to me that it was all white.' Asked about
what she would improve in Photoshop she mentioned
the quick selection tools and said 'I'm not sure
whether I don't know how to use it correctly or if it's
just something inherent to the tool... it kind of sucks
to have to go and zoom in to see if it has been selected
or not.' She recovered from this problem by using the
lasso tool to manually repair the holes in the selection.
One user mistakenly believed that the 'Color Replace'
dialog worked in conjunction with the Color
Replacement tool. After setting the selection color
with the replace color tool, she started brushing with
the color replacement tool. She said, 'It's not working.'
She was trying to make a yellow flower red and had
previously selected the flower and tried different
things, including the color replacement tool (by itself).
She gave up, and went on to a different task.
Several users had difficulty remembering the semantic
mapping of the terms 'Dodge' and 'Burn' to lighten
and darken. The users resorted to experimentation to
learn the mapping. This experimentation was
sometimes unsuccessful at resolving the amgbiguity.
When one user descovered that 'Dodge' lightens
instead of darkens the image, she adjusts the exposure
control instead, lowering it to 6%. Then she tries
setting the range to shadows, still trying to see of
'Dodge' can be used to darken the image.
Several users accidentally clicked on the 'history brush
source' boxes in the history palette, while trying to
undo/redo. Each user realized their mistake right
away, and were able to use the history palette
successfully. One user left a history brush box checked,
but this did not cause any problems during the rest of
the session.
156
T
10 (MEDIUM)
T
5 (MILD)
T
20 (SEVERE)
B2, T
2 (MILD)
Appendix A
17
18
19
20
21
One user, who did not understand the concept of
adjustment layers, created some nevertheless and
became subsequently confused when her active layer
was an adjustment layer. She had an adjustment layer
selected and was trying to get to Image/Adjustment/Color Balance but it was greyed out.
The moderator asked her what she saw and she said 'I
want to select color balance but it won't let me so I'm
just trying to figure out what are the steps I need to
take...' The moderator had to assist her (by telling her
to select the background layer) in order for her to
overcome this problem.
One user was surprised that using the cut command
did not make pixels transparent in a background layer.
He was operating in the background layer of an image
and had selected an area in a portrait and used the cut
command to cut the pixels. Then he duplicated the
background layer and put a new layer in-between with
a different color for the portrait background, but it
didn't show through. He seemed surprised that the
pixels he had cut were not transparent in the top layer.
He tried again in a different order: he duplicated the
background layer, cut the pixels in that new
(duplicated) top layer, then made a middle layer with
a new background color. This worked successfully. It
isn't clear if he ever realized the cause of his trouble.
One user experienced difficulty finding a way to
overlay a grid on his image. He searched in the view
menu, then the file, edit and image menus. Then he
revisited the view menu, clicked on 'Show', and then
clicked on 'Grid'. He says that it was difficult for him
to find the grid option, and that he expected it to be
visible directly under the view menu (rather than
hidden in a 'Show' submenu). It took him about 20
seconds of searching to find the 'Grid' option.
One user mistakenly believed that crop commands
worked on the inverse of a selection (rather than the
selection itself). She selected the border using the
magic wand and then pressed the delete key, but it
didn't crop as she had expected (she said 'that didn't
work'). She then tried Image/Crop with the same
selection but it didn't work because the selection was
basically the inverse of what she needed. She
eventually figured out how Image/Crop would crop to
a selection by trying it on a small selection, then she
redid her selection and cropped successfully.
Several users failed to recognize which of several image
157
T
20 (SEVERE)
T
45 (SEVERE)
S
1 (MILD)
T
9 (MILD)
S, T
45 (SEVERE)
Appendix A
22
23
24
25
windows was active (in focus), and became confused
when their commands applied to the wrong image. In
some cases, it became obvious when the command
visibly changed the wrong image. In other cases, the
user first realized something was wrong when users
noticed that many features were disabled because the
target image was locked. These users never realized the
source of the problem; In one case, the disabled
features were mistakenly attributed to lack of an active
selection; in another case, the user remained mystified
and failed at the task.
Several users had difficulty finding the right command
to adjust the brightness of the image (never having
done it before). One tried 'extrude', 'solarize,' 'color
halftone filter,' 'lighting effects'. Another user tried
adjusting the hue and saturation of the image, and
'black & white'. All of these users eventually found the
brightness/contrast controls, but only after several
minutes of exploring.
While using the polygon lasso tool, the Photoshop
window went mostly blank; this appears to be a bug in
Photoshop CS3. The user was clicking on the corners
of his picture with the polygon lasso tool. As he
clicked in the upper left corner, the toolbar
disappeared. As he clicked in the upper right corner,
the whole image window went blank. After about 10
seconds, the user clicked on the top of the image
window; everything seemed to go back to normal. NB:
this problem is reproducable.
One user wanted to move an image window while a
modal dialog box was open (to facilitate side-by-side
comparison of two images while he made an
adjustment), but Photoshop would not allow him to
do this. He clicks on the title bar of the goal image
window and the computer dings. He explains, 'I was
just trying to move the window so I could compare
the light parts of the image and have them right next
to each other but when this Color Balance thing is
open I can't move the two windows around.' He
doesn't cancel out to move the windows, but works
with the windows as they are, with the Color Balance
dialog blocking the upper right corner of the goal
image. He was adjusting the color balance.
One user expected Control->Up Arrow and Control>Down arrow to zoom in and out of the image; he
was surprised when Photoshop panned rather than
zooming. The user recovered immediately from this
158
B1, B2, S
40 (SEVERE)
S
4 (MILD)
T
60 (SEVERE)
S
0 (MILD)
Appendix A
26
27
28
29
problem - he realized that his expectation came from
using another software application. (He does not say
which application.)
One user had trouble understanding the behavior of
the 'Select Color Range' command; she was surprised
that the command sometimes has side effects. (When
the user clicks in the original image to sample colors, it
modifies the current foreground color.) The user had
selected part of the teeth using the 'Select Color
Range' command. She said that she wanted to expand
her selection to include all of the teeth. She reopened
the color range dialog, and clicked on the corner of the
mouth, in the default (new selection) mode. The parts
of the teeth that she had previously selected were now
deselected. She did not like this, so she hit 'cancel', and
re-opened the dialog box. But now her foreground
color had changed, so her default sampled color was
different. This confused her; she had hit cancel in the
dialog box, but the dialog box looked different the
next time. She eventually found a way around it, by
clicking 'randomly' in the dialog box.
Several users had difficulty choosing the right
parameters for the dodge tool. One experimented
with various settings for the exposure and the 'range'
setting, but the brightening effect remained too
strong. Another experimented with the tool about 8
or 10 times (undoing and retrying each time); he was
trying midtones, highlights, smaller brush sizes, and
different exposure values. The first user gave up on the
task, but the second eventually succeeded (after
considerable effort).
One user limited himself to a small number of simple
tools, and complained that there is minimal help
information available in the interface to support tool
discovery. 'I don't know what some of these tools are.
But I'm sure--I don't know, maybe a box in my
workspace that had a brief description on what some
of these tools were.' He used only the paint bucket,
brush tool, copy and paste, and Replace Color.
One user accidentally pressed 'Fit to Screen' from the
zoom tool's context menu, and had difficulty reversing
this action. He says that he meant to select 'Actual
Pixels,' which is adjacent in the context menu. He
tried to 'undo' the command, but 'Fit to Screen' was
not an undoable action. He worked around the
problem by manually reversing the frame size (selected
Window->Arrange->Tile Vertically), but this took
159
B1, B2, S
8 (MILD)
B1, B2, T
20 (SEVERE)
T
10 (MEDIUM)
B1, B2, S
3 (MILD)
Appendix A
30
31
32
33
him about 20 seconds. One user attempted to undo
the 'Fit to Screen' command, and said that he was
surprised that this action was not reversable. He used
the 'Fit to Screen' command, saying that he wanted to
zoom out to be able to see the whole image. The
command did zoom out on his image, but it also
changed the size of his frame, obscuring the goal image
(something he says he didn't want). He worked
around the problem by manually reversing the frame
size (selected Window->Arrange->Tile Vertically).
The incident cost him about 30 seconds, resetting the
view.
One user expressed momentary, mild surprise when he
used Edit->Transform->Rotate to rotate a tilted
selection he had previously made; the bounding box
for the transformation was a window-aligned (nontilted) rectangle. He said, 'This is strange, but--' and
then immediately overcame his confusion, and went
to the corner to rotate the image by dragging.
One user said that he did not understand the purpose
of the Color Replacement tool. 'I had no idea what it
was really used for, as opposed to why wouldn't you
use a paint brush, you know so, when in the tutorial,
when he just overlaid the eyes, it looked like he was
using the paint brush tool only with a lower opacity or
something, so I didn't really understand what the
purpose was.' She in fact didn't use the Color
Replacement tool for any of the tasks; because this was
a response to a leading question from the moderator,
[the evaluator] would probably only use this
statement in conjunction with task-based evidence
from someone else.
One user had difficulty finding a way to crop his
image, searching unsuccessfully through the 'Edit'
menu. To work around the problem, he selected the
foreground part of his image and then cut and pasted
his selection into another, new canvas.
One user said that he expected to click on a tool and
immediately see hidden tools appear (without holding
down the mouse button); he said that this would be
consistent with the way the other menus worked. He
clicked on the slice tool, moved away from the tool.
He says that he expected the hidden tools menu to
pop up, but it didn't. So he clicked and held his mouse
on the slice tool, and the menu appeared. The user
notes that this behavior is inconsistent with the way
the other menus work in Photoshop, and says that
160
T
1 (MILD)
T
3 (MILD)
T
6 (MILD)
S
5 (MILD)
Appendix A
34
35
36
tool selection is 'uncomfortable.' He recognizes that
having the menu pop up as soon as you click on it
would be problematic, but 'maybe there is another
solution.'
Several users, while using the magnetic or polygon
lasso tools, accidentally reset their selection by doubleclicking (rather than single clicking) on the initial
control point when attempting to close the loop. NB:
a double-click is normally required to complete the
selection, unless you single click on the initial control
point. In the case of the polygon lasso tool, this
additionally resulted in the creation of a new selection
(which the user was unaware of - and caused him
much confusion). It is not clear that any of these users
understood why their selection had disappeared (nor
in the case of the polygon lasso tool, why a new
selection was begun). In the case of the magnetic lasso
tool, the user recovered quickly, by undoing the
'deselect' operation to recover the selection. In the case
of the polygon lasso tool, the recovery took much
longer.
One user experienced difficulty with snapping
behavior while using the crop tool near the edge of his
image. He tried to crop out two small white lines
along the right and bottom edges of his image. (These
were leftover from previous cropping attempts.) But
every time he approached any border of his image,
Photoshop snapped the cropping selection to the
border. He moved his mouse back and forth,
attempting to avoid the snapping, but to no avail. His
eventual workaround, several minutes later, was to
back up to an earlier state in which there was more
white-space around his image, and then recrop.
One user applied a filter on a selected region of his
image, and failed to notice that something changed
(since the menu options obscured his selection until
just after he clicked). Specifically, he used the 'solarize'
command on a selected region of his image, and was
surprised when nothing seemed to happen to his
image. This seems to have confused him quite a bit.
He tried the same operation again, after about 10
seconds. Again, he did not notice any effect. He then
tried to use his brush on the image (which was in
quick-selection mode). It seems possible that he
thought his brush might have been transformed into a
'solarize' brush, although the evidence is inconclusive
here.
161
B1, B2, S
24 (SEVERE)
B1
20 (SEVERE)
S
8 (MILD)
Appendix A
37
38
39
40
41
Many users experienced difficulty finding a way to
remove a color cast from an image. Most went to the
'Filter' menu looking for a filter that would do this.
After an exhaustive, time-consuming search (5-10
minutes), most did succeed in finding solutions. One
found the 'Auto Color' adjustment, while another
adjusted the color balance. One needed an assist from
the moderator.
One user tried to click on an action in the history
palette while a modal dialog box was active, but
Photoshop would not allow this. He noticed while the
Rotate Canvas dialog box was up that he had (earlier)
flipped the canvas upside down. He tried clicking a
few times on the history palette to undo the flip, but
realized he had to close the dialog box first. He closed
the dialog box and tried again.
One user experienced some confusion while setting
the current foreground color with the color picker
dialog; she expected her changes to be immediately
reflected in the color swatch on the brush palette, but
these changes did not happen until she pressed 'OK' in
the dialog. Later, she says she has a Mac, where the
color picker affects the foreground color immediately.
She did eventually realize her problem, and worked
around it.
One user thought that the eye dropper tool could be
used to paint colors into the image (rather than
sampling colors *from* the image). Before the episode
begins, she has already picked a shade of blue, and used
the lasso tool to select one of the eyes. Then, using the
eye dropper tool, she clicked many times inside the
selection. She says that the was expecting the colors in
the image to change, but nothing happened. So, she
says, she reversed her action. (She actually reversed the
lasso operation, not the color sampling operation,
which was not on the undo stack.) She never figured
out what the purpose of the eye dropper tool was; she
does not appear to have noticed that it modified her
current foreground color.
One user complained about the extra work when
dealing with selections at the edge of images and
feathering. He was using the magnetic lasso tool to
select an area of an image that was basically a triangle
bounded by the person and the edge of the image.
After he made the selection he applied feathering to it,
so there was feathering at the image edges which he
said he didn't want. He said 'this is something I
162
S, T
60 (SEVERE)
B2
2 (MILD)
T
5 (MILD)
B1
4 (MILD)
T
9 (MILD)
Appendix A
42
43
44
45
encounter frequently when I try to use this tool is that
I don't want it to be all the way at the bottom... I don't
want the feather at the bottom but it still applies it, so
I have to do an extra operation.' He was selecting the
background of a portrait to change its color.
One user suggested that 'Add to selection' should be
the default mode for any selection tool, implying that
he suffered from mode errors because the default
selection mode was often not what he expected it to
be. The user stated his problem in the form of a design
suggestion during the retrospective.
One experienced user failed to understand how to
perform a cloning operation from a separate layer. The
user expressed his intention to use layers to remove
the earrings of a woman, but after he started cloning
and saw the earring reappear, he deleted the layer and
cloned directly on the background. He expressed
surprise (about his initial mistake) but said, 'I
understand what I did wrong.' During the
retrospective, he explains that he meant for the
cloning stamp to sample from his previous clones, and
that this was only possible when cloning in the same
layer, as if it is an inherent problem with layers. In
fact, he could have achieved the result with the Sample
drop-down in the toolbar by sampling from all layers.
Many users expressed difficulty translating their
intentions into the jargon terms that Photoshop
understands. In describing these difficulties, they are
often quite specific: the problem is not with
knowledge of photography or artistic sense, but the
ability to map image characteristics to the field's
jargon. A sampling of their comments: 'Look at all
these, like, crazy, you know, I have no idea what a
'Gaussian,' is it like a, how to pixellate something in a
'Gaussian' manner? It's pretty insane, I have no idea.'
'For the color changes...I suspect there is some bit of
image editing terminology I need to know to know
'you've done *this* to it', and I don't know what that
term is, and I think if I knew that term, then I could
probably find it in Photoshop pretty easily.' These
confusions caused considerable frustration, and often
caused users to fail at the task.
Several users found it difficult to find tools in the tool
palette, because the tools they were looking for were
hidden underneath other tools. One user never
noticed the 'burn' tool while looking for something
that was the opposite of 'dodge'. Another had trouble
163
S
1 (MILD)
T
4 (MILD)
B1, S, T
90 (SEVERE)
S, T
60 (SEVERE)
Appendix A
46
47
48
49
50
finding the color replacement tool, after reading about
it in the help system.
One user was initially uncertain whether the Color
Replacement tool required him to specify the source
color, or might require an image selection. He applied
the color replacement tool by brushing over the image
and then undid it. He said 'I was just trying to
understand how the color replacement tool worked ...
whether a selection was needed... whether I had to
select the color of which portion I wanted to change.'
He then selected the magic wand, apparently to select
the area he wanted to replace colors in. He said that he
was just experimenting/learning. It's not clear if he
used the color replacement tool afterwards (or
whether he understood the tool better after trying it).
One user was unaware that he had turned off the
'contiguous' checkmark for the magic wand tool, and
expressed surprise when the magic wand tool selected
noncontiguous regions of his image. He did not
immediately understand what had happened, but he
says that he eventually realized that he needed to turn
on 'contiguous' mode. (It is not clear when/why he
had changed this from the default, which is
'contiguous' mode.) It took him longer than 30
seconds to recover from this problem.
One user somehow (it's not clear how) accidentally
introduced a color cast and oversaturated his image,
while trying to make a local change to add saturation
to part of his image. He had been trying to adjust the
vivid color of the tulips.
Several users reported difficulty using the crop tool,
because it was hard for them to tell where the 'hotspot' for the cursor was located. 'I was not happy with
the crop tool... I undid it because I wasn't sure... the
tool itself has a shape to it so I wasn't sure exactly
where I was clicking and dragging the border to, so
that's why I undid it and used the marquee instead.'
(The consequences are made worse since the users do
not appear to have realized that they could adjust the
cropping window after creating it.)This problem
caused one user to end up with an incorrectly-cropped
image; another found a way around the problem by
selecting the area first and then applying the 'crop'
command from the menu.
One user apparently failed to notice that his brush did
not work outside his selection area. He is using the
Dodge tool to increase the shininess of the sculpture.
164
B2
5 (MILD)
B1, B2, S
4 (MILD)
T
1 (MILD)
B1, B2, S
30 (SEVERE)
T
5 (MILD)
Appendix A
51
52
53
54
Beforehand, he had selected a large rectangular area
that doesn't quite include the whole sculpture. As he
is painting with the Dodge tool, he crosses the
selection boundary, but it is not clear he sees that the
tool has no effect beyond it. It is not clear why he
made the selection. He may be bored with the study
by now (earlier, he said, 'I am getting tired of this' and
he has already failed at the other two tasks in the
second half of the study).
Several users had difficulty finding menu items for
common novice tasks. One said, 'I would just say make
the things that people usually do... editing pictures,
changing exposure, saturation, fixing blemishes...
making that really easy to find' (indicating menus
especially). She had difficulty finding things during
the session, e.g. a way to change the color balance in
the image, and needed hints from the moderator.
Another commented that the image adjustment
commands are all 'synonyms' to him. He says,
'...especially in a visual program... I want to see icons.'
He had been searching for image adjustment tools to
sharpen and brighten highlights, alter colors, and
make colors more vivid. He spent a lot of time
searching but sometimes was able to get the tool and
result he wanted, and sometimes not.
One user mistakenly believed that clicking on the
background color swatch could change the dominant
background color in an image (not just set the current
'background color' state). To try to change the
background color in a portrait photo from white to
gray, she opened the background color swatch (which
was showing white), selected a grey color and clicked
OK. Nothing happened to the imagem and she said
'hmm, maybe not.' She eventually learned to select the
background areas using the quick select tool, and used
the paint bucket to change the color.
Several users accidentally used a brush outside of
where they meant to use it. This happened with the
brush tool, dodge tool, and color replacement tools. It
happened both while dragging the mouse, and just
clicking it. The problem was often compounded by an
inappropriate zoom level (i.e., attempting to edit from
too far away). In each case, 5-10 seconds were lost
before the user recovered from the error.
Many users, having selected a region of their image
and adjusted the color of that region (with Image>Adjust->xxx), were surprised to later discover that
165
T
120 (SEVERE)
T
2 (MILD)
B1
50 (SEVERE)
B1, S, T
32 (SEVERE)
Appendix A
55
56
57
58
59
there was a sharp color change along the boundary of
their selection. These users all expressed surprise at
what happened. One attempted to recover by using
the blur tool along the boundary; another tried to use
the sponge tool. Another reversed his color changes
and appeared confused as to why the problem had
occurred. None appeared to understand the concept
of feathering.
One user apparently failed to realize that brush size is
adjustable; he never adjusted it for the duration of the
study. The effects of this on a task are most evident
when the Dodge tool lightens not only the sculpture,
but also the wall behind it.
Several users experienced a particular confusion with
the 'Replace Color' dialog box; they confused the
'selection color' and the 'replacement color'. A
representative user selected the part of his image that
he wanted to adjust, and then clicked on the 'color'
box in the selection area of the dialog, selecting 'red'
for the selection color. He then pressed okay, and says
that he was surprised that the colors in his image did
not change from yellow to red. (He needed to choose
yellow for his 'selection color' and red for the
'replacement color' -- but he did not seem to
understand the distinction.) Even by the time of the
retrospective, the user did not understand what
prevented him from changing the color. After at least
20 seconds of struggling, he abandoned the 'Replace
Color' strategy, searching for other tools.
One user had trouble figuring out how to make the
selected part of his image transparent. He tried to
open a new layer, and then says that he realized this
strategy would not work. He decided to create a new
(transparent) image instead, invert his selection, and
copy the opaque part into the new image.
Several users experienced difficulty using the Edit>Transform->Rotate command to rotate an image;
they could not figure out where to click with their
mouse to initiate the rotation. All of these users tried
clicking in the center and dragging, which initiated a
move rather than a rotation. The users did eventually
find a way to use the tool - but not until after 30-60
seconds of exploration.
One user accidentally used the Dodge tool instead of
the Magnify tool, saying afterward that their icons
look similar. The user is comparing the two images.
He quickly selects the Dodge tool and then clicks on
166
T
8 (MILD)
B1, S, T
6 (MILD)
B1
6 (MILD)
B1, B2, S
5 (MILD)
T
2 (MILD)
Appendix A
60
61
62
63
64
the goal image, meaning to zoom in on it. When the
window fails to zoom, simultaneously with the dialog
box popping up explaining that the layer is locked, he
asks 'What the hell happened here? Oops.' Then he
chooses the zoom tool and says 'That's what I wanted.'
Later at 19:41 during the retrospective, 'The Dodge
Tool and the Magnifying glass, they're both oriented
similarly....That's seems kind of confusing...they're like
essentially the same icon.'
One user was overwhelmed by the jargon and plethora
of options in the Lighting Effects dialog. 'There's all
these different directions the light could be coming
from? I'll just click random ones.' Then after the
'Blue Omni' Style makes the preview blue, she says,
'Oh my!' in a surprised tone of voice. It is not clear if
she understands the relationship between the styles in
the top part of the dialog and the settings below. On
the one hand, she is focused on making use of the
Gloss slider and the Shiny setting (the words), but for
all other words, she is apparently not reading them.
'Assuming 'Omni' means whole selected object,' she
says and then disproves that hypothesis. She kept
trying settings, but never succeeded in getting what
she wanted.
One user accidentally used the History Brush tool
instead of the color replacement tool, saying afterward
that their icons look similar. He looked up 'color
replace' in the help system, and this showed a picture
of the icon. He did not see which toolbar group the
color replacement tool was hidden in, however. He
picked the history brush because the icon looked a lot
like the color replacement tool. He tried to use it, but
experienced an error. He quickly realized his mistake.
One user says that he expected to find an opacity
control for the Color Replacement tool, to soften its
effect -- pointing out that opacity controls exist for
other tools, like the history brush. He says that this
would have made it easier for him to change the color
of the eyes in the portrait.
Several users expressed difficulty deciding on a
selection tool to use. They hovered over the toolbar,
alternately choosing selection tools without using
them. Eventually, they were able to decide, but often
after considerable thought.
One user rotated the canvas multiple times to achieve
a single rotation, accumulating image error. She first
rotated CCW 10 degrees, then rotated CW 5 degrees
167
T
4 (MILD)
S
1 (MILD)
B1, B2, S
2 (MILD)
S
15 (MEDIUM)
T
10 (MEDIUM)
Appendix A
65
66
67
68
69
to correct it. (Alternatively she could have undid the
first rotate then did CCW 5 degrees, which would
have preserved image quality.) The image error caused
by this problem is quite subtle, and was not noticed by
the user.
One user experienced difficulty creating a smooth
selection boundary using the magic wand; he was
unaware of the various ways to smooth a selection.
While holding down the shift key, he clicked multiple
times along the edge of his selection to expand it. As
he did this, small 'bumps' along the contour remained
unselected. He says he was annoyed at having to click
on these bumps to remove them, especially when they
were very small. He says he was not surprised, but
annoyed, by the behavior. Continuing to shift-click
with the magic wand tool, he eventually got the
selection that he wanted.
One user tried to use the quick selection tool to define
many small, disjoint selections - but the tool kept
joining his selections together. He made 2-3 attempts
of selecting a small purple tulip, even after reducing
the size of the brush. The selection kept joining on to
the selection of another tulip. The user was trying to
select the individual tulips in the image. He did not
work around the problem, but instead said 'I think I
should give up on the purple tulip'.
One user did not like the effect of the sharpen tool when applied with too high a strength, it resulted in a
'grainy' apperance that she did not want. She selected
the sharpen tool, and began using it on the statue. She
reversed the command, and lowered the strength by
1/2. She then tried it again, but it was still too much
(created a grainy appearance). So she reversed it a
second time. Finally, she applied the tool a third time.
She says that she found a way around the problem by
continuing to lower the strength of the tool, and
feathering the brush.
One user accidentally clicked above the tool palette,
causing the palette to switch from double to single
column mode. It is not clear why she was trying to
click on the palette. The user said, 'Oh No!' She
realized what had happened, and after a few clicks
restored the palette. 'All I did was make it one
column, so I put it back.'
Several users reported difficulty finding any way to
rotate a selected part of their image. These users
explored the menus by hand, failing to find anything
168
S
16 (MEDIUM)
T
5 (MILD)
B1, B2, S
2 (MILD)
T
1 (MILD)
B1, S
14 (MEDIUM)
Appendix A
70
71
72
73
74
related to rotating selections. In all cases, they
eventually overcame their difficulties (one using the
help menu, and one by exhaustive search of the menu
items).
One user tried to use the 'Replace Color' command to
brighten a selected part of his image, and experienced
difficulties. Trying to brighten the teeth of a woman
in a portrait, he washed them out almost completely
to 100% white, including leaving a jagged edge. He
says, 'It's not perfect, but...it's close enough. Good
enough to move on?' He did not try to work around
the problem; he just proceeded.
Many users experienced difficulty setting the right
tolerance for the magic wand tool, resorting to a 'trial
and error' strategy. Half of the users gave up on using
the tool (using the polygon lasso or magnetic lasso
tools instead), while the other half eventually found
the right tolerance.
One user complained that healing brush seems to need
selection first, which isn't 'fun'. During the
retrospective, she was explaining the difference
between the healing brush and clone tool and how the
healing brush mixes the source and destination: 'So
you get this bleeding of this color that you don't really
want which I guess you can fix with selecting it
beforehand, but that's like an extra step that's not
really fun.'
One user openly mocked the jargon needed to
understand the 'Gaussian Blur' operation. He says,
'Look at all these, like, crazy, you know, I have no idea
what a 'Gaussian,' is it like a, how to pixellate
something in a 'Gaussian' manner? It's pretty insane, I
have no idea.' He is clearly ridiculing the idea that
'Gaussian' could be a clear description of something, as
an example of how much stuff there is to learn to use
Photoshop well. It was not clear if he would have used
the Gaussian blur in his task; he made this comment
during a retrospective session, while perusing the
menus.
One user reported being surprised by the behavior of
the 'Clear' command - he says that he expected it to
clear to transparent, but it cleared to his background
color. After setting his selection to the (white)
background area behind the photograph, the user
pressed the delete key. The area became orange, which
was his current background color setting. It took him
several minutes to work around this problem; he
169
T
5 (MILD)
B1, B2, S, T
45 (SEVERE)
T
1 (MILD)
T
1 (MILD)
B1, B2, S
6 (MILD)
Appendix A
75
76
77
78
created a new image with a transparent background,
and copied his foreground photograph into this
image.
One user reported that he found it annoying that the
brush size did not remain consistent as he switched
tools. As he reported this, he had been switching from
the brush tool to the dodge tool (and his brush size
got much bigger). He did realize what was going on
here - that the brush size for each tool is remembered
separately.
One user cropped a tilted photograph by first rotating
and then cropping; he was not aware that the crop
tool allows one to directly crop a tilted selection. To
rotate and crop an image, he rotated first and then
cropped the image. During the retrospective, when
asked why he started by rotating, he said 'I've never
known the crop tool to use a skew parameter... the
image was not perfectly perpendicular so I wanted to
get a square rectangle first.'
One experienced user misjudged the effect of the erase
tool on a channel mask; erasing from a mask is
equivalent to adding to a selection, which she
momentarily forgot. She is trying to remove some
blueness that got applied to the eyelashes while
changing the eye color in a color balance adjustment
layer. She says, 'We can change that... in the channels.'
She deftly navigates to the mask channel for the layer,
and selects the eraser tool (which makes sense because
she is erasing part of her effect, decreasing the number
of pixels this layer will affect). As soon as she starts
painting with the eraser tool, she makes a noise
('Gak!'), when she realizes that it is adding to her
selection rather than subtracting from it. She switches
to the brush tool with black as the color, and begins
painting. (This time, she successfully subtracts from
the selection.) The moderator asks what she's doing,
and she explains channels, saying, 'The areas that are
in red are the ones that are NOT part of the selection,
so I'm trying to cover the areas that I don't want part
of the selection in red by using the paintbrush tool.'
(Though the selected color for the paintbrush tool is
black, Photoshop displays masks in red.) 'This is
generally how I photo edit when I'm trying to change
things, like beyond just the curves.'
Several users edited an image at an inappropriate
zoom level; they were too far away to work effectively
on it. One experienced difficulty drawing with
170
S
3 (MILD)
T
3 (MILD)
T
1 (MILD)
B1, B2, T
45 (SEVERE)
Appendix A
79
80
81
82
83
brushes; the other had problems using the magic wand
tool. One recognized the zoom level issue in the
retrospective ('I should have just zoomed in'), but she
did not recognize it at the time. This problem seems
to have cost both users a lot of time; repeatedly they
made mistakes that could have been avoided had they
zoomed in.
One user accidentally hit 'Ctrl-X' in addition to 'CtrlZ,' while trying to undo. The user was trying to reverse
a paint-bucket action. He pressed Ctrl-Z and Ctrl-X
nearly simultaneously - Ctrl-Z undid his previous
action, and Ctrl-X cut the pixels in his selection. It is
unclear whether the user realized what happened; he
does not mention it in the retrospective. A few
seconds after his accidental cut command, he clicked
in the history palette to reverse the cut.
One user was frustrated that the default help
application became Acrobat after he performed his
first search. He first mist-typed his query (typing 'siny'
instead of 'shiny'). When he hits enter, he finds zero
results. Then he types in the new query ('shiny'), and
Photoshop mysteriously switches to show results for
Adobe Acrobat (instead of Photoshop). After a few
seconds, he realizes that he is looking at Acrobat
results, so he clicks on the 'Photoshop' button and sees
the results he was looking for.
One user accidentally clicked on quick mask mode. (It
is possible he was trying to close a tool selection
callout, but he does not remember.) He noticed that
he was now in a different mode, and tried to return to
his previous state. He says that he tried undoing the
change, but this did not work. After about 30 seconds,
he eventually recovered by alternately clicking on the
two adjacent buttons ('quick mask mode' and 'change
screen mode') until he was back to his original state.
One user accidentally deleted a Lighting Effect Style
preset accidentally and obliviously. While
experimenting in the Lighting Effects dialog box, she
selects the 'Soft Omni' Style preset. Even though she
has switched among Style presets without problems a
few times by now, this time, she says, 'Well, perhaps'
and clicks the Delete button. A dialog box pops up
with an alert sound asking 'Do you want to delete Soft
Omni?' She clicks yes. She does not seem to be aware
that she just deleted a preset, but thinks it just affects
her image.
One user misjudged the feather radius when zoomed
171
B1
1 (MILD)
S
1 (MILD)
S
5 (MILD)
T
3 (MILD)
T
1 (MILD)
Appendix A
84
85
86
87
in on an image. He selected the irises, and then used
the Feather Selection dialog box to soften it. At first
he chose five pixels, and when he sees that's too much,
he tried again with two pixels. 5 px would be
reasonable if he had been working at 100% (but is
much too large when heavily zoomed in).
One user was surprised when the magnetic lasso tool
continued to operate on the selection even after he
released the mouse button. This caused his view to
change, since the mouse went outside of the window,
causing the view to scroll unexpectedly. He never
understood what caused his view to change. He tried
to reverse the change, but the view change was not
undoable. This problem cost him at least 30 seconds.
One user was confused by the behavior of the 'Show
More Options' button in the Shadows/Highlights
dialog. He clicks on 'Show More Options' and the
Shadows/Highlights dialog box expands. He had
been adjusting the Highlights Amount slider, but now
the Shadows Radius slider is in its place and the
Highlights amount shadow moved down. He adjusts
Shadows Radius slider and sees it doesn't have the
effect he expects. 'Oops. I clicked on 'Show More
Options,' but I got confused so I'm going to cancel
that and try again.' He cancels, then re-opens the
dialog box and explains to the moderator what
happened. (According to Windows UI standards,
dialog boxes are supposed to expand with More >>
buttons, not checkboxes, and are not supposed to have
the controls jump around like that.) He did not
consider the extra options after this point.
Many users experienced the following difficulty with
the color replacement tool: they were surprised that
the resultant colors were much brighter or darker than
their foreground color. For most of these users, this
problem was a major roadblock, preventing them
from completing the task to their satisfaction. Many
users tried playing with the blending modes, but none
of the modes did what they seemed to want and expect
(modify the colors under the brush such that the
average color under the brush matches the foreground
color). Some found ways around the problem (such as
using Image->Adjustments->Replace Color), but only
after spending considerable time grappling with this
problem.
Several users became confused as to why commands
that have no effect register as an action in the history.
172
B2, S
3 (MILD)
T
1 (MILD)
B1, B2, S, T
15 (MEDIUM)
B1, B2
2 (MILD)
Appendix A
88
89
90
91
One clicked with a painting tool outside her selection
area, and was surprised that Photoshop registered an
event even though her command had no effect.
Another clicked with a tool in the grey area outside of
her image (but inside the window frame), and
Photoshop registered an event, to his surprise. In both
cases, users noticed the new event in the history
palette, and reversed it (after some confusion as to
why it was there in the first place).
One user mistakenly believed that the color palette
could be used to adjust the color balance of an image.
She had previously changed the workspace
configuration to Color and Tonal Correction. She
tried changing the RGB sliders in the color picker
palette and said she's 'not seeing a difference.' (She was
apparently expecting this to change the overall image.)
Since the user appeared completely stuck, the
moderator intervened to help her find the color
balance tool.
One user had difficulty with the 'Trim' command; it
did not trim everything that he expected, leaving a
small border of mostly transparent pixels around his
image. He applied the trim tool, based on transparent
pixels. Most of the transparent region outside of his
photograph was cropped successfully, but a small
border remained. He tried Trim again, this time with
'Upper Left Corner pixel' as the basis. Nothing
changed. Even after considerable effort, he never
found a workaround to this problem; he ended up
with an image with a small transparent border.
One user was surprised by the behavior of the Single
Column marquee selection tool. He said that he did
not expect it to select a single column in the whole
image. In the retrospective he said 'I thought the single
column would just be a really narrow rectangle.' He
was trying to select a statue in order to make it look
shinier. He used the lasso tool instead.
Several users saw the Auto Color command, and
decided based on its name that it would not be helpful
for removing a color cast. One user pauses on Auto
Color, and says 'Auto Color, that doesn't sound right'
and goes on to make adjustments manually. Another,
while perusing the options under Image>Adjustments, said: 'Many of [these commands] look
like they do things with colors, and I'm sure many of
them can probably do the trick. The question is which
one is going to do it most efficiently? I'm going to try
173
T
5 (MILD)
B1, B2
5 (MILD)
T
1 (MILD)
T
3 (MILD)
Appendix A
92
93
94
95
96
97
Color Balance because it looks like I have a color
balance problem.
Several users were unaware that there was an active
selection, while working on a zoomed part of their
image; this caused problems when users tried to
perform subsequent operations (selecting something
new in one case, using the healing brush in another).
Both users realized their mistakes after a few moments
of confusion, cleared the selection, and continued.
One user had difficulty learning the mapping between
tool icons and tool functions, complaining that the
tooltips took a long time to pop up. He moved his
mouse over many of the tools (apparently trying to get
tooltips to appear over them -- but with no success).
His mouse came to rest over the rectangular marquee.
He paused for about five seconds, during which time
the tooltip was finally displayed. He then moved his
mouse again over the tools, and this time the tooltips
were displayed instantaneously. He found the crop
tool at this point. It is unclear whether he understood
why there was sometimes a delay in showing him the
tooltips, and sometimes not.
One user had difficulty using the 'brush' tool to
lighten part of his image. He used the brush tool with
a foreground color of white, but found that it was
*replacing* the colors in the image with white. He says
that he only wanted to brighten the existing colors in
the image. He reversed his initial attempts to brighten
the image. He says that he worked around the
problem by selecting a softer brush.
One user tried to pan across his image, but did so
awkwardly by zooming all the way out, and then all
the way back in to a different spot (using the scroll
bars when this failed to work initially). He was trying
to get a better view of the large earring to remove it.
Though he could have just panned (with the hand
tool or the scroll bars), he used a complex
combination of zooming out and in and the scroll
bars.
One user complained that it was difficult to remember
important parameters and colors for use in dialog
boxes (as they are in Lightroom, she says). In
particular, she cited the hue value used to change the
eye color as something she might refer to while
retouching a photo, and says she uses a scrap of paper
when she needs to remember these numbers.
One user reported difficulty synchronizing his view
174
T
8 (MILD)
S
3 (MILD)
B1
2 (MILD)
T
3 (MILD)
T
2 (MILD)
B1, B2, S
4 (MILD)
Appendix A
98
99
100
101
(pan&zoom) for two images, side-by-side; he could
not think of a way to make the views identical. While
the user complained about this difficulty, he did not
search for a feature that would help him. 'Window>Arrange->Match Zoom And Location' would
probably have solved his problem, if he had known
about it. His alignment problem was compounded by
finding the zoom tool somewhat unpredictable; he did
not know what to expect when he clicked on a
position within an image.
Several users had difficulty finding a way to rotate a
selection using the Move tool. One briefly checked the
'Show Transform Controls,' which actually would
have led him to the solution, but he apparently didn't
recognize that he could use these controls to rotate the
selection. Finally, he opened up the help menu. He
said that after searching the help, he discovered that
he could press Ctrl-T to transform the selection.
Another user mentioned his inability to rotate with
the Move tool as a side comment.
Many users rapidly filled the limit of 20 undo
operations by repeatedly clicking with a tool, but
expressed frustration when they couldn't undo
further. As one representative user put it, 'A real
annoyance is... if I'm doing clone stamp a lot then this
whole history fills up with clone stamp, clone stamp...
and suddenly I realize that oh -- all the clone stamping
I did was wrong and I've got to undo that, then I find
out that I can't really do that because it's just filled up
with clone stamp and I don't actually know how to go
further back than that, so if I want to go back 50
operations I can't... why does each of these very
repetitive similar motions become [a separate] event
in the history?' Since these users hadn't been saving
their work as they went, there was no way for them to
undo their mistakes.
One user experienced difficulty with the 'Replace
Color' dialog; he failed to see how to select the
replacement color directly. '... I mean, I thought I'd be
picking a color, but I'm just adjusting the hue,
saturation, and lightness is good enough.' He
experimented with the sliders until he got the result
he wanted. NB: It is actually possible to select the
color directly by clicking on the swatch of the color
itself.
One user had difficulty making a polygonal lasso
selection when the grid was on. He was trying to select
175
B1, S
2 (MILD)
T
60 (SEVERE)
T
2 (MILD)
T
3 (MILD)
Appendix A
102
103
104
105
an area (a rotated rectangle) with the polygonal lasso
tool but it was snapping to gridlines. He said 'I'm
having problems with this because as much as I like
the grid tool I think it gives me problems selecting or
finalizing a selection' ... 'I'm just going to take of the
grid because it's not letting me select what I want.' He
worked around the problem by temporarily turning
off the grid, completing his selection, then turning the
grid back on.
One user could not find a way to modify the overall
brightness of a region, while preserving relative hues
and brightnesses. After selecting a region of the teeth,
she dragged with the gradient tool across the selection.
It turned completely white. She says that she did not
expect this, but 'should have expected it.' She was
hoping that it would just brighten the teeth, not turn
them completely white. She says that she eventually
found another way to do it, but she doesn't say how.
Several users were frustrated with the default mapping
of Ctrl-Z in Photoshop to undo/redo. For example,
one said that he thought that pressing Ctrl-Z multiple
times would lead to multiple undos, and was surprised
when this did not work. He pressed Ctrl-Z repeatedly,
and then realized that this was just alternating
between the current and previous state. He clicked in
the history palette to move back multiple steps in the
history. After a few seconds, he realized that he could
click in the history palette to go back multiple steps.
One user was not aware of the convention to indicate
that a popup will appear when pressing a menu
option, causing him to show surprise when a popup
appeared. (The convention is to display '...' after the
command name.) In particular, he was surprised by
the effect of the 'Filter Gallery...' command, for which
he did not expect a popup menu to appear. He says
that he was looking for a filter that would adjust the
color balance of the image. He clicked on 'Filter
Gallery', and says that he was surprised by the popup
menu. He then spent 10 seconds exploring the
different types of filters in the gallery, before canceling
the popup. His retrospective partner points out that
the '...' next to the menu option indicates a popup will
appear; he appears enlightened by this. This problem
cost him almost no time, but it is clear that he did not
recognize the convention until his partner pointed it
out.
One user thought that he could undo a pan/zoom
176
B1, B2
10 (MEDIUM)
B1, T
135 (SEVERE)
S
2 (MILD)
B1, B2
2 (MILD)
Appendix A
106
107
108
109
operation, and said that he was surprised when he
discovered that this was not possible. He tried moving
to previous states in the history, but none of them
changed his view (zoom & pan level) of the image.
After a few seconds, he realized that he would have to
reverse his view changes manually.
One user had some kind of difficulty (it's not clear
what, exactly) using the smart selection tools to make
small selections. In the retrospective, she said 'it was
really hard to select certain things,' for example when
she had selected the teeth she had accidentally selected
some of the gums as well. 'The most challenging part
for me was to be able to select the area I wanted to ...
the smart select tools are really helpful but I wish there
was a better way to select things, especially small areas.'
She got reasonable results by making multiple
attempts at selections, but there were still rough edges
on the areas she had changed.
One user had difficulty understanding how the
Black&White dialog worked, and resorted to trialand-error to try to understand it. The user tried
playing with each of the sliders in the dialog, undoing
his action. He says that he failed to come to an
understanding of how the dialog worked, so
abandoned it.
One user was surprised that selecting outside the
selection cleared his current selection; he thought that
Control-D was the only way to deselect. He has a
selection made on the teeth and has been painting
inside it with the sponge tool. He clicks outside the
selection (not clear why). This deselects. He uses
undo to restore the selection for further operations.
During the commentary, he said he was surprised and
thought that Control-D was always needed to
Deselect. He recovered by reversing his action and
continuing.
One user was frustrated by the Healing Brush's
preview not matching the final result. He said 'when I
was using the healing brush I was confused by how
when I click and drag on a region... there's this preview
idea and I wasn't sure what to do if I just want it to be
what the preview is giving me ... I wasn't sure how to
keep that... when I let go it just sort of magically goes
back... it appears to be doing an averaging.' He said he
wasn't sure what tool options he could change in order
to get a result closer to the preview, without this final
averaging. He had been using the healing brush to try
177
T
9 (MILD)
B1
3 (MILD)
B2
1 (MILD)
T
5 (MILD)
Appendix A
110
111
112
113
114
to remove wrinkles and shadows under a person's eyes.
He had selected as the healing brush source a bright
area of the cheek, and as he brushed, the preview was
light, but when he released the mouse button the
result was darker, presumably because the area above
where he had brushed was dark. He ran out of time, so
wasn't able to reduce this darkening/averaging effect
from his applications of healing brush.
One user failed to completely undo a set of brush
operations on her image, since she could not
determine how many steps she needed to retreat. She
expressed an intent to darken a tulip, applied the
Dodge tool, and then decided to reverse it. She judged
the effect of each undo by watching the image while
using the keyboard to undo. She did not use the
History window, either by clicking on it or watching
the Dodge Tool entries disappear.
Several users could not figure out how to set the
'tolerance' for the quick selection tool (NB: brush size
is an implicit kind of tolerance). One said that she was
used to the tolerance from the magic wand tool, and
couldn't find any corresponding feature in the quick
selection tool. She abandoned the tool in favor of
other selection tools. Another user continued to use
the quick selection tool, but settled for approximate
selections.
One user had difficulty moving a selected part of his
image with the 'Image->Transform->Rotate'
command; when dragging on the cross-hair in the
middle, he expected the whole image to move - but
only the crosshair itself moved. It is unclear whether
the user eventually found success in moving the image
with this tool.
One user found it difficult to distinguish the behavior
of the Magic Wand and Quick Select tools. He was
using the Magic Wand tool but was expecting it to
behave like Quick Select (by adding to selections). He
said 'there used to be a plus sign and a circle and I
don't know where that went.' He was trying to select a
flower to change its color. He eventually went back to
the toolbox and discovered the quick select tool under
the context menu for magic wand. He went on to use
quick select but still referred to it as magic wand.
One user reported that he could not find an easy way
to zoom out so that the entire image fit in his image
window, without changing the size of the window
itself. He tried the 'fit screen' command under the
178
T
8 (MILD)
B1, B2, S, T
15 (MEDIUM)
B1, B2
6 (MILD)
T
3 (MILD)
S
3 (MILD)
Appendix A
115
116
117
118
119
zoom toolbar, but this actually changed the size of his
image window frame; he only wanted to change the
zoom level on his image. He worked around it by
manually zooming out using the zoom tool.
One user, while dragging the mouse with the quick
selection tool, expressed surprise when his selection
suddenly 'jumped' to include a much wider area (even
though his mouse movement was quite subtle). He
dragged from left to right with the quick selection
tool, over the teeth of a woman in a portrait. When
his mouse barely moved over a dark portion in the
corner of the mouth, his selection suddenly grew to
include the entire area of the lips. He abandoned the
quick selection tool, and started over with the polygon
lasso tool.
One user created a new image, and said that he was
surprised when its dimensions were not the same as
the rectangular selection in his old image. (His goal
was to form a new image, out of the contents of the
selection.)He does not know how he corrected the
problem; he just tried repeating his steps. Most likely,
the contents of his clipboard had changed (from his
first attempt at copying the image), so the new image
was the right size.
One user was trying to select part of the image, but
had forgotten that he was using the dodge tool
(instead of the rectangular marquee tool). He realized
his mistake immediately after mistakenly dodging,
reversed his dodge operation, and then switched tools
and performed the selection.
One user reached the limit of the undo history, but
did not realize this; he just kept tapping out the
command shortcut on the keyboard without
commenting. (NB: unless one watches the history
palette, there is no visual or audible feedback provided
when a user fails to step backward.) It is not clear if he
ever even noticed the reason that he could not undo
all of his mistakes.
One user had difficulty closing a loop with the
magnetic lasso tool; he clicked multiple times with the
mouse near where he thought he had begun the
selection, but none of his clicks were quite close
enough to close the loop. His failure to close the loop
continued to produce negative consequences; he
moved his mouse outside of the image window, and
was surprised when the image scrolled to
accommodate his continued lasso stroke. He says that
179
B1, B2, S
5 (MILD)
B1, B2
1 (MILD)
B1
1 (MILD)
T
10 (MEDIUM)
B1, B2
8 (MILD)
Appendix A
120
121
122
123
he abandoned the magnetic lasso tool, and worked
around the problem by selecting a different lasso tool
(but does not remember which).
One user mistakenly chose the wrong tool from the
toolbox, and blamed his error on the size of the
buttons. He selected the healing brush from the
toolbox instead of the clone stamp tool, then realized
his error. He said 'these buttons are so small that you
frequently select the wrong tool.. and you don't realize
that you selected the wrong thing until you do an
operation.' He was using the clone stamp tool to
retouch an area of a portrait. He tried again to select
the right tool.
One user was unsatisfied with the default results of
the Lighting Effects filter, surprised that it made his
selection darker rather than lighter. He opened the
Filter/Render/Lighting Effects dialog in order to
brighten the highlights on an object that he had
selected (dark grey statue with some specular
highlights). He clicked OK, applying the default
settings, and his whole selection got darker so he
undid it. He said 'I hoped it would be lighter but it
turned out to be darker ... I figured something called
lighting would help but it didn't really do the job.' He
was trying to make the statue look shinier. He said
that he 'finally ended up working with color and
brightness' and got the result he wanted.
Several users could not figure out how to expand a
selection with the magic wand tool. One user thought
that he could drag with the magic wand along the edge
of a selection to expand it, and was surprised when the
effect was to move the selection (rather than
expanding it). After several failed attempts, he learned
to shift-click incrementally outside of the boundary to
expand his selection. Another user thought he could
add to the selection by Alt-clicking on an area outside
his selection. The message 'Warning: No pixels are
more than 50% selected...' popped up, he said 'that was
weird' and read the message. He said 'when I was
holding alt I was thinking it would extend... but alt
appears to do something else.' He abandoned the tool,
but was able to succeed with the quick selection tool.
One user had difficulty using the 'clone stamp tool,'
forgetting to click to set the source point (even though
she knew this was required). A few seconds before the
clone operation, she held down the 'alt' key with her
mouse over the intended source point. She appears to
180
T
2 (MILD)
B2
1 (MILD)
B1, T
5 (MILD)
B1
1 (MILD)
Appendix A
124
125
126
127
have forgotten to click with the mouse, however. She
then moved over the target, and clicked to begin
cloning. The source for the clone was not where she
wanted it. Right away, she realized her mistake,
reversed her errant cloning action, and reset the source
point.
Several users experienced difficulty with the magicwand tool; they were not aware of the tolerance
setting, so could not control how much it selected. A
representative user clicked inside the eye of the
woman with the magic wand tool. An area much
larger than the eye was selected, to the user's surprise.
He gave up on the magic wand tool almost
immediately, choosing to try the quick selection tool
instead. The other two users also abandoned the
magic wand, but they were able to use lasso tools to
grab their selection.
One user had difficulty making a selection with the
lasso tool, since her hand was not steady enough with
the mouse. She began drawing with the lasso tool, to
select the teeth. Starting from right to left, she dragged
with her mouse. When she tried to form the left edge
of the selection, her mouse slipped. She tried to back
up and fix her selection, but then let go of her mouse.
The selection clearly did not look right, so she
abandoned it, reversing the entire lasso command
(which had taken her considerable time to draw). She
tried it again, and was more successful in defining the
region that she wanted.
One user brightened an area of her image with the
dodge tool (and default settings), realizing afterwards
that the effect applied too much to the shadows; she
was unaware of the 'range' setting for the tool. Having
previously selected the teeth, she attempted to dodge
them. She realized that the areas between the teeth
were losing definition, since they were becoming just
as bright as the teeth. She reversed her action. She
recovered by manually deselecting the areas between
the teeth, by setting her brush size to 1 px and
deselecting in these regions.
One user failed to learn how to use the clone stamp
tool by experimenting with it. A dialog box pops up
telling him 'Could not use the clone stamp because
the area to clone has not been defined (Alt-click to
define a source point).' It is not clear if he read this
carefully. During the retrospective, when asked by the
moderator how he used the clone stamp tool (19:20),
181
S, T
18 (MEDIUM)
B1, B2
15 (MEDIUM)
B1, B2
2 (MILD)
T
1 (MILD)
Appendix A
128
129
130
131
132
he says, 'not successfully; I don't know how to use it.'
He avoided it for removing shadows under the eyes
and earring removal.
One user experienced difficulty using the polygon
lasso tool, thinking that one should click and drag
with the mouse to use it (instead of click-move-click).
He clicked and dragged with the tool, and nothing
happened. He then clicked a few times randomly with
the tool, seemingly confused. He tried using a
different tool (the quick selection tool), and then says
that he came back to the polygon lasso tool and used it
successfully. He said that the tool 'should be more
intuitive'. His partner in the retrospective agreed.
Several users thought that 'Flip Canvas Vertically'
would automatically straighten their crooked image;
they was surprised by the reflected result. They
selected the Rotate Canvas->Flip Canvas Vertically
option. Realizing that the result was not intended,
they reversed his flip command and proceeded. These
users successfully worked around their confusion by
using the 'Rotate Canvas->Arbitrary…' command.
Several users, while clicking the mouse with the quick
selection tool, expressed surprise when their selection
suddenly 'jumped' to include a much wider area (even
though the mouse movement in between clicks was
quite subtle) Note: This problem is different from
#116 in that the users were clicking, not dragging,
with the mouse. The frustration was evident in users'
comments. One user eventually succeeded in using the
tool (after a minute of experimentation), while
another abandoned it completely in favor of other
selection tools.
One user experienced difficulty using the 'Select Color
Range' dialog; the presets he chose resulted in empty
selections. First, he selected an object (a statue) and
opened Color Range to brighten the reflections. He
chose the Highlights preset and clicked okay. The
warning popped up 'No pixels are more than 50%
selected. Selection edges will not be visible.' He
quickly closed the warning then went on to a different
task where he also wanted to do a Color Select, this
time on a flower. He selected the Yellow preset and
again got the 'No pixels...' warning. He said 'it's not
working.' While he never overcame the problem, he
did eventually work around it by selecting the image
areas manually.
Several users were surprised that the Crop tool does
182
B1, B2, S
2 (MILD)
B2, S, T
2 (MILD)
B1, B2, S, T
4 (MILD)
T
10 (MEDIUM)
S, T
5 (MILD)
Appendix A
133
134
135
not work with an existing selection. They selected a
rectangular part of the image, intending to crop the
image to this area. Next, they chose the crop tool, and
clicked with it on the selection. The image was not
cropped, and their selections were lost. (Photoshop
interprets the crop as a deselect event.) The users
worked around the problem by dragging the crop tool
to define the cropping area. Effectively, their original
selection became a wasted step.
One user experienced difficulty using the help
window as a reference while using the software, since
it did not stay on top of his (maximized) Photoshop
window when he returned to use Photoshop. This
forced him to rely on his memory while trying to
execute instructions from the help. The user selected
an area and wanted to rotate it. He immediately went
to help without trying anything else first, and quickly
scanned for the path to the Rotate command. Edit >
Transform > Rotate. Somehow, he added the word
'Select' in there when he repeated it back. The Help
Viewer, being a separate application, disappeared
behind the Photoshop main window when he went to
make the menu selection. This by itself didn't surprise
him, but he did forget the path to the command and
had to return to the Help Viewer to read it again. He
was trying to find a way to rotate the image (help was
the first thing he tried) He went back to help to read
the instructions again.
One user found himself repeatedly confused by the
tone balance controls in the Color Balance dialog,
while trying to remove a color cast across an entire
image. He opened the Color Balance tool dialog and
experimented with the three color sliders without
getting the result he wanted. Then he appeared to
notice the tone balance controls and said 'now this is
what happens when I'm on Photoshop. I see all this
other stuff I want to try ... just because it's present.' He
clicked Shadows and tried the color sliders again, then
Highlights but said 'I feel like it's not helping me
achieve my goal.' He later used the tool in a different
area and was switching between all three tone modes
but seemed to be doing so randomly. After more
tweaking he stopped and said it was adequate and he
was satisfied with the result.
One user said that he was surprised when the behavior
of the zoom tool was to zoom out (not in); he did not
expect the mode setting to stick after he switched
183
T
6 (MILD)
T
4 (MILD)
S
1 (MILD)
Appendix A
136
137
138
139
tools. Some time earlier, he had changed the mode of
the tool to zoom out, and then used a different tool.
Then he clicked once in each of his image windows
with the zoom tool, and the images zoomed out. Then
he clicked on the zoom tool in the toolbar (even
though it was already selected). He clicked again in
one of his image windows, and the image zoomed out.
After about 15 seconds of playing around, he reset the
behavior of the tool to zoom in, by clicking on the
zoom mode setting on the toolbar.
One user was surprised when the Rectangular
Marquee tool did not allow him to select a tilted
rectangle. His image was a photo, rotated at about 5
degrees, inside a white border, and he wanted to
straighten and crop the photo. He selected the
rectangular marquee tool and tried to drag it out over
a rectangle that was tilted at about five degrees. He
realized from the marquee that it was not working and
said 'rectangular selector did not work because the
image is not rotated, so I think I want to rotate the
image first.' He gave up on selecting a rotated region,
and used the Rotate Canvas command instead to
rotate the whole image.
For some reason (it's not clear why), a user needed to
duplicate the background layer before she could select
the Color Balance dialog. The Color Balance item was
greyed out in the image/adjustments menu so the
moderator suggested that she duplicate the layer and
then try again. She was then able to select color
balance. She had previously changed the workspace to
Color and Tonal Correction (just because, she said,
she 'was looking for words [to do with modifying the
color].' She had also deselected and reselected the
color channels and possibly done something else in
that palette to prevent edits to the background (it's
not clear in the video how she put it into this state).
One user complained about the rendering appearance
at non-integral zoom levels. 'In Photoshop CS3, I
really don't like how when you do this [zoom], it's all
ugly and pixellated and then on the even percentages
it's better, but on the uneven percentages, it's all, you
know, weird and funky [continuing to zoom in and
out].' It is not clear whether she avoided non-integral
zoom levels because of this issue.
One user failed to realize that each Paste command
creates a new layer, causing him considerable
confusion. The user decided to copy and paste to
184
T
2 (MILD)
T
5 (MILD)
T
10 (MEDIUM)
T
45 (SEVERE)
Appendix A
140
141
142
143
144
remove the earrings from a photo. This works OK for
the first two areas he copies and pastes (the first copy
worked because it was part of the original layer and
the second just happened to be part of the new layer),
but he is not aware that he has created two new layers.
(It is also not clear if the user even understands what
layers *are* in Photoshop.) When he tries to copy an
area that does not exist in the active layer, he gets the
dialog box 'Could not complete the Copy command
because the selected area is empty.' He gets this
message seven times before moving on. Twice the
moderator asks him what's going on and he says, 'I
don't know.' He gives up on his copy/paste strategy,
and resorts to manually painting away the earrings
with the brush tool.
One user mistakenly believed that the 'Auto Color'
feature could be used to adjust the hue of a selected
part of his image. He had selected a yellow flower and
chose the Auto Color command because he wanted to
change it to red. The result was yellow and white so he
undid it. He said 'instead of changing the color some
... other change was going on.' It is not clear why he
thought that the Auto Color feature would change
the color of his flower to red.
One user said that she found it tedious to accomplish
what she considered to be common, beginner tasks in
Photoshop. She asked for more automated tools for
beginners (an 'eye color changing tool, or teeth
whitening tool or wrinkle removal tool or shadows...
sort of like the red-eye removing tool.') These were
tasks that she accomplished manually but had minor
problems with.
One user had difficulty creating elliptical selections,
since he was unable to find a way to adjust the
parameters of the ellipse after creating it. Using the
elliptical marquee tool, he drew an ellipse over the left
eye, then drew an ellipse over the right eye. He then
redrew the right ellipse to better match the outlines of
the eye. His workaround was to draw the ellipse
multiple times, rather than editing a single one. It
took him many tries to get it right.
Several users struggled to find the right foreground
color to use with the color replacement tool. One had
to try 11 different foreground colors before finding
one that worked.
One user reported surprise when her use of the line
tool resulted in the creation of a new shape layer - she
185
B2
1 (MILD)
T
7 (MILD)
B1, B2, S
4 (MILD)
B1, S, T
4 (MILD)
B1, B2, S
5 (MILD)
Appendix A
145
146
147
148
just wanted to fill the pixels in the current layer. She
recognized that this is the default behavior of the
program, but said that she 'rarely uses shape layers'.
She selected the line tool, and drew a horizontal line.
After a few seconds, she reversed this action, saying
that she did not wish to create a new shape layer. (She
just wanted to change the color of the pixels in the
layer -- nothing more than this.) This problem had
minor consequences for her - after just a few seconds,
she switched the mode from 'shape layer' to 'fill pixels',
and redrew her line successfully.
One user experienced difficulty finding the polygon
lasso tool in the toolbar; he expected it to be in the
same sub-menu as the rectangle/ellipse marquee tools,
but it wasn't. The user opened the hidden tools
behind the elliptical marquee tool. Then he closed this
sub-menu and opened the lasso tools, selecting the
polygon lasso tool. It took him about 2 seconds to find
the tool - this problem did not cost him much time.
Several users experienced difficulty in rotating their
image with Edit->Transform->Rotate; they did not
realize that they needed to convert their background
layer into a regular layer before the rotate command
became available. One user realized the problem
immediately, but she said that she thought that new
users would have trouble with it. Another user did not
understand the source of the problem, but was able to
work around it by selecting his entire image. (NB: The
Edit->Transform->Rotate command becomes
available after a selection is made, if you are working
on a background layer. If working on a nonbackground layer, then it doesn't matter if you have
selected anything.)
Many users accidentally applied tool-actions to their
image when trying to set the focus for an image
window by clicking inside of it. The consequences
were sometimes mild, sometimes severe. A mild case:
the user noticed the unintended action right away,
and simply reversed it. A severe case: one user clicked
with the rectangular marquee tool, which caused his
selection to disappear (without him noticing). Next,
he used the zoom tool, noticing only afterwards that
his selection was gone. He concluded errantly that
when you use the zoom tool, you lose your selection.
One user had difficulty finding the right blending
mode for his layer, saying that it is difficult to predict
what effect each blending mode option would have.
186
S
1 (MILD)
S, T
5 (MILD)
B1, B2, S, T
7 (MILD)
S
6 (MILD)
Appendix A
149
150
151
152
On a separate layer, he had drawn a small red splotch
covering an area of his image that he wanted to give a
red tint. He was trying to blend this with the
background layer, to achieve a desired tinting effect.
He flipped through the various blending modes, but
says that none of them were 'intuitively described.'
(This required him to try each one in turn, to find one
that worked.) After trying all of them, he gave up on
his whole strategy - deleted the layer, and tried using
the color replacement tool instead.
One user realized that he had overdone a 'blur' effect
with a parameter that was too strong; he could not
find a way to change this parameter after the fact, so
he started over from scratch. After inspecting the
image, he says that he decided he had overdone a blur
effect along the boundary between two parts of his
image. He reversed his blur operations, and decreased
the strength of the blur to 25%. He then began reblurring his image. He did not find a more efficient
way to accomplish his goal. It's not clear from the
video how long this took, but he needed to re-paint all
along the boundary.
Several users were surprised that the paint bucket tool
did not completely fill their selected region; they did
not expect it to have a 'tolerance'. In one case, a user
tried to overcome this by painting with a 1000 px
brush. However, the bucket misses a spot, and the user
never notices this dark spot. Her failure at the task can
be attributed to this problem.
One user had difficulty finding the crop tool in the
toolbar, saying that 'a lot of the icons look like a
rectangle'. He moved his mouse over many of the tools
(apparently trying to get tooltips to appear over them - but with no success). His mouse came to rest over
the rectangular marquee. He paused for about five
seconds. He then moved his mouse again over the
tools, and this time the tooltips were displayed. He
found the crop tool at this point, after about 20
seconds of searching.
One user experienced difficulty using the quick
selection tool to add to his selection; when he released
the tool, the selected area changed (to his surprise).
The user clicked inside the eye of the woman with the
quick selection tool. As he dragged, the tool showed a
preview of his selection. But as soon as he released the
mouse, the selection changed. The user said that he
was surprised by the change; he wanted to keep what
187
B1
4 (MILD)
T
10 (MEDIUM)
S
2 (MILD)
S
2 (MILD)
Appendix A
153
154
155
156
the preview had shown. He apparently discovered that
subtracting from the selection was more controllable
than adding to it. So his workaround was to add more
than he wanted, and then carve away at the edges until
he reached his goal.
One user experienced difficulty navigating the history
palette; it was difficult to know how far back in time
to go to reach a certain image state. The user had
performed two sets of 'dodge' operations. The first set
was to lighten the skin of a woman, and the second set
was to lighten her teeth. He decided he had overdone
the teeth-lightening, so had to step backwards to just
the point where he had transitioned from skinlightening to teeth-lightening. The problem was that
all the commands in the history were dodge
operations; they looked identical in the history
palette. He eventually found the right place in the
history, by watching the image closely as he moved
backwards and forwards through the history palette.
Several users experienced difficulty setting the size of
the brush; from the toolbar brush palette, they could
not predict how large the brush would appear in the
image. This resulted in inefficient cycles of set-andtest behavior; the user would set the size of the brush,
move it into the image, then change the size of the
brush again, move it into the image, etc. All of these
users eventually found the right brush size through
trial and error.
When applying the color replacement tool multiple
times in 'Color' mode with a foreground color of
(R:255,G:0,B:0), one user was surprised that the
resulting colors in the image got lighter and lighter; he
expected the opposite to occur. He clicked and
dragged once with the color replacement tool,
changing the tulip from yellow to light red. The red he
got was brighter than he wanted, so he tried to apply
the tool a second time. (The assumption was that each
time you apply the tool, it gets closer to the color you
have set as the foreground color.) But the result was
the opposite - the color got lighter and lighter. He
does not say if he found a way around it.
One user had difficulty finding a way to change the
size of his brush. He searched for 'brush thickness' in
the help center, but could not find what he was
looking for. He described this as 'very frustrating'. He
says that he did eventually find a way to change the
brush size, but doesn't say how he learned this.
188
B1, B2
3 (MILD)
B1S
9 (MILD)
B1, B2, S
2 (MILD)
S
8 (MILD)
Appendix A
157
158
159
160
One user had difficulty making precise rotations,
because he always held down the shift key. He was
using the Edit->Transform->Rotate command to
rotate a selection (a tilted rectangle) to make it
upright. Whenever he dragged with the mouse around
the selection to rotate he held down the shift key, so
the angle increments were always larger than he
wanted. When asked in the retrospective why he did
this, he said 'I think it's from other Adobe programs
that I use shift a lot to rescale things and I don't
remember why I use shift.' Asked which programs, he
said InDesign and Illustrator. He never realized his
error, but he did manage to work around the problem;
he noticed the angle field in the tool's options and was
able to enter a number after a few tries to get the angle
he wanted.
One user found the Healing Brush tool had no visible
effect (for some reason - it's not clear why). The user
selects the Healing Brush, clicks, gets a dialog box
telling him to Alt click on the source, which he does,
and then his subsequent painting operations have no
visible effect. 'It seems like it's not very effective' the
user says. (I couldn't see any effect, either).
According to the history that scrolled up later, he did
deselect before applying the healing brush, and healing
brush applications appear in the history. This was not
the behavior he (or [the evaluator]) expected. He
abandoned the Healing Brush, and used the Clone
tool instead.
One user, trying to remove a color cast, searched for
'tint' in the help system and found no results. When it
brought up no results, he said sarcastically, 'That's
wonderful,' and started scanning the Filter menu.
Evaluator note: what's interesting is that tint and filter
are expert photography terms for describing and fixing
this problem, but they were of no use. Also, he
immediately went to help for figuring out rotation,
too, implying that he tends to rely on help when
learning a new application. However, once help failed
to help him here, he did not consult help again for the
rest of the study.
One user expressed frustration with finding 'things'
(it's not clear what things) in Photoshop. When asked
for general comments in the retrospective, he said
'with Photoshop there's just this kind of... toolbox
where everything is very neatly organized in tiny tiny
drawers in a huge wall, so it's like everything is there
189
T
1 (MILD)
T
5 (MILD)
T
6 (MILD)
T
15 (MEDIUM)
Appendix A
161
162
163
164
165
166
and you know that everything you want in the entire
world is there but it's hidden away in these tiny
drawers... and they all look the same.'
Several users had difficulty predicting the behavior of
the quick selection tool, given a certain brush size;
they resorted to a 'guess and check' strategy. One
found a brush size that worked after only a few tries,
while another struggled more, trying 4 different brush
sizes. He ultimately gave up on the quick selection
tool, choosing the lasso tool instead.
One user expected to be able to zoom in on a
rectangular region of the image by selecting it, and
double clicking. He selected a region of the image
using the rectangular marquee tool, and then double
clicked in the middle of the selection. The user says
that he was expecting that Photoshop would zoom in.
Instead, the selection was cleared and the zoom level
remained the same. He says that he was just used to
being able to do this (from other software tools - he
doesn't say which ones). He realized quickly that he
needed to use the zoom tool, and he did this.
Many users adopted a slow strategy of guess-and-check
to find a desired angle for the 'Rotate Canvas'
command. Some users actually looked for a way to
interactively control the angle, with no success. The
others seemed satisfied to continue guessing angles
until they found one that worked. (But even in the
case where the users were satisfied, it still took them
many attempts to find the right angle.)
One user complained that the magic wand tool
tolerance default setting is too high. Just before he
reported this, he clicked with the magic-wand tool on
the image and it selected a region that was more than
he wanted.
One user experienced difficulty changing the
foreground color with the color picker; she expected
that the hue bar could be used to choose the actual
color (not just the hue component of the color. He
clicked on the foreground picker, which showed the
current color of black. She clicked in the hue bar at red
(apparently expecting the color to be set to that shade
of red) then clicked OK, so her color was still black.
She then brushed and got a grey result so she tried
again. On the second try with the color picker she
clicked inside the color square and got red.
One user had difficulty using the crop tool, because
the cursor obscured where he wanted to begin
190
B1, T
10 (MEDIUM)
S
1 (MILD)
B1, B2, T
12 (MEDIUM)
B2, S
1 (MILD)
T
1 (MILD)
B1, B2, S
2 (MILD)
Appendix A
167
168
169
170
171
cropping. He made several aborted attempts to crop
the image, each starting at a slightly different location.
It took him about 30 seconds to succeed in cropping
the image (and even then, he is convinced that he cut
out part of the image by accident). He never found a
workaround to this problem; he just guessed and
hoped he had the right spot. (This problem is made
worse since the user doesn't appear to have realized
that he could adjust the cropping window after
creating it.)
One user experienced difficulty understanding the
toolbar options for the magic wand tool, calling them
'counterintuitive'. He had been trying to select the
background of his photograph, but one of his magic
wand commands accidentally included some of the
foreground. He moused over each of the options in
the toolbar for the magic wand. He says that he
eventually decided to try adjusting the tolerance
downwards.
One user had difficulty finding the brightness/contrast adjustment command, in the menus.
(Note: This is different from problem #23, in that this
user knew what he was looking for.) He cruised
through the 'Image->Adjustments' menu, eventually
selecting the 'Brightness/Contrast' option (after about
10 seconds of searching). He reported that it was
difficult to find, even though he knew what he was
looking for...
One user had difficulty finding the 'Image
Adjustments' menu. She browsed various menus.
After about 15 seconds, she found the menu.
Many users wanted a way to *automatically* crop the
canvas exactly to their photograph, but could not find
it. (NB: File->Automate->Crop and Straighten
Photos would have done the trick, but these users
missed it.) For some, it was a question of accuracy they worried that a manual cropping might lose some
pixels of the photo. For others, it was a question of
efficiency; they lamented having to manually crop and
rotate because it took a long time to get right.
Several users had difficulty aborting a magnetic or
polygon lasso tool operation. They clicked frantically
in the window, attempting just to get the tool to stop
selecting parts of his image. They eventually succeeded
in exiting the tool, although this appears to have been
sheer luck in both cases. One abandoned the tool,
while the other tried again, being careful not to make a
191
B1, S
2 (MILD)
S
1 (MILD)
S
1 (MILD)
B2, S, T
30 (SEVERE)
B2, S, T
10 (MEDIUM)
Appendix A
172
173
174
175
176
mistake this time.
Several users accidentally hit 'Caps Lock,' which
changed their mouse cursor into a '+' (making it
difficult to see how large the brush was). The users did
not realize why their brush cursor had changed, and
resorted to a strategy of trial and error in order to use a
brush, or adjust the brush size. This problem caused
frustration and difficulty throughout the study
session.
One user tried to dismiss a dialog box by *doubleclicking* on the 'OK' button, which led to a chain
reaction of problems. Her first click dismissed the
dialog, but the second click caused an action to occur
in the image. This led to an unfortunate chain
reaction: she ended up activating the window and
selecting part of the background. Because both the
goal window and her window now had two selection
events in the history, she wasn't sure which she was
undoing when she clicked on the history window, and
seemed surprised by the results in her window. She did
not seem to notice that the goal window had been
activated accidentally by the dialog box dismissal. She
quickly reoriented herself once she clicked in her own
window.
Many users failed to notice the (modal) confirm/cancel controls for tools that require them (eg,
crop tool). Two thought their tool operation was
complete, and couldn't understand why other
commands were unavailable. Several more tried to
abort the in-progress action by pressing undo, but
undo had no effect in the mode. One cursed in front
of the experimenter in frustration. These users
recovered eventually, but only after they noticed the
dialog controls.
When creating a new image, one user expected the
default color to be transparent; instead, it was white.
He created a new image, then pasted the photograph
into it. He says that he realized the background was
white, not transparent. He reversed the paste, closed
the new image, and re-opened the new image (this
time choosing 'Transparent' for the background
contents).
One user was confused as to the meaning of the
'Source Document' in the 'Load Selection' command.
With one image window in focus he opened the 'Load
Selection' dialog. He selected the *other* window as
the source document, and loaded his selection. He says
192
T
15 (MEDIUM)
T
1 (MILD)
B1, B2, S, T
14 (MEDIUM)
B1, B2
3 (MILD)
S
1 (MILD)
Appendix A
177
178
179
that he was surprised when it loaded in his focused
window; he says that he expected it to load in his
'source document' window. After a few seconds of
confusion, he worked around the problem by
changing the focus to the other window, and reloading the selection.
One user tried to use the Slice tool as a selection tool.
He single-clicked several times with the slice tool in
the middle of his image, and nothing happened. After
about 5 seconds, he switched tools to the quick
selection tool. In his retrospective, he acknowledges
that he had the 'wrong tool,' but it is not clear if he
knows what the slice tool is useful for.
Many users mistakenly believed that they needed to
select the entire image before applying any global
image adjustments or filters, rotating the entire
canvas, or using brushes to modify the whole image. In
one image adjustment case, the user selected the whole
image by dragging with the rectangular marquee tool,
and might have failed to drag over the whole image. In
general, however, the selection of the whole image was
harmless (but an unnecessary extra step).
Several users could not figure out how to modify the
hue of a region (while preserving relative brightness
values). (Note: This is similar to problem #103, but in
this case the goal was to modify the hue, rather than
brightness.) One user tried to use the 'Brush' tool in
normal mode; the result was a solid-colored region,
which was not what the user wanted. Another tried
selecting the area and using the paintbrush tool; again,
the result was a solid-colored region. The users both
gave up on their tasks, unable to find any alternative
strategies.
193
S
1 (MILD)
B2, T
8 (MILD)
B1, T
10 (MEDIUM)
Appendix A
194
B
Usability Testing Protocols
This appendix documents the original usability testing protocols for all of our experimental
studies. For ease of referencing, we refer to the studies as follows:
SketchUp Study
Comparison of backtracking analysis to self-reporting
(Section 4.1)
Photoshop Study 1 Comparison of backtracking analysis to self-reporting
(Section 4.2)
Photoshop Study 2 Comparison of backtracking analysis to traditional lab testing
(Chapter 6)
The contents of this appendix include instructions to participants (B.1-B.3), transcripts of training videos (B.4-B.6), the procedure used to merge usability problem instances
(B.7) and instructions to the professional usability testing moderator and evaluators that we
employed in the think-aloud condition of Photoshop Study 2 (B.8-B.9).
195
Appendix B
196
B.1 SketchUp Study: Participant instructions
Below is the testing protocol for the Google SketchUp usability study described in Section 4.2.
Video tutorials
In this section of the study, you will be watching three short instructional videos on
SketchUp, designed for new users. Please pay attention to the user interface concepts being
introduced – you will use them to build your own models in SketchUp! During the videos,
you are welcome to take notes below if you want.
Instructions for reporting issues
For the purposes of this part of the study, we want you to report an issue when you
experience an interaction that hinders you in using the software. One indication that you are
experiencing an issue would be if you are feeling confused, surprised, annoyed, or frustrated
with the software.
This is not a test of your performance or ability; it is a test of the SketchUp software
and documentation. Our goal together is to identify as many issues as possible, so that we
can improve the design and documentation for SketchUp. The SketchUp design team needs
your help in this endeavor; while many of you may be novices at SketchUp, you are experts
at being novices. When deciding whether to report an issue or not, try not to make a
distinction between issues caused by the interface and issues caused by your own inexperience; don't worry about assigning any blame for the difficulty. If you find yourself
experiencing the same issue repeatedly, please report the issue each time that you experience
it.
To report an issue, you press the “report issue” button, which will be located in a
dialog box in the upper-right corner of the SketchUp window. Please do not close the issue
reporting dialog box. If you do close the window, you can re-open it by selecting the “Issue
Reporting Dialog” under the “Window” menu.
Appendix B
197
While you are working in SketchUp, you need only press the button to report an
issue. Later, you will have the opportunity to comment on some of the issues that you
reported. When collecting this commentary, we will show you screen capture video of each
of your button presses to remind you of what was going on.
You will now watch a video showing some examples of the types of issues you might
experience in SketchUp.
Practice
Having watched the videos, now is your chance to begin exploring SketchUp!
Open SketchUp by double-clicking on the icon “exploration” on your desktop. You
should see an empty scene in SketchUp. The title of the SketchUp window should say
“explore_mine”.
Before we start, we need to turn on video recording for each of the laptops. Press the
‘F2’ key exactly once on your laptop. It should say, “HyperCam - Recording” in the taskbar
at the bottom of the screen. If you aren’t sure if this worked, let us know and we’ll take a
look.
Do whatever you want to explore SketchUp during the next 10 minutes. Try building a simple model of something. You are welcome to refer to any notes you took while the
videos played.
During this time, please practice reporting issues when you experience them.
Bridge task, phase 1
In this task, you will try to build a model of a simple bridge with a curved walkway.
1.
Make sure that you close the current copy of SketchUp that you were running.
2.
Find the bridge printout in your packet of instructions. This represents your
goal in this exercise; you will be trying to model this simple bridge. Your bridge
should have the following features:
Appendix B
3.
198
•
Four legs (the “verticals” of the bridge)
•
A curved walkway
•
No holes or extra geometry
•
Legs should be of the same height
•
Legs should have the same cross-sectional dimensions
Open SketchUp by double-clicking on the “task” icon on your desktop. You
should see an empty scene in SketchUp. The title of the SketchUp window
should say “bridge_mine”.
4.
Working in the "bridge_mine" window that you just opened, use SketchUp to
model the bridge. Remember – you have two goals in this exercise: building the
model, and reporting issues that occur during the use of SketchUp.
5.
If you finish working early, let the researcher know. He will give you instructions
for an extra second phase to your task.
Bridge task, phase 2
Now that you have completed the basic bridge model, next you will try to extend your bridge
model.
Using your current bridge model as a starting place, try to build the model shown in
the attached illustration. As indicated in the diagram, you will be placing three copies of
your bridge model, back-to-back-to-back. Each segment (which corresponds to your original
bridge model) should be 5 ft. x 5 ft square. Thus, the entire span of the three-segment bridge
should be 15 ft. long. Please do not erase the lines formed at the seams between segments.
You will get no further instructions on how to accomplish this task. Do your best to
figure it out on your own. Remember – you have two goals in this exercise: working on the
task, and reporting issues that occur during the use of SketchUp.
Appendix B
199
If you finish all of the goals early, just stop working and wait for further instructions.
(Do not continue to explore!)
Room task, phase 1
In this task, you will build a simple model of a room, with a door, a window, stairs, and a bed.
1. Make sure that you close the current copy of SketchUp that you were running.
2. Find the “room” printout in your packet of instructions. This represents your goal
in this exercise; you will be trying to model this room. Notice the numbers that indicate some desired dimensions of the room. Also notice the bed; you do not need to
build this yourself! You can insert the bed using the "components browser" (select
the "Components" option of the "Window" menu). Once you have opened the dialog, click on the picture of a house to locate the bed. You can click and drag on the
icon to place it into your scene.
Hint: You may find that you need to rotate the bed into the correct orientation.
The rotate tool was not covered in the tutorials, but it looks like this:
You can try to discover how this tool operates, on your own.
Note that it is also possible to rotate a component using the “move” tool by
left-clicking and dragging on one of the red cross-hairs that appear on the faces of
the component’s bounding box.
3. Open SketchUp by double-clicking on the “task” icon on your desktop. The title of
the SketchUp window should say “room_mine”.
4. Working in the "room_mine" window that you just opened, use SketchUp to model
the room. Do your best to match the dimensions specified in the printout exactly.
(If a particular dimension is not specified, you can make it whatever you want.) Remember – you have two goals in this exercise: building the model, and reporting
issues that occur during the use of SketchUp.
Appendix B
200
5. If you finish working early, let the researcher know. He will give you instructions for
an extra second phase to your task.
Room task, phase 2
Now that you have completed the basic room model, next you will try to extend your model.
Using your current room model as a starting place, try to build the model shown in
the attached illustration. As indicated in the illustration, you will be transforming the
double bed into two single beds (each with a single pillow). You will also be adding shadows
to your scene.
For the shadows to look like the illustration, you will need to make sure of the following:
•
The window in your model must face to the East.
•
The location of the model must be set to Santiago, Chile.
•
The time (of the model – not of your computer!) must be set to 9:30 am, August 15.
You will get no further instructions on how to split the bed or set up the shadows. Do your
best to figure it out on your own. Remember – you have two goals in this exercise: working
on the task, and reporting issues that occur during the use of SketchUp.
If you finish all of the goals early, just stop working and wait for further instructions.
(Do not continue to explore!)
Retrospective commentary
Next we will show you screen capture video of certain episodes during the task that you just
attempted. You will have a chance to answer some questions about each episode. The goal of
this process is to document the episodes such that a third person will be able to understand
what happened during the episodes. Ultimately, the SketchUp design team will use this
documentation to diagnose potential underlying problems with the SketchUp application
Appendix B
201
or the help materials. For the purposes of generating complete answers to the questions,
please assume that this third person is a novice at SketchUp.
There are three types of episodes that we are going to show to you:
1)
Times when you reported an issue.
2)
Times when you used the undo command.
3)
Times when you erased something in SketchUp.
The episodes contain the relevant event (issue report, undo, or erase), plus some context
before and after the event to help you remember what was happening. Some episodes may
contain more than one event (for example, if you pressed undo multiple times within a short
time) – if so, please answer each question for each of the events in the episode. Each event is
identified by a red caption toward the bottom of the video.
You will work in pairs for this part of the study. The experimenter will pair you up
now, and assign you each an initial role: “speaker” or “listener”. (You will swap roles halfway
through this study.) You will be working together to produce answers to the questions that
can be understood clearly by a third person. You will each have a headset with a microphone
that you can wear.
If you are the speaker, you will watch your own episodes and do your best to answer
the prompted questions. To help you to remember what you were thinking at the time of
the issue, feel free to use the video player’s VCR controls (just below the video panel) to
scroll through the video. If you find yourself repeating previous answers, you are allowed to
refer to your previous answers to save time. For example, you might say, “the answers for this
episode are the same as for the previous one.”
If you are the listener, you should listen to the answers and ask clarifying questions
until you fully understand. The listener (not the speaker) is responsible for deciding when to
move on to the next question. For each question, there will be a red “Question has been
answered clearly” button. You should only press this button when you fully understand the
Appendix B
202
answer to the current question. Continue to ask clarifying questions until you feel the
answer is sufficient.
In either role, please try to avoid physical pointing gestures, since these will not be
recorded in the screen-capture video. When you want to refer to something on the screen,
please use your mouse to point; this will be captured in the video.
If you finish answering the questions for all of the episodes for one event type, move
on to the next event type. The order in which you should do these is indicated by the order
of the icons on your desktop (from left to right). Your order may not be the same as your
partner's! When you have finished commenting on all three types of events, notify the
experimenter.
B.2 Photoshop Study 1: Participant instructions
Below is the testing protocol for the Adobe Photoshop usability study described in Section 4.3.
Video tutorials
In this section of the study, you will be watching a short instructional video on Photoshop,
designed for new users. Please pay attention to the user interface concepts being introduced
– you will use them to try your own tasks in Photoshop! During the videos, you are welcome
to take notes below if you want.
Instructions for reporting issues
For the purposes of this part of the study, we want you to report an issue when you
experience an interaction that hinders you in using the software. One indication that you are
experiencing an issue would be if you are feeling confused, surprised, annoyed, or frustrated
with the software.
This is not a test of your performance or ability; it is a test of the Photoshop software
and documentation. Our goal together is to identify as many issues as possible, so that we
Appendix B
203
can improve the design and documentation for Photoshop. The Photoshop design team
needs your help in this endeavor; while many of you may be novices at Photoshop, you are
experts at being novices. When deciding whether to report an issue or not, try not to make a
distinction between issues caused by the interface and issues caused by your own inexperience; don't worry about assigning any blame for the difficulty. If you find yourself
experiencing the same issue repeatedly, please report the issue each time that you experience
it.
To report an issue, you press the “report issue” button, which will be located in a
dialog box in the upper-right corner of the Photoshop window.
While you are working in Photoshop, you need only press the button to report an
issue. Later, you will have the opportunity to comment on some of the issues that you
reported. When collecting this commentary, we will show you screen capture video of each
of your button presses to remind you of what was going on.
The researcher will now show examples of some of the types of issues that you might
experience in Photoshop.
Practice
Having watched the videos, now is your chance to begin exploring Photoshop!
Before we start, we need to turn on video recording for each of the laptops. Press the
‘F2’ key exactly once on your laptop. It should say, “HyperCam - Recording” in the taskbar
at the bottom of the screen. If you aren’t sure if this worked, let us know and we’ll take a
look.
Do whatever you want to explore Photoshop during the next 10 minutes. You are
welcome to refer to any notes you took while the video played.
During this time, please practice reporting issues when you experience them.
Appendix B
204
Tulips task, phase 1
Your goal in this task is to make the image on the left look like the image on the right, using
Photoshop. In particular, you should try to:
•
Rotate and crop the image.
•
Try to fix the unbalanced colors in the image; for example, look at the reddish tint to
the building.
If you find yourself stuck for a long time, feel free to move on to a different part of the task.
Keep working on this task until you cannot easily tell the difference between the two images
at a quick glance. (It’s okay if there are small differences that you can only notice if you look
carefully.) When you are satisfied with your work, please let the experimenter know. She will
give you the next phase of the task.
Note that you are only allowed to look at the goal image (including panning and
zooming) – you can’t copy from it, sample colors from it, etc.
Tulips task, phase 2
Starting from where you left off, your goal in this task is to make the image on the left look
like the image on the right, using Photoshop. In particular, you should try to:
•
Emphasize the shiny reflections on the sculpture.
•
Change the color of the lower-left tulip from yellow to red.
•
Make the color of all of the tulips more vivid.
If you find yourself stuck for a long time, feel free to move on to a different part of the task.
Keep working on this task until you cannot easily tell the difference between the two images
at a quick glance. (It’s okay if there are small differences that you can only notice if you look
carefully.) When you are satisfied with your work, please let the experimenter know. She will
give you the next phase of the task.
Appendix B
205
Note that you are only allowed to look at the goal image (including panning and
zooming) – you can’t copy from it, sample colors from it, etc.
Portrait task, phase 1
Your goal in this task is to make the image on the left look like the image on the right, using
Photoshop. In particular, you should try to:
•
The teeth look a little stained in this image. Make them look cleaner.
•
Change the eye color from brown to blue.
If you find yourself stuck for a long time, feel free to move on to a different part of the task.
Keep working on this task until you cannot easily tell the difference between the two images
at a quick glance. (It’s okay if there are small differences that you can only notice if you look
carefully.) When you are satisfied with your work, please let the experimenter know. She will
give you the next phase of the task.
Note that you are only allowed to look at the goal image (including zooming and
panning) – you can’t copy from it, sample colors from it, etc.
Portrait task, phase 2
Starting from where you left off, your goal in this task is to make the image on the left look
like the image on the right, using Photoshop. In particular, you should try to:
•
Remove the shadows and wrinkles under the woman’s eyes.
•
Remove the earrings from the picture.
•
Change the background from white to grey. It’s okay if there’s a small “halo” around
the silhouette, but try to make it a soft halo (as in the goal image).
If you find yourself stuck for a long time, feel free to move on to a different part of the task.
Keep working on this task until you cannot easily tell the difference between the two images
at a quick glance. (It’s okay if there are small differences that you can only notice if you look
carefully.)
Appendix B
206
Note that you are only allowed to look at the goal image (including zooming and
panning) – you can’t copy from it, sample colors from it, etc.
Retrospective commentary
Next we will show you screen capture video of certain episodes during the task that you just
attempted. You will have a chance to answer some questions about each episode. The goal of
this process is to document the episodes such that a third person will be able to understand
what happened during the episodes. Ultimately, the Photoshop design team will use this
documentation to diagnose potential underlying problems with the Photoshop application
or the help materials. For the purposes of generating complete answers to the questions,
please assume that this third person is a novice at Photoshop.
There are two types of episodes that we are going to show to you:
1) Times when you reported an issue.
2) Times when you used the undo, fade, or history brush commands.
The episodes contain the relevant event (issue report, undo, history brush, or fade),
plus some context before and after the event to help you remember what was happening.
Some episodes may contain more than one event (for example, if you pressed undo multiple
times within a short time) – if so, please answer each question for each of the events in the
episode. Each event is identified by a red caption toward the bottom of the video.
You will work in a pair for this part of the study. The experimenter will assign you
each an initial role: “speaker” or “listener”. (You will swap roles halfway through this study.)
You will be working together to produce answers to the questions that can be understood
clearly by a third person. You will each have a headset with a microphone that you can wear.
If you are the speaker, you will watch your own episodes and do your best to answer
the prompted questions. To help you to remember what you were thinking at the time of
the issue, feel free to use the video player’s VCR controls (just below the video panel) to
scroll through the video. If you find yourself repeating previous answers, you are allowed to
Appendix B
207
refer to your previous answers to save time. For example, you might say, “the answers for this
episode are the same as for the previous one.”
If you are the listener, you should listen to the answers and ask clarifying questions
until you fully understand. The listener (not the speaker) is responsible for deciding when to
move on to the next question. For each question, there will be a red “Question has been
answered clearly” button. You should only press this button when you fully understand the
answer to the current question. Continue to ask clarifying questions until you feel the
answer is sufficient.
In either role, please try to avoid physical pointing gestures, since these will not be
recorded in the screen-capture video. When you want to refer to something on the screen,
please use your mouse to point; this will be captured in the video.
If you finish answering the questions for all of the episodes for one event type, move
on to the next event type. The order in which you should do these is indicated by the order
of the icons on your desktop (from left to right). Your order may not be the same as your
partner's! When you have finished commenting on all three types of events, notify the
experimenter.
B.3 Photoshop Study 2: Participant instructions
Below is the testing protocol for the traditional laboratory testing condition of the Adobe
Photoshop usability study described in Chapter 6.
Greeting
Hi, my name is __________, and I am the experimenter who will be working with you
during this experiment with Adobe Photoshop. I did not design the product, so you won’t
hurt my feelings with any comments you make.
The purpose of this experiment is to find problems in the Photoshop interface. We
want to emphasize that this is not a test of your performance or ability; it is a test of the
Appendix B
208
Photoshop software and documentation. Any difficulties that you may have are because it
wasn’t designed in a way that makes sense to you.
We will be recording the session, so that other researchers may review it later. The
recordings will be used for research purposes only; your name will not be connected with any
of the data collected. If you become uncomfortable with the experiment, you have the right
to stop at any time without penalty,. You are also welcome to ask for a break at any point.
My role in this experiment is that of a neutral observer; I will speak only occasionally
to clarify the instructions, or sometimes to ask you questions to understand your thought
process.
Your role is to be yourself and have fun – you cannot do anything wrong! Your feedback, whether positive or negative, is important to us. Ultimately, we hope that it will help
us to make suggestions to improve the design of the software.
The test session has four parts. First, we will show you a short instructional video on
the Photoshop interface. Next, we will let you practice using Photoshop. Third, we will give
you a particular task to attempt in Photoshop. And finally, we will briefly reflect on your
experiences retrospectively. Any questions?
Video tutorial
In this section of the study, you will be watching a short instructional video on Photoshop,
designed for new users. Please pay attention to the user interface concepts being introduced
– you will use them to try your own tasks in Photoshop! During the video, you are welcome
to take notes if you want.
Practice
Having watched the videos, now is your chance to begin exploring Photoshop!
Before we start, we need to turn on video recording for each of the laptops. Press the
‘F2’ key exactly once on your laptop. It should say, “HyperCam - Recording” in the taskbar
Appendix B
209
at the bottom of the screen. If you aren’t sure if this worked, let us know and we’ll take a
look.
Do whatever you want to explore Photoshop during the next 10 minutes. You are
welcome to refer to any notes you took while the video played. The researcher will be on the
other side of the room while you explore.
Instructions on thinking aloud
While you work in Photoshop, we are interested in what you say to yourself as you work. In
order to facilitate this, we will ask you to think aloud as you work in Photoshop. By
“thinking aloud,” we mean this: we want you to say out loud everything that you say to
yourself silently. Just act as if you are alone in the room speaking to yourself. If you are silent
for any length of time, we will remind you to keep thinking aloud.
To help you understand what we mean by thinking aloud, the experimenter will demonstrate the process (while opening a stapler to fill new staples).
Next, you will have a chance to practice thinking aloud while performing another
simple office task: refilling a tape dispenser.
Tulips task, phase 1
Your goal in this task is to make the image on the left look like the image on the right, using
Photoshop. In particular, you should try to:
•
Rotate and crop the image.
•
Try to fix the unbalanced colors in the image; for example, look at the reddish tint to
the building.
If you find yourself stuck for a long time, feel free to move on to a different part of the task.
Keep working on this task until you cannot easily tell the difference between the two images
at a quick glance. (It’s okay if there are small differences that you can only notice if you look
Appendix B
210
carefully.) When you are satisfied with your work, please let the experimenter know. She will
give you the next phase of the task.
Note that you are only allowed to look at the goal image (including panning and
zooming) – you can’t copy from it, sample colors from it, etc.
While you work on the task, please remember to think aloud. To better understand
your actions and your thought process, the experimenter may occasionally ask you questions.
Tulips task, phase 2
Starting from where you left off, your goal in this task is to make the image on the left look
like the image on the right, using Photoshop. In particular, you should try to:
•
Emphasize the shiny reflections on the sculpture.
•
Change the color of the lower-left tulip from yellow to red.
•
Make the color of all of the tulips more vivid.
If you find yourself stuck for a long time, feel free to move on to a different part of the task.
Keep working on this task until you cannot easily tell the difference between the two images
at a quick glance. (It’s okay if there are small differences that you can only notice if you look
carefully.) When you are satisfied with your work, please let the experimenter know. She will
give you the next phase of the task.
Note that you are only allowed to look at the goal image (including panning and
zooming) – you can’t copy from it, sample colors from it, etc.
While you work on the task, please remember to think aloud. To better understand
your actions and your thought process, the experimenter may occasionally ask you questions.
Portrait task, phase 1
Your goal in this task is to make the image on the left look like the image on the right, using
Photoshop. In particular, you should try to:
•
The teeth look a little stained in this image. Make them look cleaner.
Appendix B
•
211
Change the eye color from brown to blue.
If you find yourself stuck for a long time, feel free to move on to a different part of the task.
Keep working on this task until you cannot easily tell the difference between the two images
at a quick glance. (It’s okay if there are small differences that you can only notice if you look
carefully.) When you are satisfied with your work, please let the experimenter know. She will
give you the next phase of the task.
Note that you are only allowed to look at the goal image (including zooming and
panning) – you can’t copy from it, sample colors from it, etc.
While you work on the task, please remember to think aloud. To better understand
your actions and your thought process, the experimenter may occasionally ask you questions.
Portrait task, phase 2
Starting from where you left off, your goal in this task is to make the image on the left look
like the image on the right, using Photoshop. In particular, you should try to:
•
Remove the shadows and wrinkles under the woman’s eyes.
•
Remove the earrings from the picture.
•
Change the background from white to grey. It’s okay if there’s a small “halo” around
the silhouette, but try to make it a soft halo (as in the goal image).
If you find yourself stuck for a long time, feel free to move on to a different part of the task.
Keep working on this task until you cannot easily tell the difference between the two images
at a quick glance. (It’s okay if there are small differences that you can only notice if you look
carefully.)
Note that you are only allowed to look at the goal image (including zooming and
panning) – you can’t copy from it, sample colors from it, etc.
While you work on the task, please remember to think aloud. To better understand
your actions and your thought process, the experimenter may occasionally ask you questions.
Appendix B
212
Retrospective
Now that you have finished working on the task, we would like to ask you a few questions to
get you to reflect on your experiences with Photoshop today.
[Insert questions here. This is our chance to ask questions that came up during the
test.]
Anything else that you would like to add about your experiences with Photoshop?
B.4 Photoshop training video transcript
Below is a transcript of the video we developed to train participants in the basics of using Adobe
Photoshop.
Welcome to this short introduction to Adobe Photoshop CS3… Photoshop is a huge
application – in this short introduction, our goal is just to explain to you some of what
Photoshop can do, and to help you find some of the more important features.
Let’s begin by talking about the image, shown in the middle. I can open more than one
image at a time, if I want – in this demo, I’m only working on a single image.
An image is made up of individual pixels, or tiny squares of color. If I zoom in far
enough, you can actually see the individual pixels that comprise the image.
I’ll start the tutorial by talking about the image editing tools located in the toolbar on
the left. These tools allow you to select parts of images, crop or slice images, paint on images,
retouch images, draw or type on images, and navigate images.
To select a tool for use, I simply click on the tool with the left mouse button. Notice
that each tool has a different set of options, visible in a panel at the top of the window. As I
click on different tools, the options change.
It’s important to realize that what you see in the toolbar doesn’t represent all of the
tools in Photoshop. There are other tools that are hidden underneath – notice the small
Appendix B
213
black triangle in the lower right hand corner of some tools. If I click on one of these tools
and hold down the left mouse button, other hidden tools with similar functions will appear.
At this point, I can select one of these hidden tools simply by clicking on it.
You can see that the tools are also organized into groups according to function. The
groups are separated by horizontal lines within the toolbar.
Okay, let’s start out by talking about the top-most group, which contains tools for
selecting parts of your image. Selection is a very important concept in Photoshop – it allows
you to apply changes to only parts of your image, leaving unselected parts unchanged.
The simplest selection tool is the rectangular marquee tool. I just select the tool by
clicking on it…
and click and drag with the left mouse button to define a rectangular area.
As I mentioned before, sometimes tools are hidden under other tools. If I click and
hold the left mouse button on the rectangular marquee tool, you’ll notice that after a second
or two, some other tools pop up – tools that allow you to select an ellipse or a single row or
column of the image.
Rectangles and ellipses are great, but what if I want to select a smooth area? I can use
the lasso tool, like this…
Hidden underneath, there’s a polygonal lasso tool and a magnetic lasso tool, which are
variations of the simple lasso tool I just demonstrated.
Finally, there are smart, automated, ways to select parts of an image. The “quick selection” tool allows me to paint a selection. Let’s say that I wanted to select the bottom part of
the duck. I can move my cursor into the area, and simply paint by dragging with the left
mouse button until I have added what I want to the selection. Notice that with this tool
you’re always adding to the current selection – it doesn’t reset the selection when you start
dragging. If I want to subtract from the selection, I can just hold down the alt key while
Appendix B
214
dragging, and paint… This is a general idea in Photoshop – holding down alt while applying
a tool tends to reverse its behavior.
Hidden underneath the quick selection tool is the magic wand tool. This lets me select
areas of an image that are comprised of similar colors. So if I click with the magic wand tool
on the background… I can select it all with a single click. But notice that the whites of the
eyes, even though their colors match the background, didn’t get selected. This is because by
default, the magic wand requires two regions to be contiguous (or, connected), to both be
included in the selection. This contiguous requirement is an option you can toggle in the
panel at the top.
Okay, so once I have made a selection in Photoshop, what can I do with it? One thing
I can do is move it. Let’s try to move one of the eyes of the duck. First I’ll select the eye with
the magic wand…. And then if I select the “Move Tool” at the top of the toolbar, I can then
click and drag on the image, and my selected pixels move accordingly…. Notice that only the
selected regions move – the rest of the image remains the same. I’ll undo this operation to
get back to where I was. Note that undo can be performed by selecting undo under the edit
menu, or by pressing Ctrl-Z, the keyboard shortcut for undo.
At this point I’d like to clear my selection. I can do this by going under the “Selection”
menu and selecting “Deselect All.” You’ll find this a useful command.
The next tool I’ll introduce is the crop tool. Cropping allows you to select a rectangular region of the image to keep, and completely discards anything outside that region. Let me
demonstrate. I can use the crop tool to define a rectangle around the head of the duck, which
Photoshop highlights for me. At this point, I can confirm or cancel the crop operation. To
confirm, I click the checkmark button, and the cropping operation is complete. I’ll undo this
by pressing Ctrl-Z to get back to where I was.
The last tool in this section is the slice tool. This allows you to divide an image into
smaller images – you’re free to explore this tool on your own.
Appendix B
215
Now that we’re done with selection tools, … the next section of tools is all about painting on images. I’ll start with the brush tool, which acts just like a paintbrush. As I move the
cursor into the image, notice that it changes to a circle. The size of this circle indicates the
size of the brush. I can then draw with the brush directly on the image, like this…
I can make the brush bigger or smaller by clicking in the panel at the top… here I pick a
bigger brush, and the size of my circular cursor changes.
I can also change the color of the brush, by left clicking on the foreground color over
here on the left. First I can select a hue that I want…, and then pick a brightness and
saturation within that hue. When I’m satisfied, I hit okay to update the current color… And
now I can draw in red…
Let’s take a second to understand how brushes interact with selections. Say I select
part of the image using the rectangle selection tool… then going back to the brush tool, I
notice that I can only draw inside the selected area! So again, this emphasizes that operations
in Photoshop only affect selected regions.
Okay, next let’s say that I wanted to change the color of the duck’s eyes. If I used the
brush tool, I would unfortunately wipe out the eyes… that’s not what I wanted, so I’ll undo
that. Instead, I can use something called the “color replacement tool,” which is hidden
underneath the brush tool. This allows me to change the hue of the color without modifying
the relative brightness values… producing a more subtle effect than the brush tool.
There are also a set of tools for fixing imperfections like scratches in images. This
includes the spot healing brush, the healing brush, the patch tool, and the red-eye tool. I’ll let
you explore these features yourself.
The next group of tools lets you clone or copy areas of an image. I’ll let you explore
these on your own as well.
Next, there are several different variants of erase tools that allow you to clear out parts
of your image. The eraser replaces whatever you click on with the background color. The
Appendix B
216
default background color is white, but you can change this by clicking on the background
color rectangle at the bottom of the toolbar, like this…
Notice that the erase tool, like the brush tool, also makes use of this concept of a
brush. I can set the size of the eraser in the same way that I set the size of the paintbrush
before.
The next tool is the history brush tool – I’ll skip this for now and come back to it at
the end of this tutorial.
You can also fill an area of your image with a solid color, or a smooth gradient of colors. I’ll let you explore these features on your own.
And finally, the dodge and burn tools allow you to lighten or darken areas of your
image. For example, we can use dodge to lighten the color of the duck’s eyes…
Okay, so we’re done with the tools for painting on the image. The next section contains tools for drawing text and shapes. We won’t talk about these tools today, since you
won’t be needing them in the study.
Finally, the last section of tools include ways to measure, annotate, and navigate
through images. I’ll focus on the bottom two tools, which can be used to zoom and pan
within the image. The zoom tool allows me to click anywhere in the image and zoom in on
that section. I can continue to zoom in further until I reach the zoom level I want. Zooming
can be very useful; it makes it much easier to edit small parts of the image without having to
move your mouse so precisely. Once I zoom in, I can also pan back and forth, using the pan
tool. When I’m ready, I can zoom back out by holding down the “Alt” key and clicking with
the zoom tool. Note that the mouse cursor changes from “+” to “-“ when I hold down the alt
key, to indicate the change in behavior.
Okay, so .. so far we’ve been talking about local tool operations you can perform to
affect part of an image. There are also ways to edit the colors of the image as a whole. If I
look under the “Image” menu, I find a number of commands that I can apply to whole
Appendix B
217
images. Many of the most useful operations are under the “adjustments” menu. For example,
I can adjust the brightness and contrast of the image, simply by moving two sliders. The
effect is previewed, and I can accept the changes simply by clicking “okay.” Note that
commands like this also respect the current selection. If I had selected a small part of the
image, the brightness and contrast changes would only apply to the selected region.
In addition to these kinds of color adjustments, I can also apply special effects to my
image. There are many, many possible effects, all accessible under the “Filters” menu. For an
example of one effect, I can select “find edges” under the “Stylize” submenu. This filter
detects the edges in my image, and emphasizes them. I’ll let you explore other special effects
on your own.
One thing we haven’t talked about yet are the panels visible on the right side of the
screen. These are known as “palettes.” The first palette is the navigation palette – it contains
basic information and an overview of your image.
The second palette is known as the history palette – it contains a list of the editing
operations that you have been performing. By clicking on any of the editing operations in
the history, you can effectively “undo” back to that point in the history.
The third palette helps you to select colors. I can set the current color by dragging the
“red” green and blue sliders, which mix together to form a color. Notice the current color
changing as I drag these.
If I click on the “swatches” tab, I can also just pick a color from a set of examples…
Finally, at the bottom is the layers palette. We don’t have time do go into much detail
on layers, but think of them as multiple sheets for an image, which can be overlaid like
transparencies to form the final image. At any particular time, there is a currently-selected
layer – any editing operations only apply to the currently selected layer.
Lastly, I’d like to talk about some mechanisms you may find to recover from mistakes.
Appendix B
218
Throughout this tutorial, I have been using the “undo” command frequently to backtrack to earlier states. You might be wondering if it is possible to go back multiple steps.
Let’s try it. If I hit Ctrl-Z multiple times, it actually toggles between “undo” and “redo” –
which isn’t what I wanted. That’s because Photoshop actually has a separate command for
going back multiple steps. It’s called “step backward” – you can find this option under the
edit menu… it also has a corresponding keyboard shortcut, Alt-Ctrl-Z. This allows me to go
back more than one step in my history… Similarly, I can “step forward” to move forward
through the history.
Remember that I can also undo and redo simply by clicking on states in the history
palette.
In addition to undo, there’s also a way to perform a “partial undo,” which affects only
part of an image. Say, for example, that I liked the “find edges” special effect, except I didn’t
like what it did to the eyes of the duck. This is what the history brush is good for. I can
simply navigate to a point where I liked the way the eyes looked, select this state in the
history by clicking to the left of the state… move back into the present state, and then paint
from the past image into the present image…
Finally, if you’re stuck, you can always go to the help menu. By clicking on Photoshop
Help, you’re presented with several options. First, you can type in keywords on the right
(just like searching for pages with a search engine), and relevant help documents will be
presented to you. Second, you can also navigate through the tree of documents on the left,
which contain some of the more useful help pages.
That completes this introduction to Photoshop. We’ve barely scratched the surface of
what Photoshop can do, but hopefully this orientation has made it easier for you to find the
most important features.
Appendix B
219
B.5 SketchUp self-reporting training video transcript
Below is a transcript of the video we developed to train participants to report their own usability
issues with Google SketchUp.
Suppose that I was working on this model of a house with a curved roof. One serious issue
would be a crash that happens in SketchUp, which is something that could definitely
happen here, since we’re working with an unreleased version of SketchUp.
Suppose that I’m modeling this, and I want to build an extension to my house, so I use
the rectangle tool… and this error message pops up. It says, “Assertion failed: error code
40832. “ This would definitely be the kind of thing we would want you to report as an issue
– it’s a serious issue… but things don’t have to be that serious for you to report them.
Suppose that I decide that I want to orbit around my house – you learned about the
orbit tool in the video – and I pick what I think is the orbit tool in the toolbar, and I begin
trying to orbit, and crazy things start happening to my model… and I might immediately
realize that I had made a mistake – that I actually picked the wrong tool here – that I picked
the rotate tool rather than the orbit tool… and so, I just go and I undo. So that seems like a
nuisance problem, but we still want you to report it as an issue, even though it’s a relatively
minor issue.
It might also be true that I don’t realize right away what’s going on with that. It might
take me a few minutes to figure out that I had the wrong tool selected. And in that case I
might wonder, well, should I wait until I understand the cause of the issue in order to report
it? And the answer is no; we would rather that you report the issue right away – as soon as
you report it. You don’t have to know the cause of the problem to report it. You may never
understand the cause.
Issues don’t always have to do with actions that you perform – they may have to do
with interpreting messages that SketchUp provides you. So suppose that I start drawing a
Appendix B
220
line here, and SketchUp gives me this message, “On Blue Axis,” and I’ve forgotten what that
means. We would want you to report an issue in that case.
So, suppose now that I wanted to raise the roof to the house. I might initially have no
idea what tools to use in order to accomplish this. Is it the Move/Copy tool, is it the Push
Pull tool… what do I do? We would ask that you report an issue at this point, even though
it’s entirely going on in your head. There’s nothing happening in SketchUp at all. It’s just a
problem in planning that you’re experiencing at this stage.
So let’s say that I eventually decided to use the Push/Pull tool to try to raise the roof to
the house. So I click over here, and it says, “Cannot push/pull curved face.” So, clearly
SketchUp is not designed to perform the operation in the way that I thought it would. So I
might say, “Well, this is just my fault. I don’t know SketchUp well enough.” But we would
still want you to report an issue. It may be that if everyone has the same problem, then we
want to adjust the documentation to reflect that, or maybe even change the behavior of the
tool. So, in summary, if you’re in doubt about what to do, just go ahead and report an issue.
B.6 Photoshop self-reporting training video transcript
Below is a transcript of the video we developed to train participants to report their own usability
issues in Adobe Photoshop.
Let’s suppose that I’m editing this image containing salad making materials. Suppose I
wanted to sharpen this image – it looks a little blurry to me. So I go under the Filter menu,
select sharpen, and the program experiences an error. This is an example of a serious problem
that we would definitely want you to report.But problems don’t have to be that serious to
report. What if I was trying to select the cutting board on the left by lassoing it. I pick what I
think is the lasso tool… but in fact I accidentally selected the ellipse tool, which looks similar.
Now I might think this seems like a minor problem. I can just undo my errant selection and
Appendix B
221
find the right tool. But we would still want you to report this problem, even though it seems
like more of a nuisance than a serious problem.
I might also feel like this problem was my fault, not the system’s fault – so why should
I report it? But we still want you to report problems even when you feel like the blame is
with you. It may be that if a lot of people experience the same confusion, the interface or the
documentation could be revised to avoid the confusion – perhaps in this case by making the
icons look more different from each other.
Okay, now that I have the right tool, I’ll go ahead and make the lasso selection. Next I
want to move the cutting board. I try to move the item with the move tool, but I get the
following message: “Could not complete your request because the layer is locked.”
I might not understand this message at all, and therefore have no idea what I am doing
wrong. Should I wait until I understand the cause of the problem before reporting it? The
answer is no – we want you to go ahead and report problems like this right away. You may
never understand the cause of your problem.
Okay, so next suppose that I’m stumped here with this error message, and so I decide
to access the help materials. I decide that since the layer is apparently locked, I need to
unlock it. So I type in “unlock layer”… and am presented with six options. None of these
options seem relevant to my search, and this is frustrating. We would want you to report an
issue here. Even though all I’m doing here is looking through the help manual, we would still
want you to report your difficulty.
Okay, finally, let’s suppose that I wanted to take this image and extract the yellow
pepper from the right part of the image. Since the pepper seems to have a similar color to the
background, it looks like this could be difficult to accomplish. Which selection tools should
I use? We would like you to report this kind of planning difficulty as a problem as well, even
though the problem is happening entirely inside your head. So in summary, if you are in
doubt, please report an issue.
Appendix B
222
B.7 Usability problem merging procedure
For all three studies, a single researcher was responsible for merging usability problem
instances to form descriptions of unique usability problems. As discussed in Chapter 4,
merging two problems requires generalization, since no two problem instances are exactly
the same. Problem instances can differ along many dimensions: the level of granularity of the
problem, the immediate cause of the problem, the circumstances under which the problem
occurred, the consequences of the problem, etc. We adopted a conservative merging strategy,
merging problems only if their differences were superficial. To illustrate the merging process,
an example is included below from the Adobe Photoshop Study #2.
Usability problem instance #1
Usability problem instance #2
“A user was surprised when the Quick Selection tool didn’t
“A user was unaware of an existing selection
affect an already selected area. He had the whole image
when applying the Healing Brush. He had
selected, left over from changing the color cast. He
been working with a small area on the left side
zoomed in on the lower left tulip in order to change its
of the image and had left it selected when he
color, and then chose the Quick Selection tool. He asked,
zoomed in on the other side of the image to
'What the hell?' when nothing happened as a result of his
work there (so the selection marquee was not
clicking on the yellow area of the tulip a few times. The
showing on screen). He tried the healing brush
marching ants were only visible on the left side of the
but nothing happened. He realized the
window, and most of the window was obscured by the
problem, said 'oh I think it's because I have an
brush palette. He then realized his error, and deselected.”
active selection' and deselected and proceeded.”
Merged usability problem
“Several users were unaware that there was an active selection, while working on a zoomed part of their image;
this caused problems when users tried to perform subsequent operations (selecting something new in one
case, using the healing brush in another). Both users realized their mistakes, cleared the selection, and
continued.”
Appendix B
223
B.8 Photoshop Study 2: Moderator instructions
Below are the instructions we provided to the professional test moderator in the traditional
laboratory testing condition of the Adobe Photoshop experiment described in Chapter 6.
For advice on how to interact with participants, we will be following the guidelines
described in Dumas and Loring, 2008 [33]. Some of their more important recommendations are summarized below.
Keeping participants talking
Prompting as a reminder
When participants are working but not talking, it may be time for a reminder. There is no
general rule about how long to wait before prompting because it depends on the participant
and the situation. Use simple, gentle reminders:
So....? So, you're thinking....? What are you seeing here? Tell me what is happening.
Prompting the silent ones
Occasionally, test participants are just very quiet, for whatever reason, and no amount of
general prompting will make them think aloud. In that case, you need to watch their actions
more carefully and prompt them with specific questions in order to understand what they
are thinking and trying to do.
If you have tried everything, and the participant still remains silent, it may also be
useful to try talking out loud for them (e.g., "I see you just clicked on the 'next' button here.")
Be sure to only say things that the participant must know (e.g., avoid saying things like, "I see
you clicked on the link that takes you to the next page").
Appendix B
224
When and how to probe
A probe is an intervention by a moderator, asking participants for additional information or
clarification.
When to probe
Probe with caution; if you feel like you might be interrupting, consider asking your question
during the retrospective session at the end.
Here are some reasons that you might decide to probe:
•
to be clear about what participants are thinking
•
to find out if participants understand a concept or term
•
to understand why participants chose one option or one path over another.
•
to know if an action or outcome was expected or not.
•
to ask participants about nonverbal actions (e.g., a squint), or sounds (e.g., a sigh).
•
to find out if participants saw an option, button, link, etc.
How to probe
Instead of asking a question, use 'curious commands': imperative statements that sound
neither like a question nor a command. The goal here is to avoid making the participant feel
defensive. Examples include:
Tell me a little more about ...
Describe a bit more about ...
Share some more about...
Talk some more about... Help me to understand a little about...
Providing encouragement
Do not provide encouragement to participants unless they have become so frustrated or
confused that they have lost their motivation to continue. In this case, you might try a
neutral statement such as one of the following:
Appendix B
225
You're really helping us... You're giving us the kinds of information we need to make this
product better...
Your thinking aloud is very clear and helpful...
Don't forget you're
helping future users by working with me today.
Dealing with failure
Do not commiserate with participants who are struggling. When participants fail,
acknowledge that you heard and understood the comment, and say, "OK" or "Mm hmm."
Do not reinforce participants' negative feelings about the product. Remain neutral.
Providing assistance
You may decide to assist a participant, in order to move past a step in a task so that later
problems might be uncovered. Providing assistance requires balancing two factors: helping
participants along, while avoiding giving information that will help them complete later
tasks. If you provide assistance, you may also lose information about the severity of the
difficulty being encountered. Here are some situations that might call for an assist:
•
The participant has tried several alternatives and asks for help.
•
The participant is approaching the task time limit or is taking so long that he or she
won't have time for later parts of the task.
•
The participant thinks the task is complete when it's not (or vice versa).
There are several levels of hints you might consider. You should move through these levels in
sequence, from providing as little information as possible to telling the participant exactly
how to complete a task.
•
Level 1: Breaking a repeating sequence. When a participant continually repeats the
same or similar sequence several times, all it takes sometimes is a change in concentration to get them unstuck. A simple "So, what do you think is going on here?" or
"Try reading the task again" is often enough to return their focus to the goal.
Appendix B
•
226
Level 2: Providing a general hint. Often participants come close to finding the
option they need. For example, they may have opened the correct menu but not read
far enough down the list of options. You could provide a level 2 assist by saying,
"Remember how you started this task? You were getting close."
•
Level 3: Providing a specific hint. When a level 2 assist does not move a participant
along, you may have to be more specific. For example, you could say, "The option is
in the Edit menu" or "Try all of the options in the list."
•
Level 4: Telling participants how to do the next step. In some situations, you may
decide to tell participants how to perform the next step. For example, "Open the
Edit menu and select Preferences" or "Click the third bullet."
B.9 Photoshop Study 2: Evaluator instructions
Identifying usability problems
One of the things that makes usability evaluation subjective is the process of identifying
usability problems. In determining whether an interaction episode constitutes a usability
problem, we want you to be inclusive in your definition. Two resources are provided to assist
you in identifying problems:
A usability problem is indicated by any of 8 criteria [excerpted from Jacobsen et al. 1998]:
(1) the user articulates a goal and cannot succeed in attaining it within three minutes.
(2) the user explicitly gives up.
(3) the user articulates a goal and has to try three or more actions to find a solution.
(4) the user produces a result different from the task given.
(5) the user expresses surprise.
(6) the user expresses some negative affect or says something is a problem.
(7) the user makes a design suggestion.
(8) a system crash.
Appendix B
227
Skov and Stage (2005) provide a table of usability problems classified along two dimensions:
1) (horizontal) how the problem might be detected, and 2) (vertical) the impact of the
problem on the user:
Notes
A user does not need to consciously admit to a problem for you to report it. There may even
be cases where a user may explicitly classify a troublesome interaction is "part of normal use"
- but this is for you to decide. If you decide to report a problem, please do make it clear what
the user said about it.
For a small handful of backtracking episodes, there will be a corresponding "selfreported issue" episode. (This is indicated in parentheses next to the episode number in your
Appendix B
228
checklist.) This means that a participant self-reported a usability issue within 10 seconds of
the undo operation, and provided separate commentary on this issue. You will find this
commentary in the "overlapping_self_reports" subdirectory within the participant's folder.
When this happens, you are welcome to use the commentary from the self-reported issue
episode to help you extract usability problems from the undo episode. If you identify a
problem using the self-reported issue retrospective, do make sure that the evidence of the
problem is visible in both episodes.
In the backtracking episodes, please report all problems you can detect in the original
short episode (e.g. 0123-5_episode_001_Undo.mp4). This may include problems unrelated
to the undo event(s) in the episode. (We call these 'incidental' problems.) Do not report
problems that you found only in the longer "context" videos. These videos are intended only
to help you to understand the context of the problems that occurred during the original
(shorter) episode.
Reporting usability problem instances
We want you to report each individual instance of a usability problem (even within a single
participant); you do not need to worry about generalizing across multiple instances; this will
be done by other evaluator(s) at a later time. We will be using a semi-structured process for
reporting usability problem instances, described below.
Three golden rules for describing problem instances
1. Focus on describing symptoms rather than inferring causes.
2. Avoid trying to read users' minds when describing their intentions or thoughts; rely
on evidence.
3. Clearly distinguish between the user's actions and explanations.
Problem instance reporting form
You will be reporting your problem instances using a template [shown below]:
Appendix B
229
Appendix B
230
Appendix B
231
When you press the "submit" button in this form, your responses on the above form
will automatically be added to a Google spreadsheet. (You are welcome to edit the
spreadsheet directly, instead of filling out the form each time.)
If you find more than one instance of exactly the same problem (either across users, or
within a particular user), you may refer to a previous problem description to save time in
writing. However, please do this sparingly! Two problem instances may appear to be the
same, but may differ in subtle ways! (For example, they may have very different consequences to the user.)
Appendix B
232
C
Instrumentation Code
This appendix contains sample code illustrating how we instrumented both of our test
applications, Google SketchUp and Photoshop, to detect backtracking events.
C.1 Detecting backtracking events in Google SketchUp
We instrumented Google SketchUp by creating a Ruby plug-in that attaches “observers” for
undo and erase events. Detecting undo events was simple; we just attached a “model
observer” to our active model, and then overrode the “onTransactionUndo” method of the
Sketchup::ModelObserver class. Detecting erase events was more complex, since SketchUp
does not have a simple callback function that executes when a user erases some geometry in
SketchUp. We are able to infer erase events when observers indicate the removal of some
geometry, and that ‘erase’ is the currently selected tool. (Some other tools besides erase also
remove geometry as part of their operation, requiring us to know that erase is the current
tool.)
The simplified example code below is meant for illustration purposes only; the full
instrumentation code is considerably more complex. In particular, note that some erase
commands would result in the erasure of more than one element, and the code below would
233
Appendix C
234
interpret each element’s removal as a separate command. Moreover, there are other ways to
execute an erase command without explicitly using the erase tool from the toolbar (e.g.,
hitting the delete key, with an element of geometry selected). We account for such subtleties
in the full version of the code.
The example code below has been tested with SketchUp version 7.0.8657. It may
not work with other versions of the software.
require 'sketchup.rb'
class
def
#
#
end
end
MyModelObserver < Sketchup::ModelObserver
onTransactionUndo(model)
UNDO EVENT DETECTED
Log the event to a file, with timestamp
class MyToolsObserver < Sketchup::ToolsObserver
@@current_tool_name = nil
def MyToolsObserver.getCurrentToolName
return @@current_tool_name
end
def onActiveToolChanged (tools, toolname, toolid)
# Keep track of the current active tool
@@current_tool_name = toolname
end
end
class MyEntitiesObserver < Sketchup::EntitiesObserver
def onElementRemoved (entities, entity)
if MyToolsObserver.getCurrentToolName == "EraseTool"
# ERASE EVENT DETECTED
# Log the erase event, with timestamp
end
end
end
class MyAppObserver < Sketchup::AppObserver
def onOpenModel (model)
# Add observers to the new model.
SLogger.addObserversToModel()
end
def onNewModel (model)
Appendix C
235
# Add observers to the new model.
SLogger.addObserversToModel()
end
end
class SLogger
@@current_active_model = nil
def SLogger.getActiveModel
return @@current_active_model
end
def SLogger.addObserversToModel
@@current_active_model = Sketchup.active_model
@@tool_observer = MyToolsObserver.new
Sketchup.active_model.tools.add_observer(@@tool_observer)
@@entities_observer = MyEntitiesObserver.new
Sketchup.active_model.entities.add_observer(@@entities_observer)
@@model_observer = MyModelObserver.new
Sketchup.active_model.add_observer(@@model_observer)
end
end
app_observer = MyAppObserver.new
Sketchup.add_observer (app_observer)
SLogger.addObserversToModel
C.2 Detecting backtracking events in Adobe Photoshop
We instrumented Photoshop using its built-in “history log” function available from the
preferences menu. The history log records a list of commands executed by the user, storing
them in a user-specified text file. It is important to enable the history log in the
“EditPreferencesGeneral…” dialog box, and set the “Edit Log Items” to “Detailed”.
The resulting file will contain a list of commands executed, but it does not contain
any timestamp information. We wrote a Ruby program to monitor the Photoshop history
log text file, detecting when each line is added to the file. When a backtracking command is
added to the file, we attach a timestamp and output a line to a second log file. With
Appendix C
236
timestamps added, this file is now ready for input to the backtracking analysis retrospective
player software.
Ruby source code illustrating how to monitor the history log file is provided below.
This code has been tested with Adobe Photoshop CS3. It may or may not work with other
versions of Photoshop. Note that you will need to install the file/tail package for Ruby in
order to make use of this code.
require 'file/tail'
inputFilename = ARGV[0]
File.open(inputFilename) do |log|
log.extend(File::Tail)
log.interval = 1
log.max_interval = 1
log.backward(0)
log.tail { |line|
line.strip!.chomp!
puts line
$stdout.flush()
if line == 'Eraser'
# ERASE EVENT DETECTED
# (Erase events turned out to be rare for our tasks, but
# we can capture them.)
# Save event to file, with timestamp
else
if line == 'Undo' or
line == 'Select previous history state' or
line =~ /Select history state -/ or
line == 'Fade' or
line == 'History Brush'
# UNDO EVENT DETECTED
# Save event to file, with timestamp
end
end
}
end
D
Statistical Methods
For a usability test with N participants, we describe a statistical procedure to estimate the
number of problems that smaller groups would have found, on average. The derivation on
the following page produces a closed-form solution for the answer, avoiding the computationally-intensive Monte Carlo simulation technique sometimes used in the literature (e.g.,
[66]).
237
Appendix D
Let
Let
238
be the total number of usability problems discovered.
be the frequency of problem (number of people who experienced the problem at least once).
Let
be the number of participants in the study.
Let
be the number of participants we want to simulate (must be less than or equal to N).
Let
be a 0-1 random variable (1 if problem was found by
Let
participants, 0 otherwise).
be a random variable, the number of problems that are found by
We want to find
, the expected number of problems found by
participants (
participants.
)
Bibliography
1.
Adobe Photoshop CS3. Adobe, Inc.
2.
Google Sketchup, Version 7 (pre-release). Google, Inc.
3.
Google SketchUp New User Videos. http://www.youtube.com/user/SketchUpVideo.
4.
Morae. TechSmith, Inc.
5.
Amazon Mechanical Turk. https://www.mturk.com/mturk/welcome.
6.
Google SketchUp product information. 2009.
http://sketchup.google.com/product/gsu.html.
7.
Abowd, G.D. and Dix, A.J. Giving undo attention. Interacting with Computers 4, 3 (1992),
317-342.
8.
Akers, D., Simpson, M., Jeffries, R., and Winograd, T. Undo and erase events as indicators
of usability problems. Proc. CHI 2009, ACM Press (2009), 659-668.
9.
Allison, P.D. and Liker, J.K. Analyzing sequential categorical data on dyadic interaction: A
comment on Gottman. Psychological Bulletin 91, 2 (1982), 393–403.
10.
Andre, T.S., Hartson, H.R., Belz, S.M., and McCreary, F.A. The user action framework: a
reliable foundation for usability engineering support tools. Int. Journal of HumanComputer Studies 54, 1 (2001), 107-136.
11.
Andreasen, M.S., Nielsen, H.V., Schrøder, S.O., and Stage, J. What happened to remote
usability testing?: an empirical study of three methods. Proceedings of the SIGCHI
conference on Human factors in computing systems, ACM (2007), 1405-1414.
12.
Andreassi, J.L. Psychophysiology: Human behavior and physiological response. Lawrence
Erlbaum Assoc Inc, 2006.
13.
Archer, J.E., Jr, Conway, R., Schneider, F.B., and B, F. User Recovery and Reversal in
Interactive Systems. ACM Transactions on Programming Languages and Systems 6, 1
(1984), 1-19.
14.
Badre, A.N. and Santos, P. A knowledge-based system for capturing human-computer
interaction events. Georgia Institute of Technology, 1995.
15.
Berlage, T. A selective undo mechanism for graphical user interfaces based on command
objects. ACM Transactions on Computer-Human Interaction 1, (1994), 269-294.
239
Bibliography
240
16.
Bias, R. Interface-Walkthroughs: efficient collaborative testing. IEEE Software 8, 5 (1991),
94-95.
17.
Bias, R.G. and Mayhew, D.J. Cost-justifying usability. Morgan Kaufmann Publishers, 1994.
18.
Boren, T. and Ramey, J. Thinking aloud: Reconciling theory and practice. IEEE
Transactions on Professional Communication 43, 3 (2000), 261-278.
19.
Bowers, V.A. and Snyder, H.L. Concurrent versus retrospective verbal protocol for
comparing window usability. Human Factors and Ergonomics Society Annual Meeting
Proceedings 34, (1990), 1270-1274.
20.
Bruun, A., Gull, P., Hofmeister, L., and Stage, J. Let your users do the testing: a
comparison of three remote asynchronous usability testing methods. Proc. CHI 2009,
ACM Press (2009), 1619-1628.
21.
Bub, B., Milgram, G., Rubin, M., and Reinitz, J. What is Chevrutah?
http://www.reclaimingjudaism.org/torah/hevruta.htm.
22.
Burr, B. VACA: a tool for qualitative video analysis. CHI '06 extended abstracts on Human
factors in computing systems, ACM (2006), 622-627.
23.
Capra, M. Contemporaneous Versus Retrospective User-Reported Critical Incidents in
Usability Evaluation. Proceedings of the Human Factors and Ergonomics Society, (2002),
1973-1977.
24.
Card, S.K., Moran, T.P., and Newell, A. The psychology of human-computer interaction.
Erlbaum, 1983.
25.
Castillo, J.C. The user-reported critical incident method for remote usability evaluation
(Masters Thesis). 1997. http://research.cs.vt.edu/usability/publications/castillo-remoteusability.pdf.
26.
Cermak, G.W. Short-term recognition memory for complex free-form figures.
Psychonomic Science 5, 4 (1971), 209–211.
27.
Cooper, A., Reimann, R., and Cronin, D. About Face 3: The essentials of interaction design.
Wiley, 2007.
28.
Cronbach, L.J. Coefficient alpha and the internal structure of tests. Psychometrika 16, 3
(1951), 297-334.
29.
Cuomo, D.L. Understanding the applicability of sequential data analysis techniques for
analysing usability data. Behaviour & Information Technology 13, 1 (1994), 171-182.
30.
Darley, J.M. and Gross, P.H. A hypothesis-confirming bias in labeling effects. Journal of
Personality and Social Psychology 44, 1 (1983), 20-33.
Bibliography
241
31.
David M. Nichols, D.M. Participatory Usability: supporting proactive users. Proceedings of
the 4th Annual Conference of the ACM Special Interest Group on Computer Human
Interaction - New Zealand Chapter (CHINZ'03), ACM SIGCHI New Zealand (2003), 6368.
32.
Dix, A., Mancini, R., and Levialdi, S. Alas I am Undone - Reducing the Risk of Interaction?
. Proc. of HCI 1996, (1996), 51-56.
33.
Dumas, J.S. and Loring, B.A. Moderating usability tests: principles and practice for interacting.
Morgan Kaufmann, 2008.
34.
Dumas, J.S. and Redish, J. A Practical Guide to Usability Testing. Intellect Books, 1999.
35.
Edwards, W.K., Igarashi, T., LaMarca, A., and Mynatt, E.D. A temporal model for multilevel undo and redo. Proceedings of UIST 2000, (2000), 31-40.
36.
Ericsson, A. and Simon, H. Protocol Analysis: Verbal Reports as Data. MIT Press, 1984.
37.
Faraone, S.V. and Dorfman, D.D. Lag sequential analysis: Robust statistical methods.
Psychological bulletin. 101, 2 (1987), 312–323.
38.
Faulkner, A. and Walthers von Alten, J. Classroom in a Book: Adobe Photoshop CS3. Adobe
Press, 2007.
39.
Fisher, C. Protocol analyst’s workbench: design and evaluation of computer-aided
protocol analysis (unpublished PhD thesis). 1991.
40.
Flanagan, J. The Critical Incident Technique. Psychological Review 54, 4 (1954), 327-358.
41.
del Galdo, E., Williges, B., and Wixon, D. An evaluation of critical incidents for software
documentation design. Proceedings of the Human Factors Society, (1986), 19-23.
42.
Gottman, J.M. and Roy, A.K. Sequential analysis: A guide for behavioral researchers.
Cambridge Univ Pr, 1990.
43.
Guan, Z., Lee, S., Cuddihy, E., and Ramey, J. The validity of the stimulated retrospective
think-aloud method as measured by eye tracking. Proceedings of the SIGCHI conference on
Human Factors in computing systems, ACM (2006), 1253-1262.
44.
Hackman, G.S. and Biers, D.W. Team usability testing: Are two heads better than one?
Proceedings of Human Factors, (1992), 1205–1209.
45.
Hammontree, M.L., Hendrickson, J.J., and Hensley, B.W. Integrated data capture and
analysis tools for research and testing on graphical user interfaces. Proceedings of the
SIGCHI conference on Human factors in computing systems, ACM (1992), 431-432.
Bibliography
242
46.
Hartmann, B., Klemmer, S.R., Bernstein, M., et al. Reflective physical prototyping through
integrated design, test, and analysis. Proceedings of the 19th annual ACM symposium on User
interface software and technology, ACM (2006), 299-308.
47.
Hartson, H.R. Personal communication, Re: User Action Framework, 9/11/2008. .
48.
Hartson, H.R. and Castillo, J.C. Remote Evaluation for Post-Deployment Usability
Improvement. Proc. AVI 1998, ACM Press (1998), 22-29.
49.
Hartson, H.R., Castillo, J.C., Kelso, J., and Neale, W.C. Remote evaluation: the network as
an extension of the usability laboratory. Proc. CHI 1996, ACM Press (1996), 228-235.
50.
Heer, J., Mackinlay, J., Stolte, C., and Agrawala, M. Graphical Histories for Visualization:
Supporting Analysis, Communication, and Evaluation. Proceedings of Information
Visualization 2008, (2008), 1189-1196.
51.
Hilbert, D.M. and Redmiles, D.F. An approach to large-scale collection of application
usage data over the Internet. Proceedings of the 20th international conference on Software
engineering, IEEE Computer Society (1998), 136-145.
52.
Hilbert, D.M. and Redmiles, D.F. Extracting usability information from user interface
events. ACM Comput. Surv. 32, 4 (2000), 384-421.
53.
Hornbæk, K. and Frøkjær, E. Comparison of techniques for matching of usability
problem descriptions. Interacting with Computers 20, 6 (2008), 505-514.
54.
Howarth, J., Andre, T.S., and Hartson, R. A Structured Process for Transforming
Usability Data into Usability Information. Journal of Usability Studies 3, 1 (2007), 7-23.
55.
Hvannberg, E.T. and Law, E.L.C. Classification of usability problems (CUP) scheme.
Proceedings of INTERACT 2003, ACM Press (2003), 655-662.
56.
Ivory, M.Y. and Hearst, M.A. The state of the art in automating usability evaluation of
user interfaces. ACM Comput. Surv. 33, 4 (2001), 470-516.
57.
Jacobsen, N.E., Hertzum, M., and John, B.E. The evaluator effect in usability tests. Proc.
CHI 1998, ACM Press (1998), 255-256.
58.
John, B.E. and Marks, S.J. Tracking the effectiveness of usability evaluation methods.
Behaviour & Information Technology 16, 4 (1997), 188–202.
59.
John, B.E., Prevas, K., Salvucci, D.D., and Koedinger, K. Predictive human performance
modeling made easy. Proceedings of the SIGCHI conference on Human factors in computing
systems, (2004), 455–462.
60.
Kapoor, A., Burleson, W., and Picard, R.W. Automatic prediction of frustration.
International Journal of Human-Computer Studies 65, 8 (2007), 724-736.
Bibliography
243
61.
Kasik, D.J. and George, H.G. Toward automatic generation of novice user test scripts.
Proceedings of the SIGCHI conference on Human factors in computing systems: common
ground, (1996), 244–251.
62.
Kawasaki, Y. and Igarashi, T. Regional undo for spreadsheets. Part of the demo presentations
at the Symposium on User Interface Software and Technology, (2004).
63.
Klemmer, S.R., Thomsen, M., Phelps-Goodman, E., Lee, R., and Landay, J.A. Where do
web sites come from?: capturing and interacting with design history. Proceedings of the
SIGCHI conference on Human factors in computing systems: Changing our world, changing
ourselves, ACM (2002), 1-8.
64.
Koenemann-Belliveau, J., Carroll, J.M., Rosson, M.B., and Singley, M.K. Comparative
usability evaluation: critical incidents and critical threads. Proceedings of the SIGCHI
conference on Human factors in computing systems: celebrating interdependence, ACM (1994),
245-251.
65.
Kohavi, R., Henne, R.M., and Sommerfield, D. Practical guide to controlled experiments
on the web: listen to your customers not to the hippo. Proceedings of the 13th ACM
SIGKDD international conference on Knowledge discovery and data mining, ACM Press
(2007), 959 - 967.
66.
Law, E.L. and Hvannberg, E.T. Analysis of combinatorial user effect in international
usability tests. Proceedings of the SIGCHI conference on Human factors in computing systems,
ACM (2004), 9-16.
67.
Leszak, M., Perry, D.E., and Stoll, D. Classification and evaluation of defects in a project
retrospective. The Journal of Systems & Software 61, 3 (2002), 173–187.
68.
Lewis, C.H. and Norman, Donald A. Designing for Error. In D.A. Norman and S.W.
Draper, eds., User Centered System Design. Lawrence Erlbaum Associates, 1986, 411-432.
69.
Lewis, J.R. Sample sizes for usability studies: Additional considerations. Human Factors 36,
2 (1994), 368–378.
70.
Li, R. and Li, D. A regional undo mechanism for text editing. The 5th International
Workshop on Collaborative Editing Systems, (2003).
71.
Mackay, W.E. EVA: an experimental video annotator for symbolic analysis of video data.
SIGCHI Bull. 21, 2 (1989), 68-71.
72.
Mantei, M.M. and Teorey, T.J. Cost/benefit analysis for incorporating human factors in
the software lifecycle. Commun. ACM 31, 4 (1988), 428-439.
Bibliography
244
73.
Matejka, J., Li, W., Grossman, T., and Fitzmaurice, G. CommunityCommands:
Command Recommendations for Software Applications. To Appear in Proc. UIST 2009,
(2009).
74.
Medlock, M., Wixon, D., Terrano, M., Romero, R., and Fulton, B. Using the RITE
method to improve products: a definition and a case study. Proceedings of the Usability
Professionals Association Conference, (2002).
75.
Mentis, H. and Gay, G. Using TouchPad pressure to detect negative affect. Multimodal
Interfaces, 2002. Proceedings. Fourth IEEE International Conference on, (2002), 406-410.
76.
Miller, J.R. and Jeffries, R. Interface-usability evaluation: science of trade-offs. IEEE
Software 9, 5 (1992), 97–98.
77.
Molich, R. and Dumas, J.S. Comparative usability evaluation (CUE-4). Behaviour &
Information Technology 27, 3 (2008), 263-281.
78.
Myers, B.A. Why are Human-Computer Interfaces Difficult to Design and Implement?
Carnegie Mellon University Technical Report, CS-93-183, 1993.
79.
Myers, B.A. and Kosbie, D.S. Reusable hierarchical command objects. Proceedings of the
SIGCHI conference on Human factors in computing systems: common ground, ACM (1996),
260-267.
80.
Nagappan, N., Williams, L., Ferzli, M., et al. Improving the CS1 experience with pair
programming. Proceedings of the 34th SIGCSE technical symposium on Computer science
education, ACM New York, NY, USA (2003), 359-362.
81.
Nichols, D.M. and Twidale, M.B. The Usability of Open Source Software. First Monday
8, 1 (2003).
82.
Nielsen, J. Usability engineering. Academic Press, 1993.
83.
Nielsen, J. and Landauer, T.K. A mathematical model of the finding of usability problems.
Proc. CHI/INTERACT 1993, ACM Press (1993), 206-213.
84.
Nielsen, J. and Molich, R. Heuristic evaluation of user interfaces. Proceedings of the
SIGCHI conference on Human factors in computing systems: Empowering people, ACM
(1990), 249-256.
85.
Nisbett, R.E. and Wilson, T. D. Telling more than we can know: Verbal reports on mental
processes. Psychological review 84, (1977), 231-259.
86.
Norman, D.A. Cognitive Engineering. In Norman, Donald A. and S.W. Draper, eds., User
Centered System Design. Lawrence Erlbaum Associates, 1986, 31-61.
Bibliography
245
87.
O'Donnell, A.M. and O'Kelly, J. Learning from peers: Beyond the rhetoric of positive
results. Educational Psychology Review (Historical Archive) 6, 4 (1994), 321–349.
88.
O'Malley, C.E., Draper, S.W., and Riley, M.S. Constructive interaction: A method for
studying human-computer-human interaction. Proceedings of IFIP Interact, (1984), 269274.
89.
Otto, H. UNDO, an aid for explorative learning? Journal of Computer Science and
Technology 7, 3 (1992), 226-236.
90.
Rauterberg, M. From novice to expert decision behaviour: a qualitative modelling
approach with Petri nets. Advances in human factors ergonomics 20, (1995), 449–449.
91.
Reason, J. Human error. Cambridge University Press, 1990.
92.
Robertson, G., Card, S.K., and Mackinlay, J.D. The cognitive coprocessor architecture for
interactive user interfaces. Proceedings of the 2nd annual ACM SIGGRAPH symposium on
User interface software and technology, ACM (1989), 10-18.
93.
Rubin, J. and Chisnell, D. Handbook of Usability Testing. Wiley, 2008.
94.
Russell, D. and Grimes, C. Assigned tasks are not the same as self-chosen Web search
tasks. System Sciences, 2007. HICSS 2007. 40th Annual Hawaii International Conference on,
(2007), 83-90.
95.
Sackett, G.P. Observing Behavior, Vol. II: Data Collection and Analysis Methods. University
Park Press, Baltimore London Tokyo, 1978.
96.
Salvucci, D.D. and Lee, F.J. Simple cognitive modeling in a complex cognitive
architecture. Proceedings of the SIGCHI conference on Human factors in computing systems,
ACM (2003), 265-272.
97.
Sanderson, P.M. and Fisher, C. Exploratory sequential data analysis: Foundations. HumanComputer Interaction 9, 3 (1994), 251-317.
98.
Scheirer, J., Fernandez, R., Klein, J., and Picard, R.W. Frustrating the user on purpose: a
step toward building an affective computer. Interacting with computers 14, 2 (2002), 93118.
99.
Shneiderman, B. The future of interactive systems and the emergence of direct
manipulation. Behaviour & Information Technology 1, 3 (1982), 237–256.
100. Siochi, A.C. and Ehrich, R.W. Computer analysis of user interfaces based on repetition in
transcripts of user sessions. ACM Trans. Inf. Syst. 9, 4 (1991), 309-335.
101. Skov, M.B. and Stage, J. Supporting problem identification in usability evaluations. Proc.
CHI Australia 2005, ACM Press (2005), 1-9.
Bibliography
246
102. Spool, J. and Schroeder, W. Testing web sites: five users is nowhere near enough. CHI '01
extended abstracts on Human factors in computing systems, ACM (2001), 285-286.
103. Terry, M., Kay, M., Van Vugt, B., Slack, B., and Park, T. Ingimp: Introducing
instrumentation to an end-user open source application. Proceedings of SIGCHI 2008,
ACM Press (2008), 607-616.
104. Terry, M. and Mynatt, E.D. Recognizing creative needs in user interface design.
Proceedings of the 4th conference on Creativity and cognition, ACM (2002), 38-44.
105. Thompson, C. Halo 3: How Microsoft Labs invented a new science of play. Wired 15, 9
(2007).
106. Tullis, T. and Albert, B. Measuring The User Experience: collecting, analyzing, and presenting
usability metrics. Morgan Kaufmann, 2008.
107. Virzi, R.A. Refining the test phase of usability evaluation: how many subjects is enough?
Hum. Factors 34, 4 (1992), 457-468.
108. Vitter, J.S. US&R: A new framework for redoing. SIGPLAN Not. 19, 5 (1984), 168-176.
109. Von Ahn, L. and Dabbish, L. Labeling images with a computer game. Proceedings of the
SIGCHI conference on Human factors in computing systems, (2004), 319–326.
110. Ward, R.D. and Marsden, P.H. Physiological responses to different WEB page designs.
International Journal of Human-Computer Studies 59, 1-2 (2003), 199-212.
111. Wharton, C., Bradford, J., Jeffries, R., and Franzke, M. Applying cognitive walkthroughs to
more complex user interfaces: experiences, issues, and recommendations. Proceedings of the
SIGCHI conference on Human factors in computing systems, ACM (1992), 381-388.
112. Williams, L. and Kessler, R. Pair Programming Illuminated. Addison-Wesley Professional,
2002.
113. Winograd, T. and Flores, F., eds. Understanding computers and cognition. Ablex Publishing
Corp., 1985.
114. Wixon, D. Evaluating usability methods: why the current literature fails the practitioner.
interactions 10, 4 (2003), 28-34.
115. Wright, P. and Monk, A.F. Evaluation for design. People and Computers V: Proceedings of
the Fifth Conference of the British Computer Society Human-Computer Interaction Specialist
Group, University of Nottingham, 5-8 September 1989, Cambridge University Press (1989),
345-358.