1
Brain Voyager 2.4: Abridged Protocol Belyk November 2012 I. Before Analysis A. Organize A.1 Prepare a word file for analysis notes A.2 Create folders • Project à Subject à Scan number & name (SS_scan/task_note) • NOTE: When it comes time to the random effects analysis, the .vtc file has start with a subject number (e.g., P1, P2). Hence, if you don’t name you files along the way with a subject number, then you need to add it to the .vtc file before running the random effects analysis. A.3 Create subfolders for DICOM files for each task A.4 Pick a name you like. Renaming folders later on will throw everything off. A.5 Rename Dicom Files to BV format (do this for every scan) • FileàRename Dicom FilesàBrowse B. Create Stimulation Protocol (PRT file) B.1 Analysis à Stimulation Protocol B.2 Add conditions B.3 Change labels and colours of conditions • Select condition and click on Edit Name or Edit Color • Note: must click on condition before changing colour or label, otherwise BV will crash B.4 Ensure NrofTimePoints = Total number of volumes for the scan B.5 Select epochs for each condition • Make sure condition is selected • Then press Show Plot • Expand Time Course Plot window as much as possible B.6 Ensure Time Course Segment Size = block length (measured in TR’s) B.7 Assign conditions to blocks • Select a condition • click on appropriate segments of the plot • Press Add to PRT • Repeat for each condition B.7 Save .PRT Note1: Advanced users may prefer the alternate interface under Interval >>. This method allows the user to specify epochs numerically rather than visually. Also useful for correcting errors. Note2: If multiple scans appear in each scan (in different orders), it is necessary to create a separate .prt for each scan AND in conditions should be listed in the same order for each .prt. 2 Brain Voyager 2.4: Abridged Protocol Belyk November 2012 II. Anatomical Processing 1. Create .VMR File 1.1 Click on “Project Wizard” from Menu bar 1.2 Select VMR project 1.3 Select DICOM format 1.4 Name in Subject_Run format 1.5 Select Yes to the question about renaming the DICOM files 1.6 Click on file in “Project Source Files” window and click OK. If not, it will not work. 1.6 Ensure parameters are correct. Clock OK to close Contrasts and Brightness window. 1.7 Select Yes to transforming to iso-‐voxel data 1.8 Select Yes to transforming to BV’s standard sagittal orientation 1.10 Correct orientation of slices (If problems occur with 1.7 or 1.8) • 3D volume tools à Spatial Transformation tab • Press Iso-‐Voxel and click OK Save using default name • 3D volume tools à Spatial Transformation tab • Press To Sag and click Yes Save using default name • The 3 slices show now be in the correct orientation 1.11 If necessary, adjust contrast and brightness until background is black • Options à Contrast and Brightness OR • Volumes à V16 tools à Load .V16 (if contrast was set during prior analysis) 1.12 Keep the ISO_SAG.vmr open for next step 2 Anatomical Preprocessing (QX2.4 or later) This step is generally optional, but will help with coregistration and automatic Talairaching. If the VMR will eventually be used to create a mesh, it’s worth doing this carefully. 2.1 Brightness contrast (ballpark it) • Volumes àBrightness & Contrast 2.3 Manually correct white matter • 3D toolsàsegmentation tab→ min = 140, max = 170 à grow region (cursor in WM) • Adjust min/max to capture less/more intense voxels à Smooth (should capture most WM) • If necessary manually draw to capture additional voxels (time consuming!). 2.4 Intensity InHomogeneity Correction (IIHC) • VolumesàInhomogeneity Correction, V16 tools →check mask creationà Correct IIH 2.5 Save it File→ Save Secondary VMR à (as IIHC.vmr) File→ Save As… à (as anatomical…_IIHC.vmr) 2.6 Peel off Skull and Dura • VolumesàSegregate Brain from Head (wait…) • Save As… à(as anatomical…_peeled) 3 Brain Voyager 2.4: Abridged Protocol Belyk November 2012 2. Spatial Normalization 2.1 If not already open, open the ISO_SAG.vmr 2.2 3D Volume Tools à Talairach tab àcheck Manualà 1. Find AC Point • Navigate the cursor to the anterior commissure and hit OK HINT: Find the AC before hitting the Find AC Point button Use axial & sagittal views “Control A” toggles the crosshair on/off Make sure this point is indeed in the midsagittal plane and not off to one side. Anterior Commissure shown in red 2.3 2. Find AC-‐PC Plane • Rotate the brain in 3 dimensions so that both the Anterior & Posterior commissure are visible. • The lower row is the modified image. The upper row is the original image. • Make sure to align rotations in all three planes (x, y, and z) i)
Z: look at axial view. Rotate until vertical line passes between hemispheres. ii)
Y: look at coronal view. Rotate until vertical line passes between hemispheres. iii)
X: look at saggital view. Rotate until posterior commissure is visible. • hit OK 4 Brain Voyager 2.4: Abridged Protocol Belyk November 2012 Posterior Commissure shown in blue 2.4 3. Transform and then GO [saves ACPC.trf] Use default settings (cubic spline interpolation) 2.5 Set the 8 “Talairach proportional grid reference points” Actually, the manual says that finding the AC point again is unnecessary. Start with the PC. One at a time, click on each of PC, AP, PP, SP, IP, RP, and LP Once you’ve found the relevant point, click Set Point Bringing the cross-‐hair on and off by toggling Control A to is very useful at this step. Note that pressing the SHIFT key makes the arrows work in the anteroposterior directions. Be vigilant about getting the extreme points of each range. 2.6 Click on Save .TAL and Save [this creates the ACPC.tal] 2.7 Click on ACPC à TAL and GO [this creates the _TAL.vmr] Use default of Trilinear interpolation 2.8 Close all windows 2B. Semi-‐Automatic Spatial Normalization (QX2.4 or later) Warning: this algorithm gives fairly mediocre results. It needs to be supervised and corrected manually. Best results if Anatomical pre-‐processing has been applied (Section1B). 2B.1 Detect Midsaggital plane, then corpus collosum and finally Anterior and Posterior Commisures. • Volumes→3D Volumes tool→ Talairach→Detect MSP, AC, PC 2B.2 Uses contrast between grey matter and background intensity to detect bonding box. • Volumes→3D Volumes tool→ Talairach→Auto-‐Detect 2B.23 Alternatively use the fully automatic method Automatic method: Combines 2B.1 and 2B.2 • Volumes→3D Volumes tool→ Talairach→Auto-‐AC-‐PC-‐TAL 5 Brain Voyager 2.4: Abridged Protocol Belyk November 2012 III. Functional Processing 3. Create .fmr Project (one for each scan) 3.1 Click on “Project Wizard” from Menu bar 3.2 Project name in format Subject#_Run NOTE: If you do not name the fmr starting with the subject number, there will be big problems when running the random effects analysis 3.3 Select source file 3.4 Select Yes to the question about renaming the DICOM files 3.5 Click on file in “Project Source Files” window and click OK. If not, it will not work. 3.6 Verify parameters (slices, volumes, TR etc.) • Correct TR if necessary (it is often incorrect). • Select volumes to skip, if necessary • Click Verified box • Inspect data for artifacts: Options à Time Course Movie 3.7 Attach .prt file Under Reference protocol (PRT) file 3.8 Close FMR properties window 3.9 Keep .fmr file open for next step. 4. Pre-‐process data 4.1 If not already open, open the .fmr file 4.2 Analysis à FMR Pre-‐processing • Do NOT select Slice Scan Time Correction (Unless you will use Granger Causality Modelling) • Select 3D motion correction • Select Spatial Smoothing (opportunity 1) • Select Temporal Filtering AdvancedàTemporal FilteringàOptions… à Frequency Space Filterà Hz à 0.0078125 Hz (1/128 per S) COPY & PATE cut-‐off value from protocol 4.3 Note maximum movement in any direction. • See last page for legend. 4.4 Save head motion plot. • Right click on plot à Save snapshot 4.4 When done, close all windows. 5. Coregister FMR à VMR in native space 5.1 Open .vmr in native space (ISO_SAG) 5.2 3D volume tools à Coregistration tab • Press Select FMR. Use the preprocessed .fmr created in Step 4 • Press Align à Fine Tuning Alignment àManual Alignment • Press GO This creates the IA.trf and FA.trf files • Initially, things look quite strange. The images won’t look right until after the alignment step. 6 Brain Voyager 2.4: Abridged Protocol Belyk November 2012 5.3 Target display options: inspect for proper alignment (blend: Edges, blend: Mosaic, blend: Transparent). Edges (green) should map onto anatomical boundaries. 5.4 Check for alignment by traveling through the lateral ventricles in axial and coronal views. To do the coronal view, use the shift function with the up and down arrows. 5.5 If Initial Alignment is bad then manual fixing is a last resort • Adjust translation/rotation parameters until coregistration appears subjectively good • Align→ Fine Tuning Alignment → Manual Alignment 5.6 Close all windows. 6. Create and Link .vtc file 6.1 Open .vmr in Talairach form (anatomical… _TAL) 6.2 Analysis à Create 3D-‐Aligned Time Course (VTC) 6.3 Load files from previous steps • .fmr (pre-‐processed) • Autofill the IA.trf and FA.trf by pressing Auto-‐Fill • Click To Tal • Broese for ACPC.trf and ACPC.tal in the Anatomical folder 6.4 Click GO • nothing changes visually to the images when you do this 6.5 Link .VTC • Analysis à Link 3D Time Course (VTC) File (CMD“K”) • BV usually directs you to the .vtc file when browsing • Click OK • Nothing changes visually to the images when you do this 6.7 Leave the VTC-‐linked .vmr file open when proceeding to the next step Quality Control Tool (new to QX2.4) Confirm that all VTC’s are properly aligned. • Options→verify functional coverage→browse for all .VTC’s or an .MDM Graphic display showing % .VTC’s with non-‐zero BOLD signal at each spatial location. Areas with imperfect overlap will have low power in RFX analyses. Can be used for single VTC to check for particular problems Statistical Analyses 7. Single Subject Statistics 7.1 The following steps assume the TAL.vmr is open and is linked with the .vtc and .prt 7.2 Analysis à General Linear Model: Single Study (CMD G) 7.3 Assign predictors • If PRT was linked to .fmr, then the design matrix should open up automatically • Right click one coloured block to assign it as a predictor • Hit the HRF button to set hemodynamic response function (except for sparse sampling) • If there is more than one predictor, then do Predictor à Add Pred. and repeat as above • If the design has multiple factors, it’s important to name the predictors in a systematic manner 7 Brain Voyager 2.4: Abridged Protocol Belyk November 2012 • Add Motion Correction Parameters: Add…à browse for _3DMC.sdm (adds 7 predictors) • Save .sdm file by pressing Save… on the left side of the Single Study GLM box. • Hit GO 7.4 Optional: Apply a spatial mask to prevent unnecessary tests outside the brain • See section 11 on ROI’s for mask creation • In GLM window à Options à Masking/Options → Enable Mask restrictions à browse 7.5 If .sdm file is already created, load it by pressing Load… on the left side. 7.6 Statistical Options • Analysis à Overlay Volume Maps (CMD M) • Deselect negative activations • Choose multiple comparisons solution (FDR or Bonferroni) Bonferroni is under Volume Maps > Map Options • Consider Enabling Cluster Threshold 7.7 Complex Subtractions • Analysis à Overlay General Linear Model (CMD V) • +/-‐ conditions • Note: It is not recommended to manually specify Rest. This is done automatically via baseline. 7.8 Save GLM analysis • Analysis à Overlay Volume Maps (CMD M) à Save .VMP 7.9 To load a GLM analysis, first open the Talairach .vmr • Analysis à Overlay Volume Maps (CMD M) à Load .VMP 7.10 To save a sliceview of the GLM 3D volume tools à Spatial Transformation tab Export .AMR. This automatically saves an .amr file. Pick 36 slices at 4 mm slice distance. When done, make this into a 5 column x 6 row matrix. Screen capture this using Grab, and insert into Powerpoint 7.11. If starting from scratch, open up the Talairach .vmr and link it to the .vtc 7.12 In order to run a new GLM analysis from a different PRT file, go to Analysis à Stimulation protocol, and click on Load .PRT…. Select the new PRT to be run. 8. Contrasts for Multiple Conditions WITHIN a Single Scan (or Across Repeats of a Single Type of Scan) 9.1 Before starting, make sure that all your .vtc files begin with the subject number (e.g., P1, P2). Otherwise, Brain Voyager will not be able to sort the data by subject. 8.1 The following steps assume the TAL.vmr is open and is linked with the .vtc and .prt 8.2 Analysis à General Linear Model: Single Study (CMD G) 8.3 Click on Add Pred. Do this for as many predictors as there are going to be (e.g., click on it 3 times if there are 3 conditions within the scan that you want to contrast). 8.4 To select the epochs for a given condition, right click on the condition-‐name in the menu on the right-‐hand side of the Single Study GLM window. This will add the appropriate name to the predictor. It is critical that the conditions are named consistently across scans. 8.5 Apply the HRF to it. 8.6 Proceed through the predictors one at a time and repeat this for all the conditions in the scan by right-‐clicking on the appropriate condition-‐name in the right-‐hand menu. 8 Brain Voyager 2.4: Abridged Protocol Belyk November 2012 8.7 Within the Single Study GLM window, click on Save… and save an .sdm (single study design matrix) file. 8.8 If you press GO now, all predictors will be run simultaneously. 8.9 To look at each condition independently: Analysis à Overlay General Linear Model (CMD V) All predictors are present in a list. They can be turned on and off independently by toggling the plus sign in each box. 8.10 If this arrangement applies to multiple scans in an experiment (as is the case for Steven’s Phonotopy experiment, for example), then proceed now to steps 9.12-‐9.16 below to combine the results from the multiple scans. In the case of the Phonotopy study, 4 pitch levels (Low, Comfort, Mid, and High) are distributed through 4 scans (Pitch1, 2, 3, and 4). Hence, you need to run a multi-‐
study GLM to see each pitch across the 4 scans. 9. Looking at Contrasts for Multiple Conditions BETWEEN Scans Creating predictors within a scan (step 8 above) is easy to do because the condition-‐names are listed in the side bar of the Single Study GLM window. However, creating predictors between scans is much more complicated, since you have to type out the name of each predictor, and your spelling has to be identical across predictor files. Predictor names have to be IDENTICAL across .SDM files. Otherwise this will not work. This procedure follows the logic of creating a design matrix (.SDM file) in step 8. However, a new process is introduced called “dummy coding”. If scan 1 contains condition 1, and scan 2 contains condition 2, then when specifying predictor 1 for condition 1, a dummy condition must be reserved for condition 2. 9.1 Before starting, make sure that all your .vtc files begin with the subject number (e.g., P1, P2). Otherwise, Brain Voyager will not be able to sort the data by subject. 9.2 The following steps assume the TAL.vmr is open and is linked with the .vtc and .prt 9.3 Analysis à General Linear Model: Single Study (CMD G) 9.4 Click on Add Pred. Do this for as many predictors as there are going to be. Unlike step 8 above, the number of predictors is going to reflect the number of SCANS that are being compared. Hence, if you are comparing tasks across 4 scans, you need to specify 4 predictors. 9.5 Create a list of the ordering of the scans that you are going to compare (4 in this case). 9.6 Starting in scan 1, go to predictor 1. Now, select the epochs of task to be analyzed. Apply the HRF to it. 9.7 Name that predictor with the name of the scan. 9.8 Name the remaining predictors with the remaining scan names. But leave them blank (don’t select any epochs). These are the dummy-‐coded predictors for scan 1. They have no task associated with them within scan 1. 9.9 Click on Save… on the lower left of the Single Study GLM window, and name the predictor file. 9.9 Repeat this whole procedure for the next scan by linking the .vtc file for scan 2 to the anatomical. However, this time predictor 2 will be the one whose epochs will be selected and HRF’d. Predictors 1, 3, and 4 will be dummy coded. NOTE: the predictors have to be named identically as within scan 1. Otherwise, this will not work. 9.11 Repeat this for all of the scans to be compared. 9.12 Run Analysis à General Linear Model: Multi Study, Multi Subject (CTL U) 9 Brain Voyager 2.4: Abridged Protocol Belyk November 2012 9.13 Click on Add to List…. Doing this one at a time, enter the .vtc for each scan as well as its associated predictor file. 9.14 Within the window for General Linear Model: Multi Study, Multi Subject, click on Save… and save an .mdm (multiple study design matrix) file. 9.15 Run the analysis by clicking on “z transform” and “Separate subject predictors”. Press GO. 9.16 To select individual conditions or to do contrasts between condition, click on Analysis à Overlay General Linear Model (CTL V). The individual conditions should be listed there. You can create contrasts by toggling + and – for the boxes for each condition. 9.17 To run a Conjunction Analysis • Analysis à Overlay General Linear Model • Click on Add Contrast (1 contrast per condition) • Assign one condition per contrast (i.e., +1 0, 0 +1) • Click the “conjunction analysis” radio box for each contrast and press OK to run. 10. Random Effects Analysis for Multi-‐Subject Results 10.1 Before starting, make sure that all your .vtc files begin with the subject number (e.g., P1, P2). Other wise Brain Voyager will not be able to sort the data by subject. 10.2 Before starting, make sure you have an .SDM file with the predictors. In theory, you only need one file since all the scans will use the same design matrix (predictors). 10.3 Analysis à General Linear Model: Multistudy, Multisubject (CMD U) 10.4 Populate the “General Linear Model: Multistudy, Multisubject” design matrix • Click on Add to List… • Browse for a .VTC • Browse for an .SDM file (this should be common for each scan) • Repeat for each scan (this goes more quickly if you have an .SDM paired with each VTC) • NOTE: don’t confuse the single study design matrix with head motion correction file (both are .SDM files!) 10.5 Verify Design matrix MDM window (CMD U) à Design Matrix 10.6 Click on RFX GLM radio box before saving 10.7 Save .MDM… (multisubject design matrix) If you have a lot of subjects, it is best to save this file early on, and just keep on using “save as” to replace the file. Otherwise, if you make an error, you could lose all your work. 10.8 Select a type of analysis for the multisubject data • Select “RFX GLM” box for a random effects analysis to average ACROSS subjects “Separate subject predictors” will be automatically selected. • Fixed effects analysis is used if averaging WITHIN subject To average across scans for a single subject, select nothing except the “z-‐transform” default. Select “separate study” to keep all predictors separate. 10.8b If you're comfortable with design matrices you can get a nice sanity check at this stage • Multistudy GLM window → Design Matrix...→Design Matrix Plot 10.9 Click GO to run the analysis. 10.10 In order to save the results, go to Analysis à Overlap General Linear Model (CMD V). In that window, click on Save .GLM. 10 Brain Voyager 2.4: Abridged Protocol Belyk November 2012 10B. RFX ANOVA (as an alternative to contrasts in GLM) 10B.1 Run RFX as in section 10 10B.2 Set up a model for ANOVA • Analysis→ANCOVA RFX→ Design (Set number of factors, levels & covariates) →Go 10B.2 Choose a factors/levels to display • Analysis→ Overlay RFX ANCOVA→ (choose a factor or specify a contrast vector) 11. Create ROIs 11.1 Define VOI from clusters • Set criterion to desired threshold (ie. FDR or Bonferonni) • Optionsàcreate volumes of interest from map clusters 11.2 Draw an ROI by hand • 3D volume toolsàsegmentationàenable • CMD + left click to draw ROI • 3D volume toolsàsegmentationàoptions àdefine ROI 11.3. Analyze ROI’s • Analyzeàregion-‐of-‐interest analysis (CMD”R”) àoptionsàVOI GLMàVOI GLM • Analyzeàregion-‐of-‐interest analysis (CMD”R”) àoptionsàVOI GLMàtable 11.4 Create Mask from ROI’s • Select ROI in ROI analysis menu • Volume of Interest Analysis Window à Options…àVOI FunctionsàUse selectedàCreate Mask 11.5 Apply Mask to Single study GLM • Single Study GLM à Options…àmasking/OptionsàEnable Mask Restrictionàbrowse for .MSK • Load an existing .SDM file (e.g., from a previous, unmasked GLM) à GO 11.6 Apply Mask to Multi-‐Study GLM • Mutli Study GLM à Options…à Enable Mask Restrictionàbrowse for .MSKàOk • Load existing .MDM àGO Data Displaying 12. Voxel Reports (occasionally misses peaks) 12.1 Set Cluster threshold (recommend 15 voxels, be sure not to lose peaks of interest) • Overlay Volume MapsàStatisticsà Enable Cluster Threshold 12.2 Set Volumes of Interest (VOI’s) • Options à Create Volumes of Interest 12.3 Generate Peak Voxel table • VOI Analysis WindowàOptionsàVOI functions à Map PeakàTable 12.4 Generate Cluster Size table • VOI Analysis WindowàOptionsàVOI functions à Center of GravityàTable 13. Create Display 2D Display 13.1 3D volume tools → Spatial Transformation→Export .AMR 11 Brain Voyager 2.4: Abridged Protocol Belyk November 2012 •
Axial, Slices = 36, Slice Width = 4mm • click
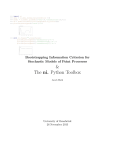
to make the grid 5 columns by 6 rows. 13.2 CMD+SHIFT+4→Click & drag area to screen capture (sends to desktop) 13.3 Add screen capture to powerpoint template. Annotate with appropriate details. 3D Inflated brain 13.3 View Mesh • Translation → Right Click & drag • Rotation → Left Click & drag • Zoom → Control + Left Click & drag • Slice Mesh • TRA/SAG/COR cut • Alt + Left click & drag 13.4 Cortex Segmentation • 3D Volume Tools→Sementation→Auto Segment→ check “grey matter (pial) boundary” • 3D Volume Tools→Sementation→Auto Segment→ check “ remove bridges 13.5 Align WM/GM cutoff between two peaks of histogram → Go • Image quality will look poor during construction 13.6 load ___RECOSM.SRF (step7.4) 13.7 Quality Control • Surface window→Meshes→Spatial Transformation→(mesh→.VMR) • Navigate .VMR & ensure segmentation fits white/grey matter boundary (shown in yellow) • To remove WM/GM boundary: 3D Volume Tools→ Segmentation→Reload All 13.8 Inflate Mesh • Open _TAL.VMR • Mesh→load mesh (RECOSM.srf, step 7.2) • Mesh→Mesh Morphing→check Inflate→Set NrOfRepetitions → Go • Repeat as Necessary 13.9 Colour Code • Mesh→Mesh Surface Functions → “Curvature” • → “Smoothing” • Repeat as necessary (X3) • To set colours: Mesh→ Material (colour) 13.10 Overlay Statistics • Open _.VMR & _.SRF • Load _.VMP to _. VMR (Analysis→Overlay volume maps→load .VMP) • Mesh→Surface Maps→Create _.SMP • Save _.SMP 13B Fix poor Surface Meshes Meshes will almost always come out crappy on the first try. It’s generally recommended to work with the fie _RECOSM.vmr which represents the WM/GM boundary It is worth doing anatomical preprocessing before even considering this step. 13B.1 Load a peeled VMR and create a mesh 12 Brain Voyager 2.4: Abridged Protocol Belyk November 2012 • Close VMR. Load _WM_BL2 (BL2 = bridge removal algorithm). Reload mesh • WM is shown in blue, WM/GM boundary shown in yellow 13B.2 Show the automatically detected GM and WM • File→load secondary .VMR → browse for .VMR used to produced the mesh • 3D tools→ spatial trans→ check “Blend1” (or “Blend2”) and “append after current” 13B.3 Correct the GM and WM • On Mesh→click vertex mode (side bar) → click location of crappiness • On .VMR the cursor is now at the source voxel for the crappiness. • 3D tools→ segmentation → check Enable → SHIFT + click to erase, CMD + click to draw • Continue until the area looks appropriate • Repeat for this section until you’ve worked on all the crappy parts • 3D tools→ segmentation → Prepare • File→Save as… _MC1.VMR (Manual Correction) 13B.4 Make a new mesh • 3D tools→ spatial trans→ Primary VMR • Meshes→ Create mesh… → Reconstruct (makes a new mesh) • Meshes→ Mesh Morphing → Go (smooth’s the mesh) • Meshes→ Save mesh as… → Append _MC1 to filename to show the version of this mesh • Examine the new mesh for residual crappiness… 13B.5 Repeat 14B.3 and 14B.4 as necessary. Below I fixed a single problem in a single hemisphere (left). The skull was being detected as white matter (middle). After erasing all the yellow skull voxels on all axial slices I made a new mesh (right). This single fix took about 15 minutes. 14 Granger Causality Mapping Slice time correction and high-‐pass filtering are highly recommended. 14.1 Single Subject • Load .VMR • Load seed region .VOI Analysis → Region-‐of-‐Interest Analysis → Load… • Load GCM Plugin Plugins→ RFX Granger Causality Mapping (GCM) v2.5 13 Brain Voyager 2.4: Abridged Protocol Belyk November 2012 •
•
•
•
•
load .VTC files for the subject + → browse for .VTC Default settings use the whole run (all tasks & rest) minus the first/last 5 volumes. Epoch Selection → Go (gives filename tag –RUNCOND-‐interval) For task specific analysis check use protocol Epoch Selection → check use protocol condition per VTC→ choose a task→ Go Map of effective connectivity is automatically loaded (-‐dGCM) Map of functional connectivity can be loaded (-‐INST) Group Analysis • Load .VMR • Load seed region .VOI Analysis → Region-‐of-‐Interest Analysis → Load… • Load GCM Plugin Plugins→ RFX Granger Causality Mapping (GCM) v2.5 • Load from .MDM… • Default settings use the whole run (all tasks & rest) minus the first/last 5 volumes. Epoch Selection → Go (gives filename tag –RUNCOND-‐interval) • For task specific analysis check use protocol Epoch Selection → check use protocol condition per VTC→ choose a task→ Go • Map of single subject results for effective connectivity is loaded (-‐dGCM) • Map of single subject results for functional connectivity can be loaded (-‐INST) • Perform RFX on the loaded maps. Volume Maps → Advanced → Combind Maps → highlight all → T-‐Test <G1> 0 Group Analysis With Single Subject Seeds • Load .VMR • Load single subject seed region .VOIs (name each as SUBJECT_ROINAME) • .VOI file should contains single subject VOIs and an additional VOI consisting of all voxels found in the single subject VOIs (combined using OR in ROI tools) • Name this ROI logical_OR Analysis → Region-‐of-‐Interest Analysis → Load… • Load GCM Plugin Plugins→ RFX Granger Causality Mapping (GCM) v2.5 • Load from .MDM… • Default settings use the whole run (all tasks & rest) minus the first/last 5 volumes. Epoch Selection → Go (gives filename tag –RUNCOND-‐interval) • For task specific analysis check use protocol • Epoch Selection → check use protocol condition per VTC→ choose a task→ Go 15. Inter-‐regional correlations RFX This section will describe how to perform whole brain correlations with a seed region. Importantly we use the residuals from the GLM to avoid looking at simple co activation. We look for correlations that are NOT explained by mutual involvement in the task. 14 Brain Voyager 2.4: Abridged Protocol Belyk November 2012 15.1 Make a .voi for the seed region (see previous sections). 15.2 Extract time course for the seed region for each • Link.VTC • VOI window-‐> Options-‐>VTC Data-‐>choose an ROI-‐>Table • Repeat for all conditins and subjects 15.3 Extract model time course • Single study GLM-‐>click task of interest-‐>HRF-‐>Save… 15.4 Combine 15.2 and 15.3 into an excel spreadsheet • Manaully change the file extensions to .TXT • Open in excel-‐>Load file-‐>Delimited-‐>check ‘space’ • • Repeat for all files, then combine into single spreadsheet • 1 columns per task per subject (from 15.2) + 1 for the model (from 15.3) 15.5 Run GLMs in R or other statistical packages • Run a GLM for each task and subject using the model (15.3) as the predictor • Export the residuals from each model R notes here 15.6 Export each residual time course separately • Paste each into text document with the format below • Use file extension .RTC FileVersion: 2 Type: DesignMatrix NrOfPredictors: 1 NrOfDataPoints: {how many TRs?} "Name" {columns of values here} 15.7 Make correlation map in BV • Analysis-‐>Compute Linear Correlation Maps-‐>load .RTC-‐>GO • Overlay volume maps-‐>Save .VMP • Repeat for each task and subject 15.8 Perform random effects analysis on saved images 15