1
3. MDI
3.9 VIDEO MENU
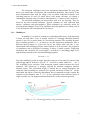
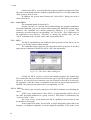
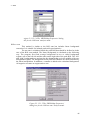
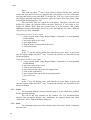
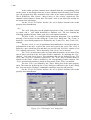
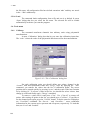
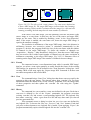
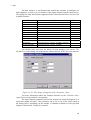
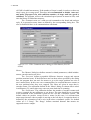
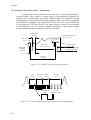
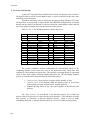
If the visible spectrum contains more channels then the corresponding pixels
on the screen, it may happen that two or more channels share the same pixel. In that
case, the program may draw maximal, mean value of the counts or minimal counts.
This is defined by ‘Max Counts’, ‘Mean Counts‘ or ‘Min Counts’ respectively. The
channels which content is below this ‘Threshold’ value is not taken into account for
the mean value calculation.
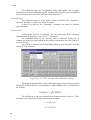
For the ‘Set All To Default’ and the ‘Set All As Default’ buttons refer to this
property sheet introduction.
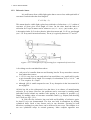
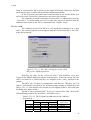
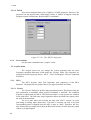
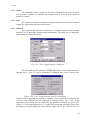
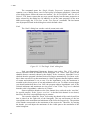
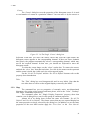
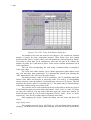
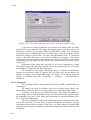
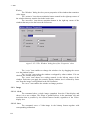
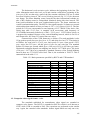
Axis
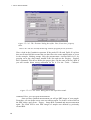
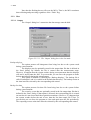
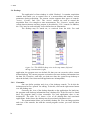
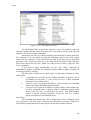
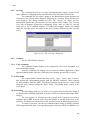
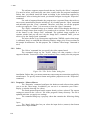
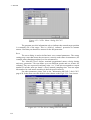
The ‘Axis’ dialog box sets the graphical properties of the y, also called vertical
or counts, and x , also called horizontal or channels, axis. The axis contains the
following graphical objects: frame, grid, ticks, tick numbers and titles.
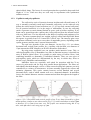
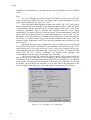
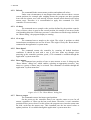
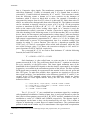
The axis ‘Frame’ is a rectangle drawn around the histogram. You can disable
drawing of one or more its sides using the ‘Frame Style’ dialog box. The ‘Frame’ is
drawn by a pen which properties are defined by the ‘Frame Line’ and ‘Frame Tick’
controls.
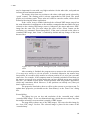
The axis ‘Grid’ is a set of equidistant, horizontal and/or vertical lines that are
perpendicular to the axes: x-grid to the x-axis and y-grid to the y-axis. The ‘Grid’ is
drawn by a pen, which line style and thick you can set with ‘Grid Line’ and the ‘Grid
Tick’ controls respectively. This is donesonly if the ‘Draw’ box is checked.
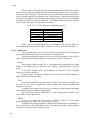
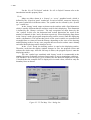
The ‘Ticks’ are short lines at the axes that mark the distance in axis units. They
can be drawn on each of the four frame borders separately, by checking the ‘Top’,
‘Bottom’, ‘Left’ and ‘Right’ boxes. Their thickness and size are defined by the ‘Tick
Thick’ and ‘Thick Size’ controls, respectively. The ‘Ticks’ may be drawn inside or
outside of the frame, which is defined by the corresponding combo controls. The
‘Ticks’ are labeled by numbers, which are shown only if the ‘Ticks’ are enabled
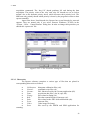
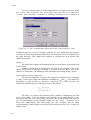
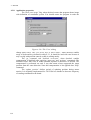
The axis ‘Titles’ are defined by the ‘Titles’ dialog box of the same property
sheet. The colors are defined by the ‘Color’ dialog box and font by the ‘Fonts’ dialog
box. You can use the ‘Desktop’ command to customize axis size and position.
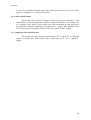
For the ‘Set All To Default’ and the ‘Set All As Default’ buttons refer to this
property sheet introduction.
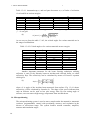
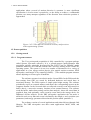
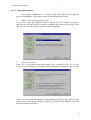
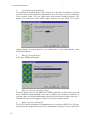
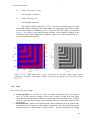
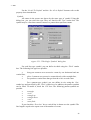
Figure 3.5.1.3 The Single ‘Axis’ dialog box.
90