1
LiDCOview Pro V1.1 Users Manual
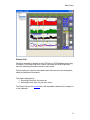
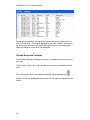
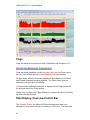
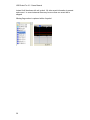
Events are also listed on the side of the Trend window along with calibration
and CVP data flags. The events are listed by time and number. By hovering
the cursor over the event, the relative time the event occurred, description,
detail and additional information are displayed.
Preload Response Variables
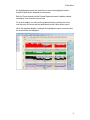
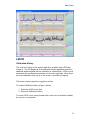
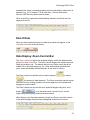
The Preload Response Variables are shown in a separate window as a trend
over time.
The time axis is set on the Trend window and can only be adjusted from that
view.
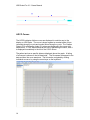
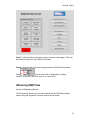
The y-axis can be set for each graph individually using these buttons:
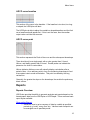
Numeric values are displayed when a section of the graph is selected with the
mouse.
12