1
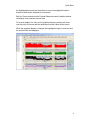
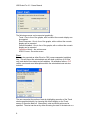
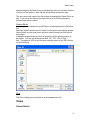
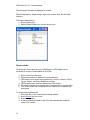
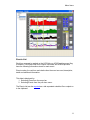
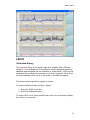
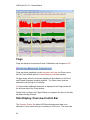
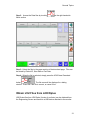
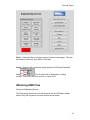
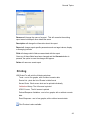
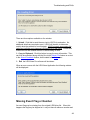
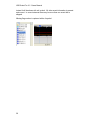
Quick Start
Getting Started
LiDCOview Pro offers a quick and easy way to browse, export, analyze, and
report data generated by the LiDCOplus and LiDCOrapid Hemodynamic
Monitors. Data can be easily obtained from the LiDCOplus or LiDCOrapid via
a USB drive and then transferred to a PC for use with the LiDCOview
software.
Intended Use:
LiDCOviewPro is intended for review of historical data for research and
education.
It is not intended for use in the diagnosis of disease or other conditions.
1. Opening Files
1. Double click either *.LVU (from LiDCOplus Version 4 or greater;
or from LiDCOrapid) or *.HBD (from LiDCOplus Version 3) or
2. Select the either
or File --> Open from the menu bar and
choose the file you are interested in.
3. The default view is the Trend screen. This will show the first 2
hours of data with the Zoom bar set to display the middle 50%.
4. LiDCOview Pro can open multiple files and windows within the
application.
2. Trend Window Overview: Designed to be similar to the LiDCOplus
Trend Screen and the LiDCOrapid History Screen. Displays the data in
four windows graphically with numeric data displayed on the right in the
same colour as the graphical display. The numeric data can be
displayed as Absolute or Indexed by clicking on the button in the upper
right corner.
1. Oxygen Delivery (blue line) and Cardiac Output (red filled
graph). Calibration flags are displayed in this window as either
cyan (acceptable calibration) or yellow (questionable
calibration). The calibration factor is displayed numerically in
the flag.
2. Systemic Vascular Resistance (green filled graph). Pink flags
are displayed on this window to indicate new values of CVP that
were entered into the LiDCOplus.
3. Systolic (black peak) - Mean (red line) - Diastolic (black trough)
and Pulse Pressure (orange line). Event flags are displayed in
this window as dark blue with the event number shown in white.
1