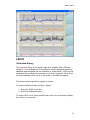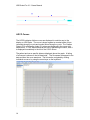
1
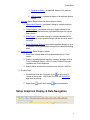
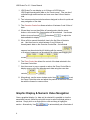
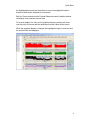
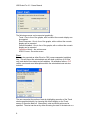
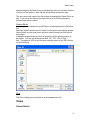
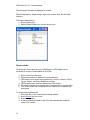
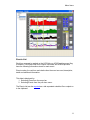
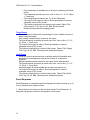
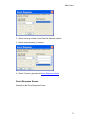
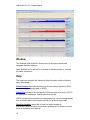
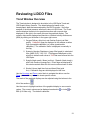
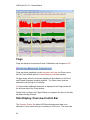
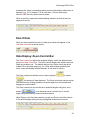
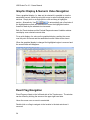
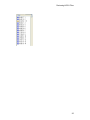
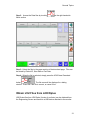
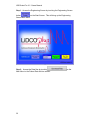
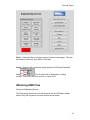
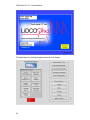
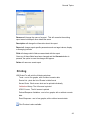
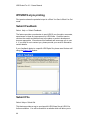
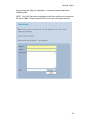
LiDCOview Pro V1.1 Users Manual
Table Of Contents
Quick Start .......................................................................................................1
Getting Started .............................................................................................1
Setup Graphical Display & Data Navigation .................................................3
Graphic Display & Numeric Value Navigation ..............................................4
Menu Items ......................................................................................................7
File ...............................................................................................................7
Edit ...............................................................................................................7
Export ...........................................................................................................7
Views............................................................................................................9
Patient Details...........................................................................................9
Screen shots...........................................................................................10
Events List ..............................................................................................11
Preload Response Variables ..................................................................12
LiDCO ........................................................................................................13
Calibration History ..................................................................................13
LiDCO Curves.........................................................................................14
LiDCO curve baseline.............................................................................15
LiDCO curve peak ..................................................................................15
Reports.......................................................................................................15
Reports Overview ...................................................................................15
Event Response .....................................................................................16
Event Response Screen .........................................................................17
Window ......................................................................................................18
Help............................................................................................................18
Reviewing LiDCO Files ..................................................................................21
Trend Window Overview ............................................................................21
Flags ..........................................................................................................22
Data Display: Overview Control Bar ...........................................................22
End of Data ................................................................................................23
Data Display: Zoom Control Bar.................................................................23
Graphic Display & Numeric Value Navigation ............................................24
Event Flag Navigation ................................................................................24
General Topics...............................................................................................27
Activate Software .......................................................................................27
Obtain LiDCOview files from the LiDCOplus ..............................................29
Obtain LVU Files from LiDCOrapid ............................................................30
Obtain LVU Files from LiDCOplus..............................................................31
Obtaining HBD Files...................................................................................33
Exporting Data and Files ............................................................................35
Creating Reports ........................................................................................36
Create Audit Report....................................................................................37
Audit Report Output....................................................................................38
Create Observation Report ........................................................................38
Observation Report Output ........................................................................39
Create Target Report .................................................................................39
Target Report Output .................................................................................40
Data Set Selection......................................................................................40
Field Selection Window ..............................................................................41
iii
LiDCOview Pro V1.1 Users Manual
Saving Reports...........................................................................................41
Changing Saved Reports ...........................................................................42
Printing .......................................................................................................43
WYSIWYG style printing ............................................................................44
Submit Feedback .......................................................................................44
Submit File .................................................................................................44
Troubleshooting and FAQs ............................................................................47
More LiDCO curves than Calibration Factors .............................................47
No Indexed Data Display............................................................................47
No Oxygen Delivery Data ...........................................................................47
Numeric Data is Blank or Zero ...................................................................47
Files open in LiDCOview SE ......................................................................47
Numeric Values Change ............................................................................48
LiDCOview Errors.......................................................................................48
Missing Event Flag or Number ...................................................................49
Glossary.........................................................................................................51
Index ..............................................................................................................53
iv
Quick Start
Getting Started
LiDCOview Pro offers a quick and easy way to browse, export, analyze, and
report data generated by the LiDCOplus and LiDCOrapid Hemodynamic
Monitors. Data can be easily obtained from the LiDCOplus or LiDCOrapid via
a USB drive and then transferred to a PC for use with the LiDCOview
software.
Intended Use:
LiDCOviewPro is intended for review of historical data for research and
education.
It is not intended for use in the diagnosis of disease or other conditions.
1. Opening Files
1. Double click either *.LVU (from LiDCOplus Version 4 or greater;
or from LiDCOrapid) or *.HBD (from LiDCOplus Version 3) or
2. Select the either
or File --> Open from the menu bar and
choose the file you are interested in.
3. The default view is the Trend screen. This will show the first 2
hours of data with the Zoom bar set to display the middle 50%.
4. LiDCOview Pro can open multiple files and windows within the
application.
2. Trend Window Overview: Designed to be similar to the LiDCOplus
Trend Screen and the LiDCOrapid History Screen. Displays the data in
four windows graphically with numeric data displayed on the right in the
same colour as the graphical display. The numeric data can be
displayed as Absolute or Indexed by clicking on the button in the upper
right corner.
1. Oxygen Delivery (blue line) and Cardiac Output (red filled
graph). Calibration flags are displayed in this window as either
cyan (acceptable calibration) or yellow (questionable
calibration). The calibration factor is displayed numerically in
the flag.
2. Systemic Vascular Resistance (green filled graph). Pink flags
are displayed on this window to indicate new values of CVP that
were entered into the LiDCOplus.
3. Systolic (black peak) - Mean (red line) - Diastolic (black trough)
and Pulse Pressure (orange line). Event flags are displayed in
this window as dark blue with the event number shown in white.
1
LiDCOview Pro V1.1 Users Manual
4. Stroke Volume (dark blue line) and Heart Rate (pink
line) Calibration flags are also displayed in this view.
3. Navigating the Hemodynamic Data
1. Use the Overview Bar to select the time period of interest by
clicking on a 2 hour segment, or by clicking and dragging the
mouse over multiple 2hr segments. Up to 24 hours of data can
be displayed at a time.
2. If there is more than 24hrs of data in the file, use the arrow
keys to move forward
or backward
through the available data by increments of 2hrs (single arrow)
or 24 hours (double arrow).
3. Use the Zoom control bar to expand, reduce or move around
within the period selected. By default the Zoom control bar
starts at the middle 50% of the data selected. Use the cursor to
move the bar, or to expand/reduce it's size by selecting the
handles at either end and dragging them.
4. Alternatively select
to set the Zoom bar to a
specific size. Use the same button to advance or reverse the
Zoom bar by one increment of it's current size .
5. LVU files only: Use the listing of flags for events, calibrations
and CVP changes to navigate by double clicking on a flag icon.
4. Highlighting Data and Displaying Numeric Values
1. Click on the graphical portion of the Trend to display the values
for hemodynamic variables in the table on the right hand
side. Click and drag to display an average over a section of
data.
2. Use
to automatically set a fixed size of the
highlighted area and use the buttons to move the highlighted
section forward or back by the selected size increment.
5. Views: Select the View menu option to obtain
1. Patient Details - ID, age, height, weight, BSA, start date &
time
2. Listing of Screen Shots (as JPG files)
3. Listing of Event details
4. Preload Response Variables Display (SVV, PPV, SPV,
HRV)
6. LiDCO: Calibration details and Indicator Dilution curves
2
Quick Start
1. Calibration History - a graphical display of the patients
calibration events
2. LiDCO curves - a graphical display of all indicator dilution
curves.
7. Reports: Select Reports from the menu option to obtain
1. Observation Reports - generates a listing by variable and time
period
2. Target Reports - generates a listing by single variable of the
percent of time above/below a user specified target for a given
time interval.
3. Audit Report - generates a listing by multiple variables for the
time to achieve a user specified target and the time at or above
the target.
4. Event Response Window generates a graphical display of up to
4 variables showing percentage change from a baseline starting
point.
8. Exporting Data: Select Export to obtain:
1. Excel Data: exports data to Excel spreadsheets from Trend
screen.
2. Graphs: exports graphical data from selected windows such as
Trend, Calibration History, LiDCO Curves, Preload Response
Variables and Event Response.
3. Screen Shots: exports the selected screen shot as a JPG file.
9. Printing Data
1. Choose Print from the File menu or via
to print what is
viewed on the screen. LiDCOview Pro uses the WYSIWYG
approach for printing.
2. Page Setup
and Print Preview
are also available.
Setup Graphical Display & Data Navigation
3
LiDCOview Pro V1.1 Users Manual
1. LiDCOview Pro can display up to 24 hours of LiDCOplus or
LiDCOrapid hemodynamic data on the Trend screen. Files can be of
unlimited length and therefore can have more than 24hrs of data in
total.
2. Two interconnected controls have been designed to allow for quick and
easy navigation of the data
3. The Overview Control bar allows selection of between 2 and 24 hrs of
data.
4. Where there is more than 24hrs of hemodynamic data the arrow
buttons at the end of the Overview bar will be activated. Use theses
buttons to move forward
data available for display.
or backward
to adjust the
5. When a file is opened the default view is the first 2hrs of the data
set. Use the mouse to select between 2 and 24 hours of
hemodynamic data on the Overview Control Bar. An individual
segment can be selected by left clicking with the mouse
,
or a series of segments can be selected by clicking and dragging the
mouse
6. The Zoom Control bar allows fine control of the data selected in the
Overview Control bar.
7. Use the mouse to move, expand or reduce the Zoom Control Bar to
display some or all of the hemodynamic data using the zoom bar
controls:
or
8. Alternatively, use the zoom window control icon
to set
the Zoom Control bar size and adjust the position of the Zoom Control
bar with the forward or reverse icons.
Graphic Display & Numeric Value Navigation
Once a graphical display (i.e. data set) is selected it is possible to view the
associated numeric values by using the cursor to select individual points or
sections. Simply click on a single point or click and drag to highlight a
section. Alternatively, Use
4
to automatically set a fixed size of
Quick Start
the highlighted area and use the buttons to move the highlighted section
forward or back by the selected size increment.
Both the Trend window and the Preload Responsiveness Variables window
can display user selected numeric data.
For a quick display of a value on the graphical display, position the cursor
over the point of interest and the associated numeric value will be shown.
When the graphical display is changed the highlighted region is removed and
the numeric data will disappear.
5
Menu Items
File
The file menu contains the following options:
Open files: LiDCOview Pro will open file extensions LVU (LiDCOplus
Version 4.0 and LiDCOrapid) and HBD (LiDCOplus Version 3.0).
Page Setup
Print Preview
Print
Exit
List of last 5 most recently opened files
Edit
The Copy function can be used to
Copy the entire Event List onto the clipboard
Copy a Screen Shot onto the clipboard
Export
Select Export from the Menu list and the choose from Excel, Graph or
Screenshot, depending on the item to be exported.
Graph
Data display screens can be exported as Graphs. The graphs can be saved
as BMP, GIF, TIFF, JPG or PNG files. The default is PNG.
7
LiDCOview Pro V1.1 Users Manual
The following screens can be exported graphically:
Trend: One to four of the graphs, with or without the numeric display can
be exported
Event Response - One to four of the graphs, with or without the numeric
display can be exported
Preload Variables - One to four of the graphs, with or without the numeric
display can be exported
Calibration History - the entire screen
LiDCO Curves - the entire screen
Excel
Data can be exported as either Excel or CSV (comma separated variables)
files. This will export the selected data set with both a real time (LVU files
only) and relative time stamp and all variables. All calibration factors, CVP
values, events and event descriptions within the selected data set are also
included.
The user can select the portion of data by highlighting a section of the Trend
window graphical display, by choosing the current display on the Trend
screen or the entire data set. Alternatively, start and finish points can be
specified. The start can be set by either choosing the start of the data set or a
8
Menu Items
specified flag and the finish can be a specified flag that occurred after the start,
or the end of the data set. Note that the finish cannot precede the start.
The user can set the name of the Excel sheet by changing the Sheet Prefix as
well. If the size of the data set exceeds the size of an Excel spreadsheet,
further sheets will be created.
Screen Shots
Any screen shots created on the LiDCOplus can be exported from LiDCOview
Pro.
Select the specific screen shot for export from the screen shot display window
Select Export from the main menu and then select Screenshots from the pull
down menu
A dialogue window allows the file to be renamed, the file storage location to
be chosen. The files can be saved as BMP, GIF, TIFF, JPG or PNG
files. The default is JPG as the files were originally saved in the JPEG format
on the LiDCOplus.
Text
The Event Listing can be exported as a tab-separated text file.
Views
Patient Details
9
LiDCOview Pro V1.1 Users Manual
The following information is displayed in a table:
Patient identification, height, weight, age, body surface area, file start date
and time.
This data is displayed by:
1. Select Views menu
2. Select Patient Details from the pull down menu
Screen shots
All the screen shots captured on the LiDCOplus or LiDCOrapid can be
accessed for review or downloaded as JPG files.
1. Select Views from the menu
2. Select Screenshots to display the viewing window
3. LiDCOplus screen shots are organised by Calibration History, LiDCO
curves, History, and Event Response screens.
4. LiDCOrapid screen shots are listed under LiDCOrapid
5. All screen shots have the screen name, date and time in the file name
6. The Screen shots can be copied onto the clipboard to be pasted into
documents
To download an individual file
1. Select the file on the Screen shots viewing window
2. Select Export from menu bar
3. Select Screenshot
4. A dialog window will allow for the file to be renamed and a specific
folder to be chosen.
10
Menu Items
Events List
Each time an event is marked on the LiDCOplus or LiDCOrapid an event flag
is created. LiDCOplus files from Version 4 monitors and LiDCOrapid files
have the following information stored for each event:
Event number, the real time and relative time the event occurred, description,
detail and additional information.
This data is displayed by:
1. Selecting Views from the menu bar
2. Selecting Events from the pull down menu
The Events List can be exported as a tab separated variables file or copied on
to the clipboard.
11
LiDCOview Pro V1.1 Users Manual
Events are also listed on the side of the Trend window along with calibration
and CVP data flags. The events are listed by time and number. By hovering
the cursor over the event, the relative time the event occurred, description,
detail and additional information are displayed.
Preload Response Variables
The Preload Response Variables are shown in a separate window as a trend
over time.
The time axis is set on the Trend window and can only be adjusted from that
view.
The y-axis can be set for each graph individually using these buttons:
Numeric values are displayed when a section of the graph is selected with the
mouse.
12
Menu Items
LiDCO
Calibration History
The calibration history for the specific data file is available from LiDCOplus
Version 4. This will display all of the calibration factors graphically as well as
additional data associated with the calibration in a table below. LiDCO curves
associated with a calibration are shown in a list on the right side. When there
are more calibrations than can fit on the screen, a scroll bar will appear.
This screen can be exported as a graph or printed
To view the Calibration History (Figure 1 below):
1. Select the LiDCO menu item
2. Select the Calibration History
To view a LiDCO curve, simply double-click on the curve of interest to display
the curve in a new window
13
LiDCOview Pro V1.1 Users Manual
LiDCO Curves
The LiDCO indicator dilution curves are displayed in a similar way to the
display on LiDCOplus. The curve is shown against a constant scale of time
(seconds) along the x-axis and mmole lithium along the y-axis. The Cardiac
Output (CO) and Cardiac Index (CI) values are displayed in the upper right
hand corner. If ITBV was selected at the time of generating the curve, then it
is displayed immediately to the left of the CO/CI values.
The patient and curve specific data are displayed above the graph. A listing
of all curves is shown on the left hand side. The file names correspond to the
date and time the curve was done. The list can be navigated by clicking
individual curves or by using the arrow keys on the keyboard.
14
Menu Items
LiDCO curve baseline
This section of the curve is the baseline. If the baseline is too short, too long
or sloped, the LiDCOplus will alert.
The LiDCOplus is able to adjust for unstable or sloped baselines and the final
curve baseline should appear flat. If this is not the case, then the cardiac
output value could be less accurate.
LiDCO curve peak
This section represents the Peak of the curve and the subsequent downslope.
There should only be a single peak, with a value greater than 0.1mmol
Lithium, and ideally greater than 0.2mmol. Double peaks can indicate the
presence of a shunt or recirculation.
Lithium indicator dilution curves will naturally display recirculation after a
period of time. At an arbitrary point in time, the remaining downslope is fixed
at a constant rate to avoid recirculation. This point is marked by the long
vertical line.
Generally, the greater the slope on the downslope, the smaller the pulmonary
blood volume.
Reports
Reports Overview
LiDCOview provides the ability to generate analysis and reports based on the
hemodynamic data from the LiDCOplus or LiDCOrapid. There are three basic
report styles available:
Observation Report
• Allows the user to get a summary of data by variable at specified
periods (e.g. hourly, every 4hrs, etc). Values at each timepoint can
be averaged over a specified period.
15
LiDCOview Pro V1.1 Users Manual
•
•
•
•
•
Any combination of variables can be chosen by selecting the Fields
button
The observation periods vary from 1min to 4hrs (1, 5, 10, 15, 30min,
1, 2 and 4hrs)
The averaging period options are 15, 30 and 60seconds.
The output of this report is either in Excel spreadsheet or commaseparated values (CSV) format.
The following information is included in the header: Report Title
(Observation), Pt ID, Age, Ht, Wt, BSA, Dataset period,
Observation period and Averaging period.
Target Report
Allows the user to determine the percentage of time a variable is above or
below a specified target.
Only a single variable can be chosen for this report.
The interval periods for display of results vary from 1min to 4hrs (1, 5, 10,
15, 30min, 1, 2 and 4hrs)
The output of this report is either in Excel spreadsheet or commaseparated values (CSV) format.
The following information is included in the header: Report Title (Target),
Pt ID, Age, Ht, Wt, BSA, Dataset period, Observation period
Audit Report
Allows the user to determine when a variable reached a threshold value
and both the percentage and total amount of time at or above this
threshold.
Multiple variables can be chosen for this report via the field selection.
The interval periods for display of results vary from 1min to 4hrs (1, 5, 10,
15, 30min, 1, 2 and 4hrs)
Individual targets for each variable are set when the report is run
The output of this report is either in Excel spreadsheet or commaseparated values (CSV) format.
The following information is included in the header: Report Title (Audit),
Pt ID, Age, Ht, Wt, BSA, Dataset period, Observation period
Event Response
Event Response is a graphical report that displays the relative change in up to
four (4) variables over a period of time.
1. Select Reports from the menu bar and then choose Event Response. A
dialog box will appear to allow for configuration of the output.
16
Menu Items
2. Select the range of data via the Data Set Selection options
3. Select the parameter(s) of interest
4. Select 'Create' to generate the Event Response Screen
Event Response Screen
Example of the Event Response Screen
17
LiDCOview Pro V1.1 Users Manual
Window
The Windows menu allows for arrangement of the open windows and
navigation between windows.
Open windows can be laid out in a cascade or tiled horizontally or vertically
for easier comparison.
Help
The Help menu contains this interactive Help information and the following
items listed below:
Submit Feedback provides an easy way for comments or questions about
the software to be directed back to LiDCO.
Submit File provides a way for specific LiDCOview files to be sent to LiDCO
for questions or assistance. Include comments as well.
LiDCO welcomes this interaction and appreciates the value in hearing directly
from customers about their experiences with the products we provide.
Check for Updates select this to check for recent updates to
LiDCOview. Minor revisions are generally available free of charge to correct
errors or add minor new features.
18
Menu Items
About Displays the version of LiDCOview on your PC.
Disclaimer:
LiDCOviewPro is intended for review of historical data for research and
education.
It is not intended for use in the diagnosis of disease or other conditions.
19
Reviewing LiDCO Files
Trend Window Overview
The Trend window is designed to be similar to the LiDCOplus Trend and
LiDCOrapid History Screens. The data displayed is based on the
hemodynamic data that was analyzed by the LiDCO monitor. No further
analysis of the blood pressure waveform is done in LiDCOview. The Trend
window displays the data in four graphical sections with numeric data
displayed on the right in the same colour as the graphical display. The
numeric data can be displayed as Absolute or Indexed to body surface area
(BSA) by clicking on the button in the upper right corner.
1. Oxygen Delivery (blue line) and Cardiac Output (red filled
graph). Calibration flags are displayed in this window as either
cyan (acceptable calibration) or yellow (questionable
calibration). The calibration factor is displayed numerically in
the flag.
2. Systemic Vascular Resistance (green filled graph) is calculated
from [(MAP-CVP) * 80] / CO . Pink flags are displayed on this
window to indicate new values of CVP that were entered into the
LiDCOplus.
3. Systolic (black peak) - Mean (red line) - Diastolic (black trough)
and Pulse Pressure (orange line). Event flags are displayed in
this window as dark blue with the event number shown in white.
4. Stroke Volume (dark blue line) and Heart Rate (pink
line). Calibration flags are also displayed in this view.
Use the Overview and Zoom control bar's to navigate the data or use the
Flags (with LVU files) instead to locate specific events.
The scale of the graphical displays can be adjusted using the buttons to the
left of the sections
Use the cursor to highlight sections of the graphical display to see numeric
values. The numeric values can be displayed as absolute
or index
to
BSA (LVU files only). The default is absolute.
21
LiDCOview Pro V1.1 Users Manual
Flags
Flags are displayed to represent Events, Calibrations and changes to CVP
Flags are shown graphically on the Overview control bar, the Zoom control
bar, the Trend window and the Preload Response variables window.
All flags shown within the Overview highlight will be available on the Trend
and Preload Response Variables windows. The Zoom control must be
positioned over the flag for it to display.
LVU files contain additional data which is displayed in the Flags window on
the left hand side of the Trend window.
Double click on a flag in the Flags Window to navigate to the point in the data
set where the flag occurred.
Data Display: Overview Control Bar
The Overview Control Bar allows LiDCOplus hemodynamic data to be
selected in 2 hour increments up to a maximum of 24 hours. The control bar
22
Reviewing LiDCO Files
annotates the 2 hour increments showing real time followed by relative time in
brackets (e.g. 17(12) means 17:00 hrs real time, 12 hours since start).
Note for HBD files only relative time is shown.
When a new file is opened the default display selection is the first two hour
segment of the file.
End of Data
When you have reached the end of a data set a red bar will appear on the
Overview control bar as shown below.
Data Display: Zoom Control Bar
The Zoom control bar adjusts the graphical display within the data selected
by the Overview Control Bar. The zoom control displays the relative start and
finish time at either end. The default setting for the Zoom control bar is the
middle 50% of the data range (e.g. if a 2 hour data window is selected the
zoom control will display the data between 30 min and 1hr 30min).
The Zoom control bar handles can be used to expand
or reduce
the amount of data displayed. The Zoom control bar can be moved
with the cursor by clicking anywhere on the bar apart from the handles and
dragging to a new location.
The Zoom control bar can also be set to specified lengths using this set of
buttons
. It can be advanced or reversed by it's current
length using the following forward and back buttons.
Note: When a new Overview selection is made, the Zoom control bar returns
to it's default display setting and any highlighted sections are removed.
23
LiDCOview Pro V1.1 Users Manual
Graphic Display & Numeric Value Navigation
Once a graphical display (i.e. data set) is selected it is possible to view the
associated numeric values by using the cursor to select individual points or
sections. Simply click on a single point or click and drag to highlight a
to automatically set a fixed size of
section. Alternatively, Use
the highlighted area and use the buttons to move the highlighted section
forward or back by the selected size increment.
Both the Trend window and the Preload Responsiveness Variables window
can display user selected numeric data.
For a quick display of a value on the graphical display, position the cursor
over the point of interest and the associated numeric value will be shown.
When the graphical display is changed the highlighted region is removed and
the numeric data will disappear.
Event Flag Navigation
Event Flags are listed on the left hand side of the Trend screen. The window
can be closed by clicking the arrow on the upper right hand side.
Hover the cursor over an event to see details.
Double click on a flag to navigate to the location in the data set where it
occurred.
24
Reviewing LiDCO Files
25
General Topics
Activate Software
LiDCOview Pro is provided as free trial software. During this time the full
features of the software are available for evaluation and general use. Each
time the software is started a reminder is displayed indicating the number of
days remaining on the free trial, or that it has expired. The software can be
registered or activated at this time by pressing the Register button.
Note: There are a limited number of activations for each license. See
Maximum Activations below.
Note: When the software is uninstalled, it requires re-activation.
Alternatively, there is an 'Activate' button on the menu toolbar which will
provide the same function. Once the software is registered this button
disappears.
Online Registration/Activation
Activation is done online and only requires the serial number license sent by
LiDCO when the software is purchased. This is normally sent via email to the
purchaser. The serial number format is LVPx-xxxx-xxxx-xxxx. Entry IS NOT
case sensitive.
27
LiDCOview Pro V1.1 Users Manual
When the serial number is entered correctly, the OK button becomes
active. Press OK to proceed.
If the details are correct, the activation will be successful and the following is
displayed:
If there is an error in the serial number the following is displayed:
No Internet Connection
When there is no internet connection the following alert appears:
Press 'Retry' when the connection problem is fixed, or press Cancel and
proceed with Manual Activation.
28
General Topics
Manual or Offline Activation
Activation can also be done offline or manually by contacting LiDCO
Customer Service between the hours of 9AM and 5PM, GMT.
Step 1: Enter the LiDCOview Pro Serial number and press OK
Step 2: Press Cancel on the Connection Problem alert
Step 3: Phone LiDCO Ltd and give Customer Service your Serial Number
and Challenge number
Step 4: Enter in the Response number from Customer Service. This should
be in the format
Maximum Activations
There are a limited number of activations for each serial number. If the this
limit is reached, no further activations can occur without permission from
LiDCO Ltd. The following alert is displayed when this occurs.
Obtain LiDCOview files from the LiDCOplus
LiDCOview Pro displays the hemodynamic beat to beat data that is stored in
either binary data files (HBD) or zipped files (LVU), which contain the binary
data, plus additional files. These files must be downloaded from the
LiDCOplus Monitor Engineering Screen. LiDCOplus monitors running Version
3 software are only capable of generating HBD files. LiDCOplus monitors
29
LiDCOview Pro V1.1 Users Manual
running Version 4 (or later) software will be only capable of generating LVU
files.
Obtaining HBD Files from LiDCOplus Version 3 monitors
Obtaining LVU Files from LiDCOplus Version 4 (and greater) monitors
Obtaining LVU Files from LiDCOrapid V1 (and greater) monitors
LiDCOviewPro is intended for review of historical data for research and
education.
It is not intended for use in the diagnosis of disease or other conditions.
Obtain LVU Files from LiDCOrapid
LiDCOview files from LiDCOrapid (Version 1 and later) can be obtained from
the Engineering Screen and saved to a USB device attached to the monitor.
Step 1: Access the Engineering Screen by touching the Engineering Screen
button
on the Start Screen. This will bring up the
Engineering Screen Main Menu.
30
General Topics
Step 2: Access the Data files by touching
Menu section
on the right hand side
Step 3: Select the files in the upper section of the download page. Files can
be sorted by Patient ID, Start Date or End Date.
Step 4: When the file is selected, simply press the LiDCOview Download
. The file name will be displayed in a dialog
button
window. Press OK if the file is correct, or cancel if not.
Obtain LVU Files from LiDCOplus
LiDCOview files from LiDCOplus (Version 4 and later) can be obtained from
the Engineering Screen and saved to a USB device attached to the monitor.
31
LiDCOview Pro V1.1 Users Manual
Step 1: Access the Engineering Screen by touching the Engineering Screen
button
on the Start Screen. This will bring up the Engineering
Screen Main Menu.
Step 2: Access the Data files by touching
Main Menu in the Patient Data Archive section
32
on the
General Topics
Step 3: Select the files in the upper section of the download page. Files can
be sorted by Patient ID, Start Date or End Date.
Step 4: When the file is selected, simply press the LiDCOview Download
. The file name will be displayed in a dialog
button
window. Press OK if the file is correct, or cancel if not.
Obtaining HBD Files
Access to Engineering Screen
The Engineering Screen can only be accessed via the LiDCOplus startup
screen using the sequence of screen touches shown below.
33
LiDCOview Pro V1.1 Users Manual
The Main Menu for the Engineering Screen will then display
34
General Topics
Select "Download PulseCO Data" Button
Select ‘Heartbeat Data’ and ‘Binary Data’ and press ‘Copy to External
Drive’. A window will appear with the file name, which should have an
extension of *.HBD.
HBD files generated by Version 3 software do not contain patient specific
information required to provide indexed values. The timestamp is based on a
start time of zero and only shows relative time.
Downloads require the use of a USB storage device. Refer to the LiDCO
website for compatible devices:
http://www.lidco.com/archives/tech/lidcoplus301_usb.pdf
Or alternatively order a compatible device directly from LiDCO.
Exporting Data and Files
Data and files can be exported from LiDCOview Pro via the Export Menu
35
LiDCOview Pro V1.1 Users Manual
Creating Reports
Select Reports on the main menu and Run Report... from the drop down
menu
The dialogue window (below) allows for the selection of the overall
hemodynamic data set, the output of the report, the
Data Selection
The data set for analysis can be pre-selected by highlighting a section, by
choosing what is displayed on the current Trend window or the entire data
set. Alternatively, the start and finish can be user specified from certain
events. The start can be set by either choosing the start of the data set or a
specified flag and the finish can be a specified flag that occurred after the start,
or the end of the data set.
Display Selection
Results can be sent directly to an Excel spreadsheet or to a Comma
Separated Variables (CSV) file; the default is Excel
Report Category
36
General Topics
There are three report categories: All, Observation and Targeting, the default
is All
Select Report
Choose from Observation, Target or Audit reports. There is no default.
Save Report
Place a 'tick' in the box to save the configuration of the report for later use
Fields
For the Observation Report, select the Field button to choose specific
variables. The default is all variables.
Generate
Press Generate when all selections have been made. The Generate button
will not be available for use until all selections are made. A second report
specific window will allow for display interval, averaging interval, threshold,
criteria and the variable as appropriate for each report.
Create Audit Report
An Audit Report is created by following the steps below:
1. Select Reports from the Menu and then select Run Report... to display the
Report Setup Window
2. Select the data to be analyzed
3. Select Display Selection: Excel or CSV
4. Select Report Category: All or Observation
5. Select Report: Audit
6. Select the Fields button and choose the variable(s) of interest
7. Option: Save Report
8. Select Generate and the dialog window Report Settings will appear
9. Enter a Target value for each variable selected and press OK
37
LiDCOview Pro V1.1 Users Manual
10. Audit Report Results are automatically displayed in Excel: Audit Report
Output
Audit Report Output
Create Observation Report
An Observation Report is created by following the steps below:
1. Select Reports from the Main Menu and then select Run Report... to
display the Report Setup Window
2. Select the data to be analyzed
3. Select Display Selection: Excel or CSV
4. Select Report Category: All or Observation
5. Select Report: Observation
6. Select the Fields button and choose the variable(s) of interest
38
General Topics
7. Option: Save Report
8 Select Generate and the dialog window Report Settings will appear
9. Select the Observation Period (1m to 4hr) and the Averaging Period (15,
30 or 60s) and press OK
10. Observation Report Results are automatically displayed in Excel.
Observation Report Output
Example of Observation Report Output
Create Target Report
An Target Report is created by following the steps below:
1. Select Reports from the Menu and then select Run Report... to display the
Report Setup Window
2. Select the data to be analyzed
3. Select Display Selection: Excel or CSV
4. Select Report Category: All or Observation
5. Select Report: Target
6. Option: Save Report
7 Select Generate and the dialog window Report Settings appears
39
LiDCOview Pro V1.1 Users Manual
8. Select a Parameter from the pull down menu
9. Enter a target value
10. Select 'Above' or 'Below' from the pull down menu
11. Select the display period (1minute to 4hours)
12. When all fields are entered press the OK button (it is shaded until all
fields are complete)
13. Target Report Results are automatically displayed in Excel: Target
Report Output
Target Report Output
Data Set Selection
A data set can be selected by
pre-highlighting a section on the trend screen,
choosing what is displayed on the Trend screen or
choosing the entire data set.
40
General Topics
Alternatively, the start and finish can be user specified from certain events.
The start can be set by either choosing the start of the data set or a
specified flag and
The finish can be a specified flag that occurred after the start, or the end
of the data set.
Field Selection Window
The field selection button on the Report Setup menu will display the following
window
The default is for all variables to be selected.
Individually de-select variables by clicking on them with the mouse or
Choose Deselect All and then select only those variables of interest.
Saving Reports
Once a report has been configured in LiDCOview Pro, it can be saved for
repeated use. Simply check the Save Report box on the Report Setup
window. When the report is generated, a Saved Report Details window will
appear allowing a Name and Description to be added. If you decide not to
save the report, simply press Skip Save and the analysis will carry on from
there.
41
LiDCOview Pro V1.1 Users Manual
The saved reports are found by selecting Reports on the main menu and
then Run Saved Reports... from the pull down menu. A Saved Reports
dialog window will appear (see below)
The Saved Reports can be edited, renamed, deleted and re-run from this
window.
To run saved reports the user only needs to re-select the data set.all other
settings will remain as they originally were.
Changing Saved Reports
Saved reports can be edited, renamed, modified and saved as new reports or
deleted from the Saved Reports menu.
42
General Topics
Rename will change the name of a report. This will overwrite the existing
report name but keep all other details the same.
Description will change the information about the report.
Report will change report specific parameters such as target values, display
or averaging intervals
Field will change which fields are associated with the report
Once any of these fields have been changed and the Generate button is
pressed, the option to save the changes will appear.
Delete will remove a saved report
Printing
LiDCOview Pro will print the following windows:
Trend: one to four graphs, with or without numeric data
Events List: prints the list of Events in table format
Screen Shots: Each screen shot can be printed individually
Calibration History: The full screen is printed
LiDCO Curves: The full screen is printed
Preload Response Variables: one to four graphs, with or without numeric
data
Event Response: one to four graphs, with or without numeric data
Print Preview is also available.
43
LiDCOview Pro V1.1 Users Manual
WYSIWYG style printing
Print preview shows the potential output in a What You See Is What You Get
mode.
Submit Feedback
Select: Help >> Submit Feedback
The feature provides a mechanism to send LiDCO your thoughts, comments,
experiences or ideas for improvement for LiDCOview. Customer service
receives the emails and directs them to the sales or product development
team as appropriate. We welcome this feedback and encourage you to use
it. If you wish for us to contact you, please provide your email or alternative
contact details.
If your feedback relates to a specific LiDCOplus file, please send that as well
using the Submit File feature.
Submit File
Select: Help>> Submit file
This feature provides a way to send specific LiDCOview files to LiDCO for
further evaluation. You will be directed to a website which will allow you to
44
General Topics
drag and drop the file(s) for submission. A comment can be added when
submitting files.
NOTE: Only LVU files can be submitted via this form and there is a maximum
file size of 10Mb. Please contact LiDCO if you have a file larger than this.
45
Troubleshooting and FAQs
More LiDCO curves than Calibration Factors
A calibration of the LiDCOplus can occur with a cardiac output from an
alternative method such as bolus thermodilution, doppler or trans
oesophaegeal echo. In these cases the value for LiDCO in the Calibration
History will be blank or zero. It is also possible that a calibration wasn't
attempted for a given LiDCO curve.
No Indexed Data Display
The option to display indexed data only exists with LiDCOview files from
LiDCOrapid and LiDCOplus Version 4 and later (LVU files).
No Oxygen Delivery Data
Oxygen Delivery data is only available if values for hemoglobin and arterial
saturation were inputted into the LiDCOplus during the monitoring session
and the Oxygen Delivery display was switched on.
If any of these items were missing or omitted then there will be no graphical or
numeric Oxygen Delivery Data.
LiDCOrapid does not display oxygen delivery.
Numeric Data is Blank or Zero
There are occasions when the LiDCOplus or LiDCOrapid does not calculate
cardiac output continuously. This can be due to a variety of reasons including
loss of signal, poor signal quality or severe arrhythmia. No graphical display
is available in this circumstance.
Files open in LiDCOview SE
LiDCOview automatically associates HBD and LVU files. If LiDCOview SE
was installed after LiDCOview Pro, the associations for HBD and LVU files will
be directed toward SE.
To correct this simply right click on an HBD file and choose the 'Open With'
option and 'Choose Program'. Select LiDCOview Pro and tick the box that
indicates 'Always use the selected program to open this kind of file'.
47
LiDCOview Pro V1.1 Users Manual
Numeric Values Change
The values displayed at a given point can vary slightly due to
averaging. When the view is zoomed out (e.g. large time frame and amount
of data) the number of beats that are contained in a single pixel is
large. These values are averaged to give the numeric value displayed. As
the zoom moves in (i.e. less time and data) there are fewer beats at each
pixel and the values may change slightly.
LiDCOview Errors
There are two types of errors that can occur with the LiDCOview
application: File Loading and Application.
When an error occurs while opening a LiDCOview file, the window below will
be displayed. Most often this error will be due to a corruption of the file from
the LiDCOplus.
48
Troubleshooting and FAQs
There are three options available on the window:
1 - Submit: Click this to send the error text to LiDCO for evaluation. No
additional details are required or sent. LiDCO will be able to determine
quickly what the problem is from this data. LiDCO strongly encourages this
option as it will help us to improve LiDCOview Pro in the future. Please also
forward the file that caused the error to allow testing of fixes.
2 - Copy to Clipboard: Click this button to copy the error information. This
can then be submitted along with the file via the Submit File feature or as text
in the Submit Feedback feature, both located in the Help menu.
3 - Exit the LiDCOview Pro software will shutdown.
When an error occurs with the LiDCOview Application the following window
will be displayed:
Missing Event Flag or Number
An event flag may be missing from the original LiDCOplus file. When this
happens the flag may be skipped or it may not have a reference number and
49
LiDCOview Pro V1.1 Users Manual
instead it will be shown with a # symbol. All other event information is present
and correct. In some instances there may be more than one event that is
skipped.
Missing flag number is replaced with a # symbol:
.
50
Glossary
A
Audit Report: Analyse data set to determine time to achieve target and time
at target for one or more variables
C
Calibration: Adjustment of PulseCO continuous cardiac output with a known
value for cardiac output. Most often the calibration is done with a
LiDCO cardiac output.
Calibration Factor: Ratio of LiDCO CO to PulseCO CO. The nominal value is
1.0 until the LiDCOplus is calibrated. A cyan or yellow flag is shown on
the Trend screen when a calibration was done.
CF: Calibration Factor
CVP: Central Venous Pressure: manually added to the LiDCOplus monitor in
order to calculate SVR
H
HBD: Heart Beat Data file from the LiDCOplus V3 monitor. This has a limited
amount of data available for display.
HRV: Heart Rate Variation: this variable provides a measure of arrhythmia or
irregular heart rate. When HRV is greater than 5% the use of the
Preload Responsiveness Variables is not recommended.
L
LVU: LiDCOview file created by a LiDCOplus V4 or greater monitor. This file
will take full advantage of the LiDCOview software.
O
Observation Report: Analyse data and produce a report of observations for
one or more variables for a user selected interval and data averaging
periods
Overview Control Bar: Allows for selection of between 2hr and 24hr of data
for display in the Trend and Preload windows.
P
PPV: Pulse Pressure Variation: A Preload Responsiveness Variable that
provides an estimate of the patient's likely response to a fluid challenge.
Generally, when the PPV is greater than 13% the patient is fluid
responsive.
51
LiDCOview Pro V1.1 Users Manual
Preload Responsiveness Variables: The variables PPV, SVV and SPV are
all displayed on the Preload Responsiveness Variables screen. These
variables can be used to indicate the responsiveness of patients to fluid,
when the patient is fully mechanically ventilated, not in arrhythmia and
has a closed chest.
S
SVV: Stroke Volume Variation: A Preload Responsiveness Variable that
provides an estimate of the patient's likely response to a fluid challenge.
Generally, when the SVV is greater than 10% the patient is fluid
responsive.
T
Target Report: Analyse data set for a single variable to determine period
above or below a target value during user selected intervals.
Z
Zoom Control Bar: Allows navigation and display of the data set contained
by the Overview Control Bar. The Zoom control bar can be expanded
to show 100% of the data in the Overview Control Bar, or reduced to a
very small percentage. The Zoom Control Bar also has automated
controls to select a specific size and to move forward and reverse
through the data.
52
Index
A
Audit Report ....1, 16, 37, 39, 40, 43
C
Calibration History...1, 7, 10, 13, 45
Connect to Monitor........................7
Copy .............................................7
CSV files .......................................7
D
Data
Navigation ...............1, 21, 23, 24
E
Edit................................................7
Copy..................................10, 11
Engineering Screen ..............32, 34
Event Flags .....1, 11, 23, 24, 25, 42
Event Response1, 7, 10, 17, 18, 45
Event Response Window..1, 17, 18
Events List ............7, 11, 25, 42, 45
Excel .............................................7
Export
Graph ........................................7
Screen Shot...............................7
Text ...........................................7
F
Files
obtain ......................1, 29, 32, 34
open multiple .............................1
Flag Window .........................11, 25
H
Hemodynamic Data Navigation....3,
25
History.........................................10
I
ITBV............................................14
L
LiDCO curve baseline ...........14, 16
LiDCO curve peak.......................14
LiDCO Curves..1, 7, 10, 13, 14, 16,
45
LiDCOplus Version 4 ......13, 29, 32
LiDCOview SE ............................49
Listing
Events .......................1, 7, 11, 25
Screenshots ..................1, 10, 37
LVU files .....................................49
M
Menu
Edit............................................7
Export........................................7
N
Numeric Values ............................1
O
Observation Report.... 1, 16, 37, 40,
43
obtained ..........................29, 32, 34
Open...........................................49
Flag Window .....................23, 25
Overview Control Bar... 1, 3, 21, 23,
24
P
Patient Details...........................1, 9
Preload Response Variables ...1, 7,
12, 23, 45
Print Preview................. 1, 7, 45, 46
Printing ......................... 1, 7, 45, 46
R
Reports ......... 16, 39, 40, 41, 42, 43
Field Selection Window ...........43
Run Saved Reports ..............37, 43
S
Screen Shots .............. 7, 10, 37, 45
SE...............................................49
Select
Calibration History...................13
Data ........................................42
LiDCO menu item....................13
T
Target Report.. 1, 16, 37, 41, 42, 43
Target Report Output ..................42
Trend window .. 4, 7, 21, 23, 24, 25,
37
U
Use
Overview Bar............. 1, 3, 21, 23
Zoom ................... 1, 3, 21, 23, 24
V
View
Calibration History.............13, 14
W
WYSIWYG ........................ 1, 45, 46
53
LiDCOview Pro V1.1 Users Manual
Z
54
Zoom Control Bar ......... 1, 3, 21, 24