1
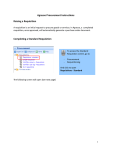
Fresh Component Health Provider Discards FATE007 Report Specification Fresh Component Health Provider Discard Report FATE007 Version Control Version Revision Date Revision Description 0.1 08 July 2013 Initial Draft. 0.2 18 July 2013 Updates after feedback from Pete Trubshaw. 0.3 27 July 2013 Incorporate Pete’s assumptions into BR 9 and 10. 0.4 29 July 2013 Incorporate the following from review with Sandra Cochrane: Section 1.1 - Amended matrix table; Section 2.2 – BR5d – If issued quantity is blank (ie. zero) and the discarded quantity is > issued quantity, then DAPI will be Not Applicable; Section 2.2 – BR6 – Remove “Unreceipted” status; Section 2.2 – BR8 – Expand more how the issue, transfer in, transfer out and discard dates are considered within reporting period; Section 2.3 – Include new mock-up of Section 1 table. Section 3.3 – Remove Neutral Threshold Indicator as a parameter. Global change. Section 3.4 – For Health Provider, added point that need to consider issue notes that are partially receipted; Section 3.4 – Remove the Neutral Indicator Threshold; Section 3.4 – Point 6 – added the new extra columns (transfer in qty, transfer out qty, net issued), and amended “Your peer group” to “Group”. Global change; Section 3.5 – Added the new extra columns and their corresponding totals as additional report items; Section 3.5 - Key indicator icons to have green or red. Remove yellow indicator icons. Global change. 0.5 01 August 2013 Incorporate Pete’s and Amit’s feedback: Section 2.2 - Added BR11 on averages rule; Section 3.3 – Remove default for Start and End date; Section 3.5 – Reword the calculations for Group, Group Average, State Average and National Average. Updated glossary. Peter reviewed and ensured his comments are incorporated. 0.6 Page 2 06 August 2013 Incorporate Pete’s feedback: Section 2.2 – Removed original BR5c and 6c in regards to if discard qty is blank, the cost and DAPI will also be blank; Section 2.2 - BR7 – Added “unreceipted”; Section 2.2 – BR9 – Change “take into account” to “include”; Section 2.2 – BR10a – Replace “effect” with “reduce”; Section 2.2 – BR10 – Incorporate “custom location” in the diagram; Glossary – Explain definition of custom location; Section 2.3 – Amended Table 2 diagram to incorporate the new layout of Net issues, Issues, Transfer In and Transfer Out Qty. Section 3.4 – Remove the “state” report output as the state average will be determined by the state of the selected health provider, not the selected state (ie. the state parameter could say All States); Section 3.4 – Point 3 – Change message to “There are no discards for this health provider for the period selected.”; Section 3.4 - Amended Table 2 diagram to incorporate the new layout of Net Fresh Component Health Provider Discard Report Version Revision Date FATE007 Revision Description issues, Issues, Transfer In and Transfer Out Qty; Section 3.4 – Point 5a.ii – Change the rule to say “net issued” and not “issued”; Section 3.4 – Point 5b.iii – Change to a list of discard groups, and not discard reasons; Section 3.4 – Point 5b.vi – Remove the first sentence as repeated in ii; and Section 3.5 – Provided a lower discard amount example, rather than a high discard amount example. 0.7 08 August 2013 Pete advised to explicitly state that the DAPI is based on the reporting period selected, whereas the Group, National and State averages are based on the last 12 months (for Table 1 – Summary). For Table 2, all report items’ values will be based on the reporting period. This has been now stated explicitly in Section 3.5 (in the description section and also within the table for the applicable report item’s description), and the glossary. 0.8 13 August 2013 Incorporate Sandra’s feedback: Section 2.2 – BR4 – Added Component Group column and change name of “Fresh Component Group description” to “Fresh Component Cost Group”. As a result of this change, did global updates where applicable to refer to Fresh Component Cost Group; Section 2.2 – BR9 – Provide example using Financial year dates; Section 2.2 – BR11 – Amend the rule on how average is calculated from using the last 12 whole months’ worth of data to the average calculated from the reporting period; Section 2.2 – Added new BR5a about how the Summary table will have an expand/collapse function to reveal/hide the fresh component groups/cost groups; Section 2.2 – Added BR5f – how certain counts for each group of fresh component cost group will be rolled up to produce a total count for its corresponding component group; Section 2.2 – BR12 – Added BRs to explain the Benchmark table; Section 3.2 – Update description for Summary table to describe the component groups can be expanded to reveal fresh component groups/cost groups. Added a note to be displayed as report content, that if the user wants to generate a st th financial year report, they will need to select 1 July to 30 June; Section 3.4 – 5ai – Added Fresh Component Group/Cost Groups to the list; Section 3.4 – 5aii – Added logic that if the fresh component group/cost group (child) is blank, then the component group (parent) will also be blank; Section 3.5 – Added component group and its description to the table; Section 3.5 – Amend fresh component to fresh component group/cost group and include description; Section 3.5 – Update description and calculations for Group, State and National Average; Section 3.5 – Add benchmark to “key indicator icon” report item; Section 3.6 – Amend the sort to “Fresh Component Cost Group”; Glossary – Added “component group”, “fresh component cost group”; and Glossary – Amend that the group, national and state average is based on the reporting period, and not the last 12 months. 0.9 14 August 2013 Incorporate Pete’s feedback. Section 2.2 – BR4ai – Removed the Fresh Component Cost Group Code of 7a, b, c, d and e from the table, as these ‘Other’ component group never appear in the Page 3 Fresh Component Health Provider Discard Report Version Revision Date FATE007 Revision Description fate reports due to no link between supplier component and fresh products, and there is no way to order these items in BloodNet; Section 2.2 – Removed BR5c. 0.10 16 August 2013 Section 2.3 - Mocked up new screen shot for Section 1 – Summary Table; Section 3.4, point 5a – Put new mocked up screen shot. Section 3.5 – For key indicator report item, in the calculation and source data column, rename “peer group” to “group average”. Incorporate Peter’s feedback. 0.11 22 August 2013 As requested by Sandra: Section 2.3 and 3.5 (5a) – Incorporate new report mock to show the new column “Discard Cost”; Section 3.5 (5ai) – Add Discard Cost in the list; Section 3.5 – Table 1 Summary – Added report item Discard Cost with its description and calculation; and Added Discard Cost in the Glossary. 0.12 23 August 2013 After meeting between Sandra, Peter, Pete and Ricky, agreed with the following changes: Section 2.2 – Remove BR4b (and the Detail Table); Section 2.2 – Remove BR6 in regards to detail table; Section 2.3 – Update report sample with new icons and replace reference of hospital name and state with generic names; Section 3.4 – Update report sample; Section 3.4 – Remove detailed table; Section 3.5 – Remove detailed table; Section 3.5 – Replaced the indicator icons for the key indicator icon report item; Section 3.6 – Remove Detail Sort Table; and Glossary – Update the key indicator icons. 0.13 23 August 2013 Pete incorporate source table in Section 3.5. Ricky made the following amendments: Section 3.5 – Reword the calculations for DAPI, Group and Group Average; provide updated calculation example for Group Average; and make reference to the Benchmark table; Global change to refer to correctly term Component Group and Cost Group (instead of referring as Fresh Component); and Global change to refer to Group and not Peer Group, where applicable. 1.0 28 August 2013 Peter approves report specification. 1.1 01 October 2013 Global change of Group average, State average, and National average to Group DAPI, State DAPI and National DAPI. Page 4 Fresh Component Health Provider Discard Report FATE007 Document Review and Approval Version Approval Date Name and Position Comments 1.0 28 August 2013 Peter O’Halloran Executive Director, Health Provider Engagement Approved after Sandra Cochrane’s final review. Creative Commons With the exception of any logos and registered trademarks, and where otherwise noted, all material presented in this document is licensed by the NBA under a Creative Commons Attribution 3.0 Australia (http://creativecommons.org/licenses/by/3.0/au/) licence. In essence this licence allows you to copy, communicate and adapt the work, as long as you attribute the work to the National Blood Authority and abide by the other licence terms. The details of the relevant licence conditions are available on the Creative Commons website (accessible using the links provided) as is the full legal code for the CC BY 3.0 AU licence (http://creativecommons.org/licenses/by/3.0/au/legalcode). The content obtained from this document or derivative of this work must be attributed as the National Blood Authority BloodNet Fresh Component Health Provider Discard Report Specification. Page 5 Fresh Component Health Provider Discard Report FATE007 Contents 1 2 3 4 Introduction .................................................................................................................................... 7 1.1 Purpose ................................................................................................................................... 7 1.2 Document Audience ............................................................................................................... 7 1.3 Related Documents ................................................................................................................. 8 Report Details ................................................................................................................................. 9 2.1 Description .............................................................................................................................. 9 2.2 Business Rules ......................................................................................................................... 9 2.3 Report Sample....................................................................................................................... 14 Report Content ............................................................................................................................. 15 3.1 Title ....................................................................................................................................... 15 3.2 Description ............................................................................................................................ 15 3.3 Parameter ............................................................................................................................. 16 3.4 Report Output Filter Criteria ................................................................................................. 17 3.5 Report Field Description/Calculations .................................................................................. 19 3.6 Report Output Fields Sorting ................................................................................................ 24 Glossary ......................................................................................................................................... 25 Page 6 Fresh Component Health Provider Discard Report 1 FATE007 Introduction 1.1 Purpose The purpose of this document is to describe the functional specification for the Fresh Component Health Provider Discards Report. The purpose of the Report is to provide discard values (cost and unit quantities) for fresh components over a given time period for a specific health provider. Below is a matrix which identifies which reporting system and by which audiences, the report can be generated. Reports Generated By BloodNet Reports Facility Administrators Report Subscriptions Facility User Jurisdictional Blood Committee Members Jurisdictional Blood Committee Proxies NBA Staff Jurisdictional Reporting NBA Internal Reports Blood Service Staff State/Territory Government Staff 1.2 Document Audience This document should be used by: The Architect - to ensure this report fit into the NBA framework and meets all the essential core design features and elements of NBA systems. The Database Administrator – to form the design of the BloodNet reports database. The Developers - to form the basis of the development of BloodNet reports. The System Tester - to create the system test plan and system test cases. The Systems Support Team – to develop an understanding of the BloodNet reports to support users. The Business Stakeholders - to confirm that their requirements have been properly understood and approve the report specification. The Project Manager - to obtain project requirements/design signoff from the stakeholders and to assist in detailed task estimation and refinement of the project schedule and milestones. Page 7 Fresh Component Health Provider Discard Report 1.3 Related Documents BloodNet Reporting Requirements; BloodNet Internal and External Reports; Report Register; BloodNet User Manual; and Jurisdictional Reports – Security Matrix SM.01 Functional Specification Page 8 FATE007 Fresh Component Health Provider Discard Report FATE007 2 Report Details 2.1 Description This report shows discard values (cost and unit quantities) for fresh components over a given time period for a specific Health Provider. The discard figures presented are also used to create the “Discard as a Percentage of Issue” (DAPI) so that health provider’s DAPI can be compared against the benchmark, group average, state average and national average. 2.2 Business Rules This report is based on the following rules: 1. The report is based on issues, transfers and discards recorded in BloodNet; 2. The report can be generated by the following users: a. Facility user using BloodNet; b. Facility administrator using BloodNet; c. JBC members and their proxies in Jurisdictional Reporting; d. NBA staff in the internal reporting; and e. Support team in managing subscription reports. 3. If this report is: a. Accessed through the BloodNet, there will be no state and health provider parameters available to the user. The state/health provider is set by BloodNet as the health provider that the user is logged in as/belongs to. This would be applicable to the listed users in BR2a and 2b. Page 9 b. Accessed through the jurisdictional reporting tool, then all parameters will be available. However, the ‘State’ values available to the jurisdictional users will be limited to their permissions on the jurisdictional application. Hence, the state will be pre-populated into the state parameter based on the permissions of the user. This would be applicable to the listed users in BR2c. c. Accessed as an NBA internal reporting or subscription report, then all parameters will be available. This would be applicable to the listed users in BR2d and 2e. Fresh Component Health Provider Discard Report FATE007 4. The Summary Table provides information regarding fresh component discards of the health provider. The user can compare their health provider’s DAPI to the state, national, group averages, and benchmark, and its relative performance is displayed by the indicator icons; i. The table below shows the relationship between the component group, fresh component group cost group code and the fresh component cost group description: Page 10 Component Group Fresh Component Cost Group Code Fresh Component Cost Group Description Whole Blood 1a Whole Blood Whole Blood 1b Whole Blood - Leucodepleted Red Cells 2a WB Red Cell Red Cells 2b WB Red Cell - Leucodepleted Red Cells 2c WB Red Cell - Buffy Coat Poor Red Cells 2d WB Paediatric Red Cell - Leucodepleted (1 of 4) Red Cells 2e WB Washed Red Cell Red Cells 2f WB Washed Red Cell - Leucodepleted Red Cells 2g Apheresis Red Cell - Leucodepleted Platelets 3a WB Platelet Platelets 3b WB Platelet - Leucodepleted Platelets 3c WB Platelet - Buffy Coat Poor Platelets 3d Apheresis Platelet - Leucodepleted Platelets 3e Paediatric Apheresis Platelet - Leucodepleted (1 of 4) Clinical Fresh Frozen Plasma 4a WB Clinical FFP - Standard Clinical Fresh Frozen Plasma 4b WB Clinical FFP - Buffy Coat Poor Clinical Fresh Frozen Plasma 4c Paediatric WB Clinical FFP (1 of 4) Clinical Fresh Frozen Plasma 4d Apheresis Clinical FFP Cryoprecipitate 5a WB Cryoprecipitate Cryoprecipitate 5b Apheresis Cryoprecipitate Fresh Component Health Provider Discard Report FATE007 Component Group Fresh Component Cost Group Code Fresh Component Cost Group Description Cryo-depleted Plasma 6a WB Cryo-depleted Plasma Cryo-depleted Plasma 6b Apheresis Cryo-depleted Plasma 5. For Summary Table, a. This report will display the component groups, and the user is able to expand/collapse each component group to reveal/hide its corresponding Cost Group1. Issues/Transfers/Discards/Discard Cost for all the Cost Groups are totalled for its corresponding Component Group. Benchmark is explicitly tied to Component Group, while the Group, State and National Averages are applicable to both the Component Group and the Fresh Component Cost Group. b. The report will only display Cost Group, if there are any issues, transfers or discards within the reporting period. If they are all blank, then do not display the Cost Group. c. DAPI rule - If the net issued quantity = 0 and the discarded quantity is > 0, then DAPI will be “N/A” (Not Applicable). 6. The report includes the following issue statuses: Receipted; and Unreceipted; Partially Receipted. The report excludes “Cancelled” issue notes. 7. The issues and discard figures in the report are based on these figures having issued date time, transfer in date, transfer out date and the discard date that falls within the reporting period. For example, say for a health provider, a quantity of Fresh Component Z was: Issued on 20th June 2012; Transferred on 30th June 2012 (as transfer in occurs at exactly the same date/time as the transfer out, both the transfer in and transfer out dates will be 30th June 2012); and Discarded on 12th July 2013. If the reporting period was set for 1st July 2013 to 30th June 2014, then only the quantity of fresh component discarded will be included, as this date falls within the reporting period. 1 An example of a Cost Group is “2a – WB Red Cells” (which is comprised of the Fresh Component Cost Group Code and Fresh Component Cost Group Description). Page 11 Fresh Component Health Provider Discard Report FATE007 8. When considering transfers, the report will include: a. Transfers Out of health providers to distribution sites and custom locations2 (as this reduces the stock levels of facilities); and b. Transfers In to health providers from another health provider. This report cannot report on any of the corresponding ‘Transfers In to’, and ‘Transfers Out from’ distribution sites and custom locations. Custom Location Blood Service Distribution Sites A Issue Health Provider A Transfer In/ Transfer Out Health Provider B Transfer Out (ie. recall by supplier) Order Blood Service Distribution Sites B 9. All averages (for Group, State and National) are calculated using the discard and the net issued data that is within the start and end date (ie. reporting period). For example, if the start date is set to 1st July 2013 and the end date is set to 30th June 2014, then the averages are calculated using these dates (refer to Section 3.5 – calculations column). 2 This is a location that was entered by a BloodNet user using the free text box entry when performing a transfer in BloodNet. Page 12 Fresh Component Health Provider Discard Report FATE007 10. Below is the benchmark table, which will determine the benchmark value in the Section 1 – Summary Table: 3 a. All the full year targets numbers (in the benchmark table above) are based on a one year’s (12 months’) worth of data; b. The year is based on the financial year (ie. 2013-14 implies July 1st 2013 to June 30th 2014); c. The Units (ie. Net issued qty) are based on a full year period (365 days), but pro-rata on a daily basis depending on the reporting period (ie. the number of days (inclusive) between start and end date). For example, if the reporting period is from 1st July 2014 to 5th July 2014, and we are looking at red blood cells for a super group, then the number of units issued will be 137 for the reporting period of 5 days ((10,000 units x 5 days)/365 days)); d. The benchmark percentage will populate the applicable cells in the Summary Table, depending on which Component Group, Group, and Start Date3. The Benchmark percentage is fixed (ie. is not pro rata based on the reporting period like the Units). For example, a “Red Cell” Component Group for a “Super” Group where the reporting period is from 1st May 2015 to 18th July 2015, will have a start date of 1st May 2015 which corresponds to the 2014-15 column. Matching this for the Red Cell Component Group and Super Group, means that the benchmark will be 3.0%. e. If the group is exempt, then there are no benchmarks. Note that it is the Start Date parameter that sets the comparison with the specific benchmark financial year. Page 13 Fresh Component Health Provider Discard Report 2.3 Report Sample Below is a mock sample of the Fresh Component Health Provider Discards Report. Summary Table Page 14 FATE007 Fresh Component Health Provider Discard Report FATE007 3 Report Content 3.1 Title The report title is: Fresh Component Health Provider Discards. The report ID is: FATE007. This report title name will be seen consistently on the external site and also within the report. 3.2 Description The following report description will display (ie. on the Report page within the BloodNet Information Module – located under the report title) and also within the report: “This report shows discards of fresh components over a given time for the selected health provider. The net issued and discard figures are used to calculate the Discard as a Percentage of Issue (DAPI) so the health provider’s DAPI can be compared against the benchmark, group, state and national DAPIs , with relative performance displayed by the indicator icons. This report displays component groups (ie. Red Cells) which can be expanded to reveal corresponding cost groups (ie. 2a – WB Red Cell, 2b - WB Red Cell - Buffy Coat Poor, etc).” Page 15 Fresh Component Health Provider Discard Report FATE007 3.3 Parameter The following parameters may be available, pending where this report is accessed from as per Business rule 3 (refer to Section 2.2, BR3): Name Mandatory Description Control Type Values/Value List Default Value State Yes The state will filter all the applicable health providers that will be considered for the selected state(s). Drop down All States ACT NSW NT QLD SA TAS VIC WA All States Health Provider Yes The selected health provider determines all the fresh components that are issued/discarded by the selected health provider. Drop down (Select All) A list of all the current health providers filtered by the State selected. <Select a Value> Start Date Yes The starting date of the range for the report (inclusive). Date Picker Any valid date <Select a Value> End Date Yes The end date of the range for the report (inclusive) Date Picker Any valid date <Select a Value> Page 16 Fresh Component Health Provider Discard Report FATE007 3.4 Report Output Filter Criteria The report output is filtered on the following conditions: Name Filter Criteria Health Provider Health Provider relates to the value(s) selected in the Health Provider parameter. The selected health provider is displayed in the report parameters listing (under the report header). Start Date and End Date Count the issue and discard quantities that have an issue date/transfer date/discard date that falls within the start and end date (both inclusive) of the reporting period. The ‘Start Date’ and ‘End Date’ selected will be displayed in the report header (under the report header). The following rules apply on the report outputs: 1. Display Title (Section 3.1) in the report header (right hand side) and the footer (ie. ‘BloodNet: Report ID - Report Title’). 2. Display Description (Section 3.2) between the report title/state and the table (ie. below the report header). 3. Where the selected query criteria returns no results, a message is displayed (as per below): “There are no discards for this health provider for the period selected.” 4. If there are multiple pages, ensure that the NBA logo, report title, report parameters and column headings are displayed on all pages. 5. There are two sections for this report: a. Summary Table Page 17 Fresh Component Health Provider Discard Report i. For each Component Group (row) and its corresponding Cost Groups (expanded rows), there will be the following information (columns): Issued Qty; Transfer In Qty; Transfer Out Qty; Net Issued (Issued Qty + Transfer In – Transfer Out); Discard Qty; Discard Cost; Group; DAPI; Benchmark; Group DAPI; State DAPI; and National DAPI. ii. Page 18 FATE007 Where there are no net issued and discard quantity counts for a specific cost group, then do not display that specific cost group row. Where all the cost groups are not displayed for a component group, this means that this component group will also not display. Fresh Component Health Provider Discard Report FATE007 3.5 Report Field Description/Calculations The Summary Table provides summary information regarding discards of the Health Provider to quantify DAPI values, KPI indicators for state, national and group averages. Note that as per BR9 (in Section 2.2), the DAPI values, group, state and national averages will be calculated based on the reporting period. This table contain the following columns, rows and related data: Calculations are included where applicable. Summary Table Report Item Grouping Level Description Component Group 1 The description of a fresh component at a high level (ie. whole blood, red cell, platelet, clinical fresh frozen plasma, cryoprecipitate, cryodepleted plasma, and other. BloodNet_Reporting.db o.ComponentGroup.Co mponentGroupName Cost Group 2 The description of a cost group at a (detailed) low level (ie. 2b - WB Red Cell – Leucodepleted, 2c - WB Red Cell – Buffy Coat Poor). ComponentCostGroup. GroupingCode Issued Qty The number of units issued by the Blood Service Distribution Centre. Note: Issued Qty does not take into account of transfers in/out quantities. ConsignmentNoteLine.Q ty Transfer In Qty The number of units transferred into the selected Health Provider from other Health Providers. ConsignmentNoteLine.Q ty Transfer Out Qty The number of units transferred out of the selected Health Provider to other Health Providers/Blood Service Distribution Centre or ConsignmentNoteLine.Q ty Page 19 Calculation Source Data + ComponentCostGroup. Description Fresh Component Health Provider Discard Report Report Item Grouping Level Description FATE007 Calculation Source Data Net Issued = Issues + Transfers IN – Transfers OUT Calculated using fields above Custom Locations Net Issued The number of units issued taking into account of the transfers in/out quantities. Discard Qty The number of units discarded by the Health Provider. Discard Cost The cost of discard for each cost group; or the total cost of discards for a component group (ie. sum of all the discard costs for all cost groups). ConsignmentNoteLine.Q ty Discard Cost for each Cost group: Discard Qty x Unit Cost ComponentUnitCost.Pu blishedPrice Discard Cost for Component group: ∑ ( Discard Cost) for all Cost groups for this particular Component. Note: The unit cost is based on the cost at the time the component/cost group is issued, not when it is discarded. DAPI The number of Discards As a Percentage of Issued (DAPI) for the Health Provider. This is based on the reporting period. DAPI for Component group: ∑ ( DiscardQty ) / ∑ (Net IssuedQty) x 100 Benchmark The benchmark is set by NBA annually. There is a benchmark table that can be updated easily. Refer to Section 2.2, BR10. Reference. ComponentGroupPeerB enchmark.BenchmarkPe rcent Group The health provider is categorised into groups depending on the number of fresh components issued to them. This category will be used to group health providers together and will determine the group average. Groups of a health provider are determined by the total units issued to a health provider over the reporting period. Please refer to the Benchmark Table in Section 2.2 BR10) for the Groups and their limits based on “net issued” Reference. ComponentGroupPeer. PeerGroup Group Average Any Health Provider that has a matching group and matching fresh component (ie. belongs [Average of ∑ (DiscardQty) / Average of ∑ (NetIssuedQty)] x 100 Page 20 DAPI for each Cost group: ( DiscardQty ) / (Net IssuedQty) x 100 Fresh Component Health Provider Discard Report Report Item Grouping Level FATE007 Description Calculation to a large group, and for component group (ie. all 2’s (Red Cells), 3’s (Platelets), etc, will have its discard and net issue quantities counted towards the group average. This is based on the reporting period. Filter: Component & Facility.PeerGroupId = @PeerGroupId Note that the same logic apply for the cost group. For a specific fresh component, obtain a list of all health providers’ net issued and discard quantities. Then from this list, filter out all the health provider that has a net issued quantity that is between the limits stated in the Benchmark Table (Section 2.2, BR10). For example, for a Red Blood Cell, the limits are: 0 to 499 – Exempt; 500 to 2,499 - small; 2,500 to 4,999 - medium; 5,000 to 9,999 - large; >=10.000 - super. If there are 5 health providers that have net issued quantities of 500, 550, 1000, 2000, and 2499 (ie. all in the small group), and their corresponding discard quantities are 1, 2, 3, 4, and 5 , then these health providers would be filtered to determine the group average for this specific fresh component and for a small group. Hence sum the net issued quantities and divide by 5 health providers to obtain the “sum net issued average” (ie. (500 + 550 + 1000 + 2000 + 2499)/5 = 1310) and sum the discard quantities and divide by 5 health providers to obtain the “sum discard average” ((1 + 2 + 3 + 4 + 5)/5 = 3). Then divide the sum discard average by the sum net issued average, multiply by 100 (ie. 3/1310 x 100 = 0.23%). 0.23% will then be the group Page 21 Source Data Fresh Component Health Provider Discard Report Report Item Grouping Level Description FATE007 Calculation average for a small group, and for this specific fresh component. Note that the same logic apply for the cost group. State Average Any Health Provider that belongs to the same state as the selected Health Provider and matching fresh component, will have its discard and net issue quantities counted towards the state average. This is based on the reporting period. Note that the same logic apply for the cost group. [Average of ∑ (DiscardQty) / Average of ∑ (NetIssuedQty)] x 100 Filter: Component & Facility.State = @State The state average will be fresh component specific and state specific. For a specific fresh component and state, obtain a list of health provider’s net issued and discard quantities. Sum all the net issued quantities, and divide by the number of health providers to obtain the sum net issued average. Sum all the discard quantities, and divide by the number of health providers to obtain the sum discard average. Then divide the sum discard average by the sum net issued average, multiply by 100. This will give you the State Average. Note that the same logic apply for the cost group. National Average Page 22 All Health Providers that has matching fresh component will have its discard and net issue quantities counted towards the national average. This is based on the reporting period. [Average of ∑ (DiscardQty) / Average of ∑ (NetIssuedQty)] x 100 Note that the same logic For a specific fresh component, obtain a list of all the health Filter: None. Calculated Australia wide The national average will be fresh component specific only. Source Data Fresh Component Health Provider Discard Report Report Item Grouping Level FATE007 Description Calculation apply for the cost group. provider’s net issued and discard quantities. Sum all the net issued quantities, and divide by the number of health providers to obtain the sum net issued average. Sum all the discard quantities, and divide by the number of health providers to obtain the sum discard average. Then divide the sum discard average by the sum net issued average, multiply by 100. This will give you the National Average. Note that the same logic apply for the cost group. Key indicator icon The indicators highlight how the selected Health Provider compares to Group average, State average, National average and Benchmark. Page 23 Green Indicator – Health Provider’s DAPI is performing better or equal when compared to group average, state average, national average and/or benchmark. Red Indicator – Health Provider’s DAPI is performing worse when compared to group average, state average, national average and/or benchmark. [Your DAPI] =< [Group DAPI] [Your DAPI] > [Group DAPI] [ Your DAPI] =< [State DAPI] [Your DAPI] > [State DAPI] [Your DAPI] =< [NationalDAPI] [Your DAPI] > [NationalDAPI] [Your DAPI] =< [Benchmark] [Your DAPI] > [Benchmark] Source Data Fresh Component Health Provider Discard Report FATE007 3.6 Report Output Fields Sorting The report output is sorted as below: Summary Table Column Name Sort Direction Totals Fresh Component Sorted based on the National Supply Budget Plan and Blood Grouping. Will be sorted based on the Component Group order as per the table shown in Section 2.2, BR4i. The Cost Groups within each Component group (ie. 1a, 1b, 2a, 2b, 2c, etc) will be sorted in ascending order). N/A Page 24 Fresh Component Health Provider Discard Report FATE007 4 Glossary Term AHP Definition Approved Health Provider, normally referred to as a ‘Health Provider’. Also known as facility. Benchmark The level set as the comparison between hospitals that are categorized in the same group. Component Group This is the higher level description of the Fresh Component Group. Examples of Component Groups are: Whole Blood, Red Cell, Platelet, Clinical Fresh Frozen Plasma, Cryoprecipitate, Cryo-depleted plasma, and Other. Cost The cost of the quantity discarded for each component/manufactured product (ie. cost = unit price x quantity discarded). Cost Group When you combine Fresh Component Cost Group Code and Fresh Component Cost Group description together (ie. 2a – WB Red Cell). Custom Location This is a location that was entered by a BloodNet user using the free text box entry when performing a transfer in BloodNet. DAPI Discard as a Percentage of Net Issue. This is based on the reporting period. Discard cost The cost of discard for each cost group; or the total cost of discards for a component group (ie. sum of all the discard costs for all cost groups). Discard quantity The number of units of blood and blood products that are discarded. Facility Also known as an Approved Health Provider (AHP) of Health Provider. It should be noted that each Facility has a unique AHP code and in some instances, one large hospital may have multiple facilities (ie. Pathology facility, Pharmacy facility, Oncology facility), and all these facilities will have its own unique AHP code. Facility user General users of BloodNet to order, receive and fate blood and blood products. Facility administrator Users of BloodNet with administrator rights which gives the ability to approve users, change templates and add new items. Once approved facility administrators will also be automatically granted facility user access to the facility indicated. Facility administrator can be a lab manager, scientist in charge (SIC) or second in change (2IC). Fresh Component Cost Group Code This is the 2 alphanumeric code that corresponds to a Fresh Component Group. Examples of Fresh Component Cost Groups include: 1a, 1b, 2a, 2b, 2c etc Fresh Component Cost Group Description Also known as Components. Also, commonly referred to as Fresh Blood Products within the blood Page 25 Fresh Component Health Provider Discard Report FATE007 Term Definition sector. The components referred to in this report are issued fresh components, not ordered products. Some of the examples are: Whole Blood; Whole Blood – Leucodepleted; WB Red Cell; WB Red Cell – Leucodepleted; WB Red Cell - Buffy Coat Poor; WB Paediatric Red Cell - Leucodepleted (1 of 4) etc. Group The health provider is categorised into groups depending on their size and the number of fresh components and manufactured products issued to them. This category will be used to group health providers of similar size together to allow comparison. Group Average The discard average rate across the same group. Any Health Provider that has a matching group and matching fresh component (ie. belongs to a large group, and for specific “2b – WB Red Cell – Leucodepleted” fresh component), will have its discard and net issue quantities counted towards the group average. This is based on the reporting period. Health Provider A health provider is an individual or an institution that provides preventive, curative, promotional, or rehabilitative health care services in a systematic way to individuals, families or communities. Please refer to AHP. Also known as facility. Issue note An issue note is sent out with the order to the Health Provider. The issue note will contain information like the issue number, the date time of the issue, which blood service made the issue, the issued quantity, total issue price and a link to the order number. Issue note can have different statuses such as active, completed (when the issue note is 100% receipted) and cancelled. Issued quantity The number of units issued by the Blood Service Distribution Centre. Key indicator icon The indicators highlight how the selected Health Provider compares to Group average, State average, National average and Benchmark. Green Indicator – Health Provider’s DAPI is performing better or equal when compared to group average, state average, national average and/or benchmark. Red Indicator – Health Provider’s DAPI is performing worse when compared to group average, state average, national average and/or benchmark. Modifier Changes or additions to the original Fresh Component. Examples include Irradiated, Washed or Phenotyped. National Average The average discard rate nationally. All Health Providers that has matching fresh component, will have its discard and net issue quantities counted towards the national average. This is based on the reporting period. Page 26 Fresh Component Health Provider Discard Report FATE007 Term NBA Definition National Blood Authority Null Blank. No data. State Average The average discard rate across the state/territory. Any Health Provider that belongs to the same state as the selected Health Provider and matching fresh component, will have its discard and net issue quantities counted towards the state average. This is based on the reporting period. Page 27