1
overload issue 71 february 2006
Dead Code
by Tim Penhey
Dead code comes in many forms, and appears in most projects at
some time or another. A general definition of dead code would be
“code that is unreachable”. This may be due to a function never
being called, or it may be control paths within a function never
being accessible. This article deals with the former.
Functions that are never called happen at two phases during the
code’s lifecycle: brand new code that is yet to be hooked into an
existing framework; or refactoring of some code that removes calls
to other functions.
Often in the refactoring of code, functions that are no longer
called are left alone as they might still be called from somewhere.
This is often the case on larger projects where individuals do not
know the entire codebase.
Another reason functions are not deleted is the idea that “it might
be useful later”, an extension of the hoarder’s mentality.
This leads on to an interesting question: How do you know when
a function is no longer called? The problem really presents itself
when looking at shared object libraries. The normal approach is that
an exported function is intended to be called from some other
library or executable, however, in many cases there are exported
functions that are only ever called from inside the library. Just
because a function is exported, does that mean it should be kept?
In order to look at shared object libraries, you need also look at all
the code that uses that shared object library.
Once you have identified that your code base has dead code in
it, why remove it? Probably the biggest factor is to aid the
programmers in their understanding. There is no point in spending
time reading and understanding code that is never called. Another
major factor is having less clutter and cleaner code. This leads to
identifying areas for refactoring, which often leads to better
abstractions. A minor benefit is speeding up the compile and link
time and reducing the size of the libraries and executables.
There are tools available that will do a coverage analysis of the
source code. The tool watches the code as it is being executed and
will identify parts of the code that are never reached. An advantage
of this is that it can also identify unreached code paths in called
functions. The disadvantage is the need for either automated or
manual testing. If using automated testing, then the tests need to
cover all the required use cases, which in itself is hard to do much
of the time due to “fluffy”, incorrect, or outdated requirements. It
is also often hard to “retrofit” on to a large code base. The
alternative is manual testing, which means someone sitting in front
of the application doing all it can do. Manual testing is probably
more error prone than even limited automated testing. If the tests,
manual or automated, don’t fully cover the actual use cases then it
is possible that required code is incorrectly identified as unused.
The impetus behind my looking into this issue was the code base
at a previous contract. There was somewhere in the vicinity of two
million lines of code and of those it was estimated that somewhere
between 20 and 40% is no longer used anywhere. The code was
built into approximately 50 shared object libraries and 20
executables. There were only limited regression tests and no user
knew everything that the system was supposed to do, which led to
the idea of trying to create some tool that would analyse the libraries
and executables themselves.
The general approach was to process each of the shared object
libraries and extract a list of exported functions to match up with
the undefined functions from the shared object libraries and
executables – the theory being that whatever was exported and not
called was “dead code”.
The tools that were chosen for the job were from GNU Binutils
[1]: nm, c++filt, and readelf. Primarily because all the code
was compiled with g++.
In order to tie nm, c++filt and readelf together, some glue
was needed – I chose python.
GNU nm lists the symbols from object files. It can also extract
the symbols from shared object libraries and executables. nm is
capable of giving much more information than is needed for
simple function usage. The parameters --defined-only and
--undefined-only were used to reduce the results. These were
then parsed using regular expressions to extract the mangled
name.
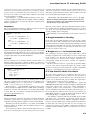
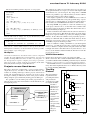
To illustrate we have the following source for a shared object
library:
--- start shared.hpp
#ifndef DEAD_CODE_SHARED_H
#define DEAD_CODE_SHARED_H
#include <string>
void exported_func(std::string const& param);
void unused_func(std::string const& param);
#endif
--- end shared.hpp
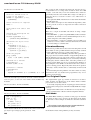
--- start shared.cpp
#include "shared.hpp"
#include <iostream>
void internal_func(std::string const& param)
{
std::cout << "internal called with "
<< param << "\n";
}
void exported_func(std::string const& param)
{
std::cout << "exported_called\n";
internal_func(param);
}
void unused_func(std::string const& param)
{
std::cout << "never called\n";
}
--- end shared.cpp
g++ -shared -o libshared.so shared.cpp
tim@spike:~/accu/overload/dead-code$
nm --defined-only libshared.so
00001bd8 A __bss_start
00000740 t call_gmon_start
00001bd8 b completed.4463
00001ac4 d __CTOR_END__
00001abc d __CTOR_LIST__
00000920 t __do_global_ctors_aux
00000770 t __do_global_dtors_aux
00001bd0 d __dso_handle
00001acc d __DTOR_END__
13