1
Sample mounting
14. Select the Instrument Settings tab, double click an item, select the Position tab, set all
positions to either 0o or 0 mm. Press the Apply button to move the stage.
15. Remove the sample holder by rotating until it releases.
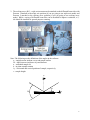
16. Mount the sample as flat as possible on the stage with double sided tape or spring clips for
large wafer samples. If the sample is larger than 5 mm, mount the long axis of the sample
along the beam direction (i.e. horizontal, x-direction). If the sample is less than 5 mm, mount
the long axis azimuthally to the beam direction (i.e. vertical, y-direction). These alignments
will assist in providing the lowest background noise and maximizing signal strength.
17. Load the sample holder into the system.
Checking the zero position and direct beam intensity
18. Go to the Measure menu and select Manual Scan.
19. The Manual Scan window will appear. Enter into the following fields: Scan Axis: 2theta,
Scan Mode: Continuous, Range: 2.0o, Step Size: 0.005 , and Time per Step: 0.1 s. Press the
Start button to begin the scan.
20. After the scan is finished, right mouse click on the graph and select Peak Mode.
21. To accept the location of the peak, press the Move To button and then select OK. To select a
different position of the peak, press Cancel, right mouse click on the graph, and select Move
Mode. This will move the goniometer to the user defined position.
22. Once the correct position of the detector is found, click on the Tools menu and select Sample
Offsets. Set 2theta = 0.0o and select OK button. This will correct for the zero position and
make the current 2θ value 0.0o.
4