1
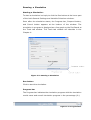
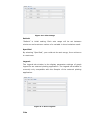
“Title” check box is checked as default setting. It is to display the graph
legend of the simulation result.
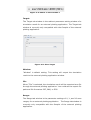
Default
“Default” is initial setting. Each axis has no name to display.
Specified
By selecting “Specified”, you could set the axis name to display in the
simulation result.
Plotting a Simulation Result with an External
Plotting Application
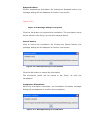
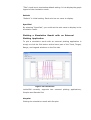
To plot a simulation result with an external plotting application is
simply to click the Plot button at the lower part of the Track, Target,
Range, and Legend windows on the Plot tab.
Figure 4-8: Plot Board
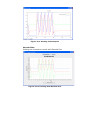
insilcoSIM currently supports two external plotting applications,
Gnuplot and Garuda Plot.
Gnuplot:
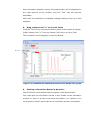
Plotting the simulation result with Gnuplot.
21