1
nomad
User Manual
version 2.3
Oghmasys IT Services GmbH Proprietary
This document contains proprietary information of Oghmasys IT Services GmbH and is not to be disclosed or used
except in accordance with applicable agreements.
BIG VIENNA and Business Intelligence Group Vienna Lucent are registered trademarks of Oghmasys IT Services GmbH.
All other trademarks are the property of their respective owners.
Copyright © 2012, Oghmasys IT Services GmbH. All rights reserved.
http://www.big-vienna.com
Disclaimer
Information in this document is provided in connection with Oghmasys/BIG VIENNA products. No license, express or
implied, to any intellectual property rights is granted by this document. Except as provided in Oghmasys/BIG
VIENNA's Terms and Conditions of Sale for such products, Oghmasys assumes no liability whatsoever, and Oghmasys
disclaims any express or implied warranty, relating to sale and/or use of Oghmasys products including liability or
warranties relating to fitness for a particular purpose, merchantability, or infringement of any patent, copyright or
other intellectual property right. The warranties provided for Oghmasys/BIG VIENNA products, if any, are set forth in
contractual documentation entered into by Alcatel-Lucent and its customers.
Oghmasys/BIG VIENNA products are intended for commercial uses and they must not be sold, licensed or otherwise
distributed for use in any hazardous environments requiring fail-safe performance, such as in the operation of nuclear
facilities, aircraft navigation or communication systems, air traffic control, direct life-support machines, or weapons
systems, in which the failure of products could lead directly to death, personal injury, or severe physical or
environmental damage. The customer hereby agrees that the use, sale, license or other distribution of the products
for any such application without the prior written consent of Oghmasys/BIG VIENNA, shall be at the customer's sole
risk. The customer hereby agrees to defend and hold Alcatel-Lucent harmless from any claims for loss, cost, damage,
expense or liability that may arise out of or in connection with the use, sale, license or other distribution of the
products in such applications.
Oghmasys assumes no responsibility for the accuracy of the information presented, which is subject to change
without notice.
2
All rights reserved. Passing on and copying of this document, use and communication of its contents is not permitted
without prior consent of Oghmasys IT Services GmbH
Oghmasys IT Services GmbH, Gentzgasse 72/27, 1180 Vienna
UID: ATU62104403
Registered no. FN 268554 h
Table of Contents
Introduction
Preface
Measurements, Conventions and Abbreviations
1. Hardware Requirements
Demo Versions & Small Networks
Production Servers
Network up to 1000 Managed Elements
Network up to 3000 Managed Elements
Network up to 6000 Managed Elements
2. nomad Data Integration
Concept
Data Structure
Groups and Schedules
3. nomad User Interface
Login to nomad
General Architecture
Controls
Main Menu
Modules
nomad Modules menu
Administration
Reports
Grids
Pagination
Sorting
Column Hiding
Filtering
Selection
Export
Time Series Charts
Pie Charts
nomad Pie Chart example
Map
4. nomad Administration
Administration
nomad Administration menu
Data Integration
Locations
Servers
Managed Elements
Add and delete Managed Elements
Ping Managed Element
Remove Managed Elements from Groups
Managed Elements Groups
Display Managed Elements Groups
3
All rights reserved. Passing on and copying of this document, use and communication of its contents is not permitted
without prior consent of Oghmasys IT Services GmbH
Oghmasys IT Services GmbH, Gentzgasse 72/27, 1180 Vienna
UID: ATU62104403
Registered no. FN 268554 h
Process Manager
Network Schedule Types
Network Inventory
NMS Synchronization
Performance Schedules
TSL/RSL Schedule
Ethernet Tx Schedule
G.826 History Schedule
Creation of data collection schedules
Schedule Actions
NOMAD System Management
Ping IP Address
License Upload
Time Zone
Network Interface Configuration
5. nomad Modules & Reports
Microwave Networks
M001 - Representation & Topology Discovery
Description
Supported Equipment
Reports
M002 - Radio Inventory
Description
Supported Equipment
Reports
M003 - Tx, Rx Power Monitoring
Description
Supported Equipment
Reports
TSL/RSL Multi-Link Report
TSL/RSL Single-Link Report
M004 - Capacity & Ethernet Usage
Description
Supported Equipment
Reports
Capacity Dashboard Multi-Link Report
Capacity Dashboard Single-Link Report
Ethernet Multi-Link Report
Ethernet Single-Link Report
M005 - G.826 Performance Monitoring
Description
Supported Equipment
Report
G.826 Multi-Link Report
M008 - Adaptive Modulation
Description
Supported Equipment
Reports
Adaptive Modulation Multi-Link Report
M009 - Hardware Inventory
Description
4
All rights reserved. Passing on and copying of this document, use and communication of its contents is not permitted
without prior consent of Oghmasys IT Services GmbH
Oghmasys IT Services GmbH, Gentzgasse 72/27, 1180 Vienna
UID: ATU62104403
Registered no. FN 268554 h
Supported Equipment
Report
5
All rights reserved. Passing on and copying of this document, use and communication of its contents is not permitted
without prior consent of Oghmasys IT Services GmbH
Oghmasys IT Services GmbH, Gentzgasse 72/27, 1180 Vienna
UID: ATU62104403
Registered no. FN 268554 h
Introduction
nomad is an agile network intelligence application used to maximize backhaul network utilization, to
achieve cost and time savings throughout the network life-cycle. Its layers of complex coding and
algorithms collect and analyze network data from multiple technologies/equipment in real-time. nomad
uses this data to generate easily-digestible, measurable and actionable information and KPIs, to reveal
network inefficiencies and allow quick troubleshooting. Its architecture makes it cost-effective, easy to
deploy and scalable.
nomad is designed to be intuitive and easy-to-use. This User Manual explains important concepts, menus,
dashboards and configuration options to allow you to get maximum use out of the application from the go.
6
All rights reserved. Passing on and copying of this document, use and communication of its contents is not permitted
without prior consent of Oghmasys IT Services GmbH
Oghmasys IT Services GmbH, Gentzgasse 72/27, 1180 Vienna
UID: ATU62104403
Registered no. FN 268554 h
Preface
This User Manual is intended for network operators, administrators and managers, providing detailed
information and graphics, designed to give the user complete knowledge about nomad's structure,
components and interfaces.
●
●
●
Network concepts and conventions
Network equipment types
Data communication network (DCN)
This User Manual allows users to achieve the following:
● Understand the data structure
● Use administration functions to configure the data collection, configure the network inventory and
system management
● Use the nomad interface to configure and display various network data and reports for the
different modules
This User Manual is laid out sequentially, mirroring the processes a user would usually do with nomad,
from start to finish. The exception here is the 'modules' chapter, which lists all available nomad modules.
Not all of these modules may be installed on the user's nomad instance.
Chapter 1 lists the recommended hardware configuration, depending on the type of installation and the
size of the user network and can be used as a guide for scalability.
Chapter 2 introduces the Data Integration concept, needed to understand the way data is retrieved and
displayed within nomad.
Chapter 3 shows how to use the nomad interface, addressing how to log-in and log-out, the general
architecture and components and how to display and handle the number of different reports nomad
produces.
Chapter 4 addresses the administrative side of nomad, giving details on how to collect the network
inventory, integrate new data sources, configure the data collection and manage different schedule
processes and configure system server settings.
Chapter 5 gives a detailed breakdown of each module available within nomad, providing a description,
supported equipment list and the various reports specific to each module.
It is recommended to read every chapter of this User Manual before beginning to use nomad so that the
user has complete control and confidence in what they are doing, to understand the information shown
and to reduce the risk of any adverse events. Some data in nomad, once changed, cannot be unchanged.
To navigate to specific chapters or sections within this user guide, users can click on the appropriate link
within the Contents pages. It is also possible to search within the document to find specific information.
7
All rights reserved. Passing on and copying of this document, use and communication of its contents is not permitted
without prior consent of Oghmasys IT Services GmbH
Oghmasys IT Services GmbH, Gentzgasse 72/27, 1180 Vienna
UID: ATU62104403
Registered no. FN 268554 h
Measurements, Conventions and Abbreviations
A number of conventions are used in nomad, these are explained below:
KHz - Gigahertz
Used to measure such parameters as frequency
GHz - Gigahertz
Used to measure such parameters as frequency band
kbps - kilobits per second
Used to measure such parameters as link capacity
dBm- decibel milliwatt
Used to measure such parameters as signal level
Aggregation functions:
● MIN - Minimum: corresponds to the lowest value in a dataset
●
MAX - Maximum: corresponds to the highest value in a dataset
●
AVG - Average: corresponds to the average value in a dataset
●
SUM - Sum: corresponds to the sum of all values in a dataset
Coordinates
The longitude and latitude coordinates must be in the format ‘EPSG:4326’ so the sites can be properly
displayed in the map.
Local and Remote Ports
Topological link names are built as a concatenation of each end port’s name as follows: Local-Remote.
"Local" corresponds to the port on the left-side of the link name, also called near-end. “Local” is
sometimes referred to as “A” in grids and charts.
"Remote" corresponds to the port on the right-side of the link name, also called far-end. “Remote” is
sometimes referred to as “Z” in grids and charts.
8
All rights reserved. Passing on and copying of this document, use and communication of its contents is not permitted
without prior consent of Oghmasys IT Services GmbH
Oghmasys IT Services GmbH, Gentzgasse 72/27, 1180 Vienna
UID: ATU62104403
Registered no. FN 268554 h
1. Hardware Requirements
Demo Versions & Small Networks
For demo versions, running with less than 250 managed elements, a simple laptop/desktop is enough.
The following configuration is recommended:
1 CPUs (x86_64, Quad Core, >= 2,5 GHz)
RAM >= 4 GB
Disks: min. 20GB total usable space
>= 1x Gbit-Ethernet
Operating System: Windows 7 64-bit or Linux
Production Servers
For production, we recommend professional racked hardware.
Network up to 1000 Managed Elements
1 CPUs (x86_64, Quad Core, >= 2,5 GHz)
RAM >= 8 GB
Professional hardware raid controller with RAID5 support and battery backed cache
Disks: min. 200GB total usable space with RAID5, fast access rates
>= 1x Gbit-Ethernet
Operating System: Linux
Network up to 3000 Managed Elements
2 CPUs (x86_64, Quad Core, >= 2,5 GHz)
RAM >= 12 GB
Professional hardware raid controller with RAID5 support and battery backed cache
Disks: min. 500GB total usable space with RAID5, fast access rates
>= 1x Gbit-Ethernet (or more depending on IP configuration)
Operating System: Linux
Network up to 6000 Managed Elements
2 CPUs (x86_64, Quad Core, >= 2,5 GHz)
RAM >= 24 GB
Professional hardware raid controller with RAID5 support and battery backed cache
Disks: min 1TB total usable space with RAID5, fast access rates
>= 2x Gbit-Ethernet (or more depending on IP configuration)
Operating System: Linux
9
All rights reserved. Passing on and copying of this document, use and communication of its contents is not permitted
without prior consent of Oghmasys IT Services GmbH
Oghmasys IT Services GmbH, Gentzgasse 72/27, 1180 Vienna
UID: ATU62104403
Registered no. FN 268554 h
2. nomad Data Integration
Concept
Data Structure
nomad uses a generic data structure in order to store network-related data. This data structure implies
that the following information is initially set in nomad:
At least one site/location
At least one network manager (i.e. NMS - Software). Even if there is no NMS in the network, one
has to be declared in order to match nomad’s data structure (nomad can be declared as NMS).
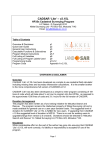
The following figure represents nomad’s data structure:
10
All rights reserved. Passing on and copying of this document, use and communication of its contents is not permitted
without prior consent of Oghmasys IT Services GmbH
Oghmasys IT Services GmbH, Gentzgasse 72/27, 1180 Vienna
UID: ATU62104403
Registered no. FN 268554 h
nomad Data Structure
A Location represents a Geographical Site.
A Server is the physical machine on which the NMS Software is installed. It also has an IP Address
and is located in a Location.
Software manages Managed Elements. It‘s installed on a Server. (i.e. NMS)
A Managed Element is managed by a Software and located in a Location.
A Board is inserted on a network element and contains Ports. Please note that for equipment
without boards, "virtual" boards are created automatically in nomad .
A Port or PTP is present on a board. This can be an Ethernet port, an E1 port, radio port, etc.
Topological Links (i.e. microwave radio links, SDH physical connections, etc) are linking two ports.
Performance and Inventory Data is retrieved or measured on a port or PTP.
Groups and Schedules
nomad data collection architecture is designed to handle the collection of large amounts of data in large
networks. The data is retrieved through the data communication network (DCN) which has a limited and
variable bandwidth. In order to keep within the DCN bandwidth constraints nomad data collection is
sectioned in schedules, each collecting a certain type of data (i.e. inventory, performance) for a definite
group of managed elements.
According to the DCN topology, groups and schedules can be defined to provide the best data collection
out of the available DCN bandwidth.
Data collection SCHEDULES are the unique way to collect data from the network and to display the data
in nomad reports.
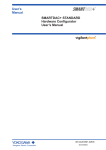
The following picture shows an example of a regional group definition. There are plenty of possibilities for
group creation, the most common rules for the group creation include the following: regional based, OSPF
area based, equipment type based, etc.
11
All rights reserved. Passing on and copying of this document, use and communication of its contents is not permitted
without prior consent of Oghmasys IT Services GmbH
Oghmasys IT Services GmbH, Gentzgasse 72/27, 1180 Vienna
UID: ATU62104403
Registered no. FN 268554 h
Example of a region-based group definition with some schedules for each group
Managed Elements Groups: Existing groups can be displayed from the menu: Administration -> Data
Integration -> Managed Elements Groups.
Schedules: Existing schedules can be displayed from the menu: Administration -> Data Integration ->
Process Manager. The process manager also displays currently running schedules.
12
All rights reserved. Passing on and copying of this document, use and communication of its contents is not permitted
without prior consent of Oghmasys IT Services GmbH
Oghmasys IT Services GmbH, Gentzgasse 72/27, 1180 Vienna
UID: ATU62104403
Registered no. FN 268554 h
3. nomad User Interface
Login to nomad
nomad user-interface is a secure web-interface using HTTPS. You need a modern standard-compliant webbrowser to access nomad user interface (Chrome is highly recommended).
nomad user-interface can be accessed with the following URL:
https://{yourConfiguredIP}/Nomad
HTTPS requires that the certificate is accepted by the browser for nomad server. Depending on the
browser you use, you may get a warning. Simply ignore the browser warning and accept the certificate to
access nomad login page.
Certificate Warning Chrome
In Google Chrome, simply click on "Proceed Anyway".
In Mozilla Firefox, simply click on "Or you can add an exception" to add and confirm the exception.
After accepting the certificate you will be redirected to the login Page.
Login Screen
Default login credentials are:
Username: tomcat
Password: tomcat
13
All rights reserved. Passing on and copying of this document, use and communication of its contents is not permitted
without prior consent of Oghmasys IT Services GmbH
Oghmasys IT Services GmbH, Gentzgasse 72/27, 1180 Vienna
UID: ATU62104403
Registered no. FN 268554 h
You are now successfully logged in!
General Architecture
Controls
nomad is controlled purely by the mouse. Left-click performs all of the nomad operations, there are no
right-click options. Occasionally, for example on the Map, the mouse wheel may be used to zoom in/out.
Main Menu
The main menu is divided into three categories: Modules, Administration and Logout.
nomad main menu
Modules provides the network data visualization and analysis.
Administration is necessary to configure nomad (schedules, inventory, networking).
The Logout button performs a straightforward logout function: when clicked, the user will exit nomad. To
start nomad again, the user must login again.
Modules
This menu provides the data visualization and analysis for the different modules that the user has
purchased. Currently there are three different modules: Microwave, Optical and Alarm.
nomad Modules menu
Administration
This menu provides nomad configuration of the network inventory, the data retrieval schedules and the
nomad server configuration.
Reports
The reports are graphical components that display the data requested by the user and, in a few cases, also
allow the user to edit data. These reports are displayed once the user clicks on an option in the menu. The
14
All rights reserved. Passing on and copying of this document, use and communication of its contents is not permitted
without prior consent of Oghmasys IT Services GmbH
Oghmasys IT Services GmbH, Gentzgasse 72/27, 1180 Vienna
UID: ATU62104403
Registered no. FN 268554 h
displayed reports are a list of graphical widgets such as grids, charts, a map, a tab panel or a time series
chart.
Grids
Grids are the main component to display data to the user. All the grids in nomad have common behavior
and actions.
Pagination
The grids show a fixed amount of data rows and the user should move through pages to visualize all the
contents. To do that the user has to click on the page arrows to switch the page.
In the image below there are three grid components. In red: the component (1) allows the user to navigate
through the pages of the grid; the component (2) allows the user to change the size of the page. To see an
effective change of the page size it is also necessary to refresh the page clicking on the refresh button,
component (3).
nomad Grid example
Sorting
The user can also sort the grid according to one of its columns by clicking on the header of that column. It
is also possible to sort the grid by clicking on the right end of the column header and selecting ‘Sort
Ascending’ or ‘Sort Descending’.
nomad Grid column sorting
Column Hiding
15
All rights reserved. Passing on and copying of this document, use and communication of its contents is not permitted
without prior consent of Oghmasys IT Services GmbH
Oghmasys IT Services GmbH, Gentzgasse 72/27, 1180 Vienna
UID: ATU62104403
Registered no. FN 268554 h
Some grids may have a large number of columns. Depending on the user’s screen and resolution, the grid
may be difficult to work with due to the amount of information shown. Hiding columns will improve the
readability of the grid.
To hide a column in the grid the user must click on the right side of one of the headers of the grid and then
deselect the column the user wants to hide.
nomad Grid column hiding
Filtering
To filter the grid according to the value of a column it is necessary to click on the right side of the column
the user wants to filter. Then the user can select the ‘Filters’ option and then insert the values for the
selection. There are three kinds of filters according to the column type: text, date and number.
Text filtering: for this kind of filtering the user can insert in the filtering field the text that is
searched for in the column.
16
All rights reserved. Passing on and copying of this document, use and communication of its contents is not permitted
without prior consent of Oghmasys IT Services GmbH
Oghmasys IT Services GmbH, Gentzgasse 72/27, 1180 Vienna
UID: ATU62104403
Registered no. FN 268554 h
nomad Grid text column filtering
Date filtering: there are three kinds of date filters (‘before’, ‘after’ and ‘on’) that can be applied to
dates. It is important to know that the date filters have a precision of days.
nomad Grid date column filtering
Note: In the image above it can be seen that the selected dates are those after 24-4-2012 00:00 A.M.
Number filtering: there are three kinds of numerical filters (less than, greater than and equal to).
nomad Grid numerical column filtering
Selection
There are three kinds of row selection in grids: no selection, single selection and multiple selection. When
a row is selected the user can perform the following actions:
Show new graphical components displaying the detail of that row. For most grids, when one or
several rows are selected, nomad will show new components (charts, grids, maps...) with the detail
of that row.
If the grid is editable, the user can delete it by clicking on the ‘Delete’ button.
If the grid is editable, selected rows may be inserted in relation with other elements. For example,
a grid of Managed Elements can be selected to be added to Managed Elements Groups.
17
All rights reserved. Passing on and copying of this document, use and communication of its contents is not permitted
without prior consent of Oghmasys IT Services GmbH
Oghmasys IT Services GmbH, Gentzgasse 72/27, 1180 Vienna
UID: ATU62104403
Registered no. FN 268554 h
The time series graph below the grid is the detail of the selected schedule of that grid.
Export
Every grid can be exported as a spreadsheet (Microsoft Excel format). This export will include the
information of all the pages inside the grid. To request the export the user must click on the ‘Export’
button located at the top left of the grid.
18
All rights reserved. Passing on and copying of this document, use and communication of its contents is not permitted
without prior consent of Oghmasys IT Services GmbH
Oghmasys IT Services GmbH, Gentzgasse 72/27, 1180 Vienna
UID: ATU62104403
Registered no. FN 268554 h
nomad grids - Export button
Time Series Charts
Time Series Charts are graphical components that show a set of time series for a certain time range.
Usually, these time series are performance data from a previously selected link (a link from a row in a grid
or a link from a map).
nomad Time series chart example
When a link or any other element is selected and generates a Time Series Chart, this chart has a predefined
time range. The user can change this time range by modifying the ‘From Date’ and ‘To Date’ and then
clicking the ‘Update Chart’ button.
19
All rights reserved. Passing on and copying of this document, use and communication of its contents is not permitted
without prior consent of Oghmasys IT Services GmbH
Oghmasys IT Services GmbH, Gentzgasse 72/27, 1180 Vienna
UID: ATU62104403
Registered no. FN 268554 h
nomad Date selection for Time series chart example
The user can also zoom-in on the Time Series Chart by selecting a time range in the chart using the mouse
(drag-and-drop). Furthermore, if the user wants to see the detail of a data point (the date it was collected
and the result) the user should move the mouse pointer to that chart point. Then nomad will automatically
show a dialog with the detail of that point.
nomad Sample selection for Time series chart example
Pie Charts
A Pie Chart is a circular chart divided into sectors, each showing the relative size of each value. It
graphically represents the split in quantity of values of a certain parameter including the corresponding
percentage.
20
All rights reserved. Passing on and copying of this document, use and communication of its contents is not permitted
without prior consent of Oghmasys IT Services GmbH
Oghmasys IT Services GmbH, Gentzgasse 72/27, 1180 Vienna
UID: ATU62104403
Registered no. FN 268554 h
nomad Pie Chart example
Map
The Map is a graphical component that displays geographical information of locations (sites) and links
between the Managed Elements located at those locations.
nomad Microwave Network Map
The user can navigate using drag-and-drop and also zoom in and zoom out using the mouse wheel.
When there is more than one link between the same two sites, the links are displayed as different paths
between those two sites.
21
All rights reserved. Passing on and copying of this document, use and communication of its contents is not permitted
without prior consent of Oghmasys IT Services GmbH
Oghmasys IT Services GmbH, Gentzgasse 72/27, 1180 Vienna
UID: ATU62104403
Registered no. FN 268554 h
If the user hovers on one of the links, its width will be increased and the map will show the location name
of its two end ports. If the user clicks on a link, that link will be painted in purple to let the user know that
that is the particular link displayed in detail. The detail of a link is displayed by one or more graphical
components that show information related to that link (performance, alarms).
The tiles of the map are retrieved from nomad server. This means that no tiles are retrieved from the
Internet therefore it is possible to deploy nomad and use the map in a network without Internet access.
22
All rights reserved. Passing on and copying of this document, use and communication of its contents is not permitted
without prior consent of Oghmasys IT Services GmbH
Oghmasys IT Services GmbH, Gentzgasse 72/27, 1180 Vienna
UID: ATU62104403
Registered no. FN 268554 h
4. nomad Administration
Administration
The administration menu contains the following configuration menus:
Process Manager: allows the user to configure the data collection (i.e. schedules)
Data Integration: submenus here allow the user to configure the network inventory as well as the
managed element groups for the schedules.
System Management: configuration of nomad server networking, time zone and licence.
nomad Administration menu
Data Integration
Note: It is important to have read and understood nomad data integration concepts explained in Chapter
2.
This menu option contains the following configuration submenus: Locations, Servers, Managed Elements
and Managed Elements Groups.
nomad Data Integration menu
23
All rights reserved. Passing on and copying of this document, use and communication of its contents is not permitted
without prior consent of Oghmasys IT Services GmbH
Oghmasys IT Services GmbH, Gentzgasse 72/27, 1180 Vienna
UID: ATU62104403
Registered no. FN 268554 h
Locations
This configuration menu allows the user to display, add and delete locations, as well as to display the
different managed element in the different locations. The main grid displays the different locations that
are stored in nomad. New locations can be added and removed by clicking the ‘Create’ and ‘Delete’
buttons on the top of the grid. If the user selects one or more locations nomad will display the managed
elements in the selected locations in a new grid, below the Locations grid.
nomad Locations dashboard
To create a new Location the user should click the button ‘Create’. If the user wants to remove one or
more Location then the user should select the Locations to remove and then click the ‘Delete’ button.
The longitude and latitude coordinates must be in the format ‘EPSG:4326’ so that the sites can be properly
displayed in the map.
Note: Location names are usually automatically retrieved from the network management system, albeit
without geo-coordinates.
24
All rights reserved. Passing on and copying of this document, use and communication of its contents is not permitted
without prior consent of Oghmasys IT Services GmbH
Oghmasys IT Services GmbH, Gentzgasse 72/27, 1180 Vienna
UID: ATU62104403
Registered no. FN 268554 h
Note: The geographic representation of the network topology requires the location coordinates to be
loaded into nomad. This can be done during the installation; location coordinates can be loaded from a
spreadsheet for all locations in the network. It is also possible to add and edit coordinates in the Location
grid (Administration->Data Integration->Locations).
ATTENTION: DELETING A LOCATION WILL DELETE ALL THE MANAGED ELEMENTS INSIDE AND ALSO ERASE
ALL DATA COLLECTED FOR THOSE MANAGED ELEMENTS!
Servers
This menu has a list of servers registered in nomad that have one or more Network Management Systems
(NMS) installed. The user can create and remove new servers, as well as add NMSs to the servers. nomad
uses the NMSs to retrieve the information about the managed elements and their locations in the
network. nomad retrieves that information by running the schedule type ‘NMS Synchronization’. The
configuration of schedules is explained later in this user manual (see Process Manager).
It is important to note that nomad requires at least one NMS. In case there is no NMS in the network it is
necessary to add nomad as the NMS and also the server where it is running.
nomad Servers dashboard
To create a new Server the user should click the button ‘Create’. If the user wants to remove one or more
servers then the user should select the servers to remove and then click the button ‘Delete’.
If the user wants to remove a Network Management Software from a Server the user should select the
server to modify. Then, the user should select the Network Management Software the user wants to
remove in the grid below (the one that displays Network Management Software). Finally, the user should
click the button ‘Remove’ to remove it from the server.
To add new Network Management Software to a server the user should first select the server the user
wants to modify. Then the user has to click the button ‘Add selected to Network Management Software’.
Finally, the user has to select the Network Management Software to insert and click the ‘OK’ button.
25
All rights reserved. Passing on and copying of this document, use and communication of its contents is not permitted
without prior consent of Oghmasys IT Services GmbH
Oghmasys IT Services GmbH, Gentzgasse 72/27, 1180 Vienna
UID: ATU62104403
Registered no. FN 268554 h
Managed Elements
This configuration menu allows the user to display and edit the Managed Elements in nomad. Managed
elements are usually automatically retrieved from the network management system, using an ‘NMS
Synchronization’ schedule. However, the user can also create and delete Managed Elements directly in
nomad.
Note: The data collection in nomad is based on managed elements groups and schedules. See Chapter 2.
nomad Data Integration for the data collection concepts.
Display Managed Elements Groups and Schedules
This configuration menu allows the user to first display a grid with all the Managed Elements. Selecting a
Managed Element displays a grid below showing the groups to which the selected Managed Elements
belong. If the user selects one or more groups nomad will generate a grid below with the information
about the schedules that retrieve information for the selected groups.
26
All rights reserved. Passing on and copying of this document, use and communication of its contents is not permitted
without prior consent of Oghmasys IT Services GmbH
Oghmasys IT Services GmbH, Gentzgasse 72/27, 1180 Vienna
UID: ATU62104403
Registered no. FN 268554 h
nomad Managed Elements dashboard
Add and delete Managed Elements
To create a new Managed Element the user should click the ‘Create’ button. If the user wants to delete
one or more Managed Elements then the user should select the Managed Elements to delete and finally
click the button ‘Delete’.
WARNING: IF THE USER REMOVES A MANAGED ELEMENT, ALL OF ITS PTPs, BOARDS AND COLLECTED
DATA WILL BE REMOVED.
Note: The user should take into account that nomad uses the term ‘Delete’ to remove elements from the
database, although it uses the term ‘Remove’ to remove relations between elements (for example, the
relation between Managed Element and Managed Element Group).
27
All rights reserved. Passing on and copying of this document, use and communication of its contents is not permitted
without prior consent of Oghmasys IT Services GmbH
Oghmasys IT Services GmbH, Gentzgasse 72/27, 1180 Vienna
UID: ATU62104403
Registered no. FN 268554 h
Ping Managed Element
In the Managed Element grid there is a column labeled ‘Ping’ that allows the user to Ping the Managed
Element from nomad.
Add Managed Elements to Groups
To include one or several Managed Elements in a Group the user should first select the Managed Elements
the user wants to insert in a Managed Element Group. Then the user has to click the button ‘Add selected
to Group’. Finally, the user has to select the Managed Element Group to insert and click the ‘OK’ button.
Remove Managed Elements from Groups
To remove one or several Managed Elements from a Group the user should first select the Managed
Elements to be removed. Then, the user has to select the Managed Elements Groups the user wants the
elements to be removed from, in the grid below (the one that displays Managed Elements Groups). Finally,
the user should click the button ‘Remove’ to remove the elements from the selected Managed Element
Groups.
WARNING: IF THE USER REMOVES A MANAGED ELEMENT GROUP ALL ITS SCHEDULES AND THE DATA
RETRIEVED BY THESE SCHEDULES WILL BE REMOVED.
Managed Elements Groups
Display Managed Elements Groups
This configuration menu allows the user to first display a grid with all the Managed Elements Groups. As
explained above, the Managed Elements Groups are sets of Managed Elements that are used by schedules
to identify which Managed Elements to collect data from.
28
All rights reserved. Passing on and copying of this document, use and communication of its contents is not permitted
without prior consent of Oghmasys IT Services GmbH
Oghmasys IT Services GmbH, Gentzgasse 72/27, 1180 Vienna
UID: ATU62104403
Registered no. FN 268554 h
nomad Managed Elements Groups dashboard
Add and Remove Managed Elements Groups
To create new Managed Elements Group the user should click the button ‘Create’. If the user wants to
delete one or more Managed Element Groups then the user should select the managed groups to delete
and then click the button ‘Delete’.
29
All rights reserved. Passing on and copying of this document, use and communication of its contents is not permitted
without prior consent of Oghmasys IT Services GmbH
Oghmasys IT Services GmbH, Gentzgasse 72/27, 1180 Vienna
UID: ATU62104403
Registered no. FN 268554 h
Managed Elements Group creation
ATTENTION: DELETING A MANAGED ELEMENT WILL ERASE ALL DATA COLLECTED FOR THAT MANAGED
ELEMENT!
Managed Elements of Managed Element Groups
When the user selects a Managed Elements Group, nomad displays below the Managed Elements
contained in that Group. The user can add and remove Managed Elements from the Managed Elements
Groups.
If the user wants to remove Managed Elements from a Managed Elements Group, the user should select
the Managed Element Group to modify. Then, the user has to select the Managed Elements the user wants
to remove in the grid below (the one that displays Managed Elements). Finally, the user has to click the
button ‘Remove’ to remove them from the Managed Element Group.
To add new Managed Elements to the Managed Elements Groups the user should first select the Managed
Elements Groups the user wants to modify (1). Then, the user has to click the button ‘Add selected to
Manage Elements’ (2). Finally, the user has to select the Managed Elements to insert and click the ‘OK’
button (3).
30
All rights reserved. Passing on and copying of this document, use and communication of its contents is not permitted
without prior consent of Oghmasys IT Services GmbH
Oghmasys IT Services GmbH, Gentzgasse 72/27, 1180 Vienna
UID: ATU62104403
Registered no. FN 268554 h
Insertion of two Managed Elements into a Group example
Note: the Managed Element Group names should be as meaningful as possible in order to identify groups
quickly in the future.
Note: It is recommended to stop and delete all schedules of a group before deleting it.
Note: Inventory data collection schedules apply to the whole network or to a sub-network managed by a
given NMS. For that reason, there are specific network element groups in nomad:
Whole Network Group: contains all managed elements currently in nomad.
NMS Group: contains all managed elements managed under the selected NMS (i.e. 1353NM).
These groups can only be used for inventory schedules. Inventory data collection schedules run forever
until they are stopped by the user. You can control the recurrence of the data collection using the Interval
parameter. The inventory schedule will run and then wait for the duration of the Interval period before
starting again.
Process Manager
The Process Manager is used to monitor and control server side processes. This is the unique control panel
to follow the execution of data collection processes, also called schedules. It is important that the user
fully understands the nomad data retrieval system explained in Chapter 4. nomad Administration
To open the process manager click in Administration -> Process Manager.
31
All rights reserved. Passing on and copying of this document, use and communication of its contents is not permitted
without prior consent of Oghmasys IT Services GmbH
Oghmasys IT Services GmbH, Gentzgasse 72/27, 1180 Vienna
UID: ATU62104403
Registered no. FN 268554 h
nomad Process Manager
This panel lists all - running or completed - data collection processes, or so-called schedules. The table
provides all relevant information on the active schedules. Each column is explained below:
Schedule Name: meaningful name that easily identifies the schedule
Schedule Type: defines the measure to retrieve from the network. There are three schedule types:
Software Name: this field only applies if the schedule type is “NMS Synchronization”. The value of
the field is the name of the NMS from which the “NMS Synchronization” schedule should retrieve
data.
Group Name: group of managed elements that will provide the measurement information
Sample Interval (in seconds): the number of seconds that the schedule should wait between two
consecutive data retrievals.
Max. Concurrent: the number of network elements to process concurrently in the group.
Start Date: the date when the schedule will start to retrieve information.
End Date: the date when the schedule will stop the information retrieval.
Note: Inventory schedules do not stop automatically (End Date is ignored). The only way to stop an
inventory schedule is in the process manager, clicking on ‘Stop’.
Note: A schedule and its corresponding data can be permanently removed from nomad by a simple click
on ‘Remove’ on the Schedules Group report. All data collected during that particular schedule will be
erased permanently and won't be available in reports anymore.
ATTENTION: Be aware that too short an interval could overload the DCN! Be aware that too many
concurrent data collections could overload the DCN!
ATTENTION: DELETING A SCHEDULE WILL REMOVE ALL DATA ATTACHED TO IT. IT WILL NO LONGER BE
POSSIBLE TO DISPLAY RELATED DATA IN ANY REPORT.
Network Schedule Types
Network Inventory
The Network Inventory schedule type performs the topology discovery and collects hardware and radio
inventory data.
Inventory data collection schedules apply to the whole network or to a sub-network managed by a given
NMS. For that reason, there are specific network element groups in nomad:
Whole Network Group: contains all network elements currently in nomad.
NMS Group: contains all network elements managed under the selected NMS (i.e. 1353NM).
32
All rights reserved. Passing on and copying of this document, use and communication of its contents is not permitted
without prior consent of Oghmasys IT Services GmbH
Oghmasys IT Services GmbH, Gentzgasse 72/27, 1180 Vienna
UID: ATU62104403
Registered no. FN 268554 h
Note: These groups can only be used for inventory schedules. Inventory data collection schedules runs
forever until they are stopped by the user. You can control the recurrence of the data collection using the
Interval parameter. The inventory schedule will run and then wait for the Interval period before starting
again.
Note: Inventory schedules do not stop automatically (End Date is ignored). The only way to stop an
inventory schedule is in the process manager (See chapter 6).
Note: The data collection is concurrent for as many network elements as specified in the schedule
properties (i.e. Concurrent Max Requests).
NMS Synchronization
This type of schedule regularly retrieves managed elements details and location information from the
NMSs registered in nomad (i.e. Software).
The NMS involved in the data retrieval is the one selected in the field “Software Name”. This schedule can
be configured to run for the whole network, i.e. synchronize all NMS, or for a given NMS.
Note: the NMS must be preliminarily declared in nomad under Administration -> Data Integration ->
Servers
The NMS Synchronization schedule type ensures that the NMS and nomad are aligned, for the following
information:
Location/site names
Managed element types
Managed element user labels
Managed element IP addresses
Supported Network Management Systems:
● Alcatel-Lucent 1350OMS-EML (i.e. 1353NM)
● Alcatel-Lucent 5620SAM, through SAM-O northbound interface
Performance Schedules
Performance data collection schedules run on a specific group of managed elements. Data is collected
concurrently (i.e. Concurrent Max Request parameter) for a definite period of time (i.e. from Start Date to
End Date). Performance counters are retrieved at a regularity defined by the Interval parameter.
The performance schedules are of the following types.
TSL/RSL Schedule
This schedule type retrieves Transmit and Receive Signal Levels (TSL / RSL) instant values of all radio ports
available on all Managed Elements in the group.
Ethernet Tx Schedule
This schedule type retrieves capacity usage instant values of all radio ports available on all Managed
Elements in the group.
G.826 History Schedule
This schedule type retrieves 15 minute history G.826 counters of all radio ports available on all Managed
Elements in the group:
● Errored Seconds (ES)
● Severely Errored Second (SES)
33
All rights reserved. Passing on and copying of this document, use and communication of its contents is not permitted
without prior consent of Oghmasys IT Services GmbH
Oghmasys IT Services GmbH, Gentzgasse 72/27, 1180 Vienna
UID: ATU62104403
Registered no. FN 268554 h
●
●
Unavailable Seconds (UAS)
Background Block Error (BBE)
Note: The G.826 History schedule collects 15 minute history data from the managed elements. The interval
specified as parameter of the schedule corresponds to a period for which the 15 minute counters should
be fetched (i.e. 84600 = once a day, 3600 = once per hour). All available counters are retrieved for the last
2 periods each time. For example, if the interval is set to 3600 (i.e. every 1 hour), every hour nomad will
retrieve the 15 minute counters for the last 2 hours.
Creation of data collection schedules
The first step to create a schedule for data collection is to press the button “Create” in the menu bar of the
“Process Manager” grid.
nomad Process Manager ‘Create’ button
Once the user clicks on this button, nomad displays a dialog where the user can introduce the data for the
new schedule.
nomad Schedule creation dialog
Finally, the user must press the ‘Create’ button so that nomad can add this new schedule.
ATTENTION: Be aware that too short Sample Intervals could overload the DCN! Be aware that too many
concurrent data collections could overload the DCN!
34
All rights reserved. Passing on and copying of this document, use and communication of its contents is not permitted
without prior consent of Oghmasys IT Services GmbH
Oghmasys IT Services GmbH, Gentzgasse 72/27, 1180 Vienna
UID: ATU62104403
Registered no. FN 268554 h
Schedule Actions
Once the schedules are created, the user can manage them by executing one of the following actions:
Start: changes the start date to the current date and starts the schedule.
Stop: stops the schedule.
Restart: stops the schedule and starts it again
Reschedule: sets the start date of the schedule to the current date and changes the end date to fit
the previous time interval.
nomad Schedule actions from Schedules grid
NOMAD System Management
The system manager allows the user to do the following administrative tasks: ping an IP, upload a licence
file, change the time zone of the server, change the network interface configuration and change the
routing table.
35
All rights reserved. Passing on and copying of this document, use and communication of its contents is not permitted
without prior consent of Oghmasys IT Services GmbH
Oghmasys IT Services GmbH, Gentzgasse 72/27, 1180 Vienna
UID: ATU62104403
Registered no. FN 268554 h
System Management
Ping IP Address
To check if a managed element can be reached by nomad, the user can introduce the IP address of that
managed element in the “IP Address” field and then click the “Ping” Button. nomad will notify the user
whether the ping request was successful or not.
nomad successful Ping call
License Upload
When the user receives the purchased nomad license it is mandatory to upload it in nomad. The license
uploading is a classical web uploading mechanism in which the user first clicks on the “Browse” button to
select the license file and then clicks on the “Submit” button to send the license.
36
All rights reserved. Passing on and copying of this document, use and communication of its contents is not permitted
without prior consent of Oghmasys IT Services GmbH
Oghmasys IT Services GmbH, Gentzgasse 72/27, 1180 Vienna
UID: ATU62104403
Registered no. FN 268554 h
nomad Upload License
Time Zone
This component allows the user to change the time zone of nomad. It is important to know that the dates
used in the data collection schedules are in the time zone of nomad.
To change the time zone the user should select the new time zone in the combo box below the grid, click
on the button ‘Change Time Zone’ and select the appropriate option.
nomad Time Zone change dialog
Network Interface Configuration
This configuration menu provides a graphical method to modify nomad network interface configuration.
The user can create new interface configurations, delete them and also modify the existing ones. It is
important to know that when there is a change in the grid, the networking services of nomad server are
restarted.
nomad Network Interface grid
37
All rights reserved. Passing on and copying of this document, use and communication of its contents is not permitted
without prior consent of Oghmasys IT Services GmbH
Oghmasys IT Services GmbH, Gentzgasse 72/27, 1180 Vienna
UID: ATU62104403
Registered no. FN 268554 h
IP Routing
This provides a graphical method to modify the routing table of nomad. To modify IP routing the user must
add or delete routes. It is not possible to edit existing routes.
nomad IP Routing table as a grid
38
All rights reserved. Passing on and copying of this document, use and communication of its contents is not permitted
without prior consent of Oghmasys IT Services GmbH
Oghmasys IT Services GmbH, Gentzgasse 72/27, 1180 Vienna
UID: ATU62104403
Registered no. FN 268554 h
5. nomad Modules & Reports
nomad modular architecture allows a flexible configuration of both the data collection and the reports. A
module is a set of data collection capabilities and reports focusing on a particular entity: specific
parameters, technology, etc. The following modules are available:
● Microwave Networks
● M001 - Network Representation & Topology Discovery
● M002 - Radio Inventory
● M003 - Tx, Rx Power Monitoring
● M004 - Capacity & Ethernet Usage
● M005 - G.826 Performance Monitoring
● M008 - Adaptive Modulation Monitoring
● M009 - Hardware Inventory
Microwave Networks
This chapter of the user manual focuses on the Microwave modules which are available through the menu
Modules->Microwave.
nomad Microwave Networks sub-menu
M001 - Representation & Topology Discovery
Description
This module provides the automatic discovery of the microwave network topology and its representation
on a map. The geographic representation is offline (no Internet connection requirement): all map tiles are
downloaded to nomad during installation.
The topology discovery is an algorithm which discovers the radio link connections between managed
elements from a list of IP addresses. The list of IP addresses can be retrieved from the NMS or loaded from
a spreadsheet into nomad. There is also the possibility to add managed elements directly through the
nomad user-interface.
Supported Equipment
Network Management Systems:
● Alcatel-Lucent 1350-OMS-EML (i.e. 1353NM)
● 5620SAM through SAM-O northbound interface
39
All rights reserved. Passing on and copying of this document, use and communication of its contents is not permitted
without prior consent of Oghmasys IT Services GmbH
Oghmasys IT Services GmbH, Gentzgasse 72/27, 1180 Vienna
UID: ATU62104403
Registered no. FN 268554 h
Network Elements:
● 9400AWY
● 9500MXC
● 9500MPR (MSS4/8)
Reports
The discovered network topology is represented on the map which can be displayed from the menu:
Modules->Microwave->Network Map. Protected links (1+1) are represented by a bolder line whereas 1+0
links are represented with a simple line.
nomad Network Map
If the user clicks on a link, nomad will display below the map a tab panel with different technologies:
TSL/RSL, G.826, Capacity Dashboard, Ethernet Tx and Adaptive Modulation. For each technology, the
dashboard shows in a grid the different schedules it has. If the user selects one or more schedules, the
dashboard will provide its performance details. The performance measures are graphs and grids with the
information that has been retrieved and computed by nomad. The charts allow the user to select the range
of data to display. Furthermore, the grids allow the user to filter and sort the measures.
Note: The geographic representation of the network topology requires the location coordinates to be
loaded into nomad. This can be done during the installation; location coordinates can be loaded from a
spreadsheet for all locations in the network. It is also possible to add and edit coordinates in the Location
report (Administration->Data Integration->Locations), see Chapter 4. nomad Administration -> Data
Integration -> Locations.
Beside the representation of the microwave network on the map, this module also provides a microwave
link connections report listing all radio links discovered including equipment label and types, radio ports on
both ends and location names.
This report can be displayed or exported from the menu, selecting Modules->Microwave->Topological
Links.
40
All rights reserved. Passing on and copying of this document, use and communication of its contents is not permitted
without prior consent of Oghmasys IT Services GmbH
Oghmasys IT Services GmbH, Gentzgasse 72/27, 1180 Vienna
UID: ATU62104403
Registered no. FN 268554 h
nomad Topological Links Report
The link name is built as a concatenation of the location names of both ends of the link.
M002 - Radio Inventory
Description
This module provides a complete inventory of radio parameters in the microwave network. Frequencies,
modulation schemes, protection schemes, link capacity are collected and reported for every microwave
radio link in the network.
Corresponding data collection schedule type: Network Inventory
Supported Equipment
Managed Elements:
● 9400AWY
● 9500MXC
● 9500MPR (MSS4/8)
Reports
The full radio inventory report can be displayed or exported from the menu Modules->Microwave->Radio
Inventory. It is composed of a grid and a chart representing the number of radio links per frequency band.
The grid contains a row for each radio link in the network with radio parameters and site details:
● Link name
● Site A and Z (near- and far-end)
○ Location name
○ Location coordinates (longitude, latitude)
○ Equipment name and type
○ Tx and Rx frequencies in KHz
● Frequency band
● Modulation type (static or adaptive)
● Modulation scheme
● Protection Scheme
● Link Max Capacity in kpbs
41
All rights reserved. Passing on and copying of this document, use and communication of its contents is not permitted
without prior consent of Oghmasys IT Services GmbH
Oghmasys IT Services GmbH, Gentzgasse 72/27, 1180 Vienna
UID: ATU62104403
Registered no. FN 268554 h
nomad Microwave Radio Inventory Report
M003 - Tx, Rx Power Monitoring
Description
This module provides capabilities to monitor microwave link transmit and receive power, also known as
Transmit and Received Signal Level (TSL/RSL), for the whole network. The RSL data collection schedule
allows detailed measurements collections (sampling time in the order of a few seconds) which are then
represented in the report along time. In case of protected links, both main and spare are considered and
represented in the reports.
Corresponding data collection schedule type: TSL/RSL
Supported Equipment
Network Elements:
● 9400AWY
● 9500MXC
● 9500MPR (MSS4/8)
● 9500MPR (MSS1C) as of Rel. 3.4
Reports
There are two different TSL/RSL reports available in nomad:
●
Multi-link TSL/RSL Report: lists Tx and Rx power measurements for several radio links in the same
report, indicating the maximum, minimum and average values in the measurement interval. This is
particularly useful to display data for several schedules at once.
42
All rights reserved. Passing on and copying of this document, use and communication of its contents is not permitted
without prior consent of Oghmasys IT Services GmbH
Oghmasys IT Services GmbH, Gentzgasse 72/27, 1180 Vienna
UID: ATU62104403
Registered no. FN 268554 h
●
Single-link Report: plots TSL/RSL measurements for a single radio link including a chart and a
grid containing all measurements in the time-interval.
The TSL/RSL reports can be displayed and exported directly from the map with a click on a link or from the
“TSL/RSL” tab of the performance dashboard: Modules->Microwave->Performance Dashboard.
nomad Performance Dashboard - TSL/RSL Tab
TSL/RSL Multi-Link Report
This report provides Tx and Rx power measurements on both ends of each link included in the schedules
(and corresponding groups) selected in the first grid of the report. The time spans are as the selected
schedules are due to last for.
Power values are in dBm and represented in a table with one row per radio link.
The ends of the link are referred to as “Local” and “Remote”. Aggregated values (min/max/avg) over the
schedule duration are available for both local and remote ends.
nomad Multi-Link TSL/RSL Report
In order to have further details, it is possible to drill-down to the single-link report including a chart and
detailed measures. To do so select a link (i.e. a row).
TSL/RSL Single-Link Report
This report provides a detailed representation of the Tx and Rx power measurements on both ends of the
selected link.
Power values are expressed in dBm.
The single-link TSL/RSL report is composed of a grid and a chart. The chart provides Tx and Rx power
measurements along the time for both ends of the link (i.e. local and remote). It is possible to zoom in and
out on the chart simply selecting a time interval with the mouse. The ‘reset’ button resets the initial scale
of the chart. Series can be enabled or disabled simply clicking on the series name.
Per default, the chart displays the data for the last seven (7) days starting from the latest available
measurement. This time interval can be adjusted using the time selection boxes (i.e. ‘From Date’ and ‘To
Date’) in the top left-hand corner of the chart and pressing the ‘Update Chart’ button.
43
All rights reserved. Passing on and copying of this document, use and communication of its contents is not permitted
without prior consent of Oghmasys IT Services GmbH
Oghmasys IT Services GmbH, Gentzgasse 72/27, 1180 Vienna
UID: ATU62104403
Registered no. FN 268554 h
The grid contains every measurement in the time interval for both local and remote radio ports.
nomad TSL/RSL Single-Link Report
M004 - Capacity & Ethernet Usage
Description
This module enables the monitoring of the link capacity and particularly Ethernet capacity usage on the
radio link for a single Managed Element a group of elements.
This module provides a unique insight into the real capacity usage - both TDM and Ethernet capacities along the time of the whole microwave network. It is particularly useful to prevent congestions, forecast
capacity upgrades and understand Ethernet traffic trends (transmit rate, peak times, congested links, etc).
The following parameters are available per radio link:
● Total link capacity in kbps
● TDM capacity in kbps
● Available capacity for Ethernet traffic in kbps
● Ethernet Tx Transmit Rate in kbps on both directions
● Ethernet Throughput in % of the bandwidth available for Ethernet currently used
● Ethernet frame discarded rate in % of total transmitted frames
● Total Transmitted Octets (TTO) incremental counter in Tx direction on the radio
● Total Transmitted Frames (TTF) incremental counter in Tx direction on the radio
● Total Discarded Frames (TDF) incremental counter in Tx direction on the radio
Corresponding data collection schedule type: Ethernet Tx
Supported Equipment
Managed Elements:
● 9400AWY
● 9500MPR (MSS4/8)
● 9500MPR (MSS1C) as of Rel. 4.0
44
All rights reserved. Passing on and copying of this document, use and communication of its contents is not permitted
without prior consent of Oghmasys IT Services GmbH
Oghmasys IT Services GmbH, Gentzgasse 72/27, 1180 Vienna
UID: ATU62104403
Registered no. FN 268554 h
Reports
There are two different types of capacity reports available in nomad :
●
●
Multi-link Report: lists the above capacity parameters for multiple radio links in the same
report, indicating the maximum, minimum and average values in the measurement
interval. This is particularly useful to display data for several schedules at once.
Single-link Report: plots capacity measurements for a single radio link including charts and a grid
containing all measurements in the time-interval.
The Capacity Usage reports can be displayed and exported directly from the map with a click on a link or
from the “Capacity Dashboard” tab of the performance dashboard: Modules->Microwave->Performance
Dashboard.
nomad Performance Dashboard - Capacity Dashboard Tab
Capacity Dashboard Multi-Link Report
This report provides a unique view of the total capacity usage of each radio link included in the schedules
(and corresponding groups) selected in the first grid of the report. The time spans are as the selected
schedules are due to last for.
The ends of the link are referred as “Local” and “Remote”. Aggregated values (min/max/avg) over the
schedule duration are available for both local and remote ends.
The report contains the following capacity figures, for both local and remote ends of the radio links:
● Total link capacity in kbps
● Ethernet transmit rate on the link in kbps
● TDM capacity on the link in kbps
nomad Multi-Link Capacity Dashboard
In order to get further details, it is possible to drill-down to the single-link report including a chart and
detailed measures. To do so, select a link (i.e. a row).
45
All rights reserved. Passing on and copying of this document, use and communication of its contents is not permitted
without prior consent of Oghmasys IT Services GmbH
Oghmasys IT Services GmbH, Gentzgasse 72/27, 1180 Vienna
UID: ATU62104403
Registered no. FN 268554 h
Capacity Dashboard Single-Link Report
The single-link capacity dashboard report is composed of a grid and a chart. The chart provides a stackedarea representation of the capacity usage of the radio link. The total link capacity over the time is
composed of the TDM capacity (brown), the Ethernet capacity (blue) and the remaining available capacity
(green). This chart is available for both ends of the link (i.e. local and remote). It is possible to zoom in and
out on the chart simply selecting a time interval with the mouse. The “reset” button resets to the initial
scale of the chart. Series can be enabled or disabled by simply clicking on the series name.
Per default, the chart displays the data for the last seven (7) days starting from the latest available
measurement. This time interval can be adjusted using the time selection boxes (i.e. “From Date” and “To
Date”) in the top left-hand corner of the chart and pressing the “Update Chart” button.
The grid contains all capacity values in the time interval for both local and remote radio ports.
nomad Capacity Dashboard Single-Link
The Ethernet Tx reports can be displayed and exported directly from the map with a click on a link or from
the “Ethernet Tx” tab of the performance dashboard: Modules->Microwave->Performance Dashboard.
nomad Performance Dashboard - Ethernet Tab
Ethernet Multi-Link Report
This report provides a detailed view of the Ethernet usage of each radio link included in the schedules (and
corresponding groups) selected in the first grid of the report. The time spans are as the selected schedules
are due to last for.
46
All rights reserved. Passing on and copying of this document, use and communication of its contents is not permitted
without prior consent of Oghmasys IT Services GmbH
Oghmasys IT Services GmbH, Gentzgasse 72/27, 1180 Vienna
UID: ATU62104403
Registered no. FN 268554 h
The ends of the link are referred as “Local” and “Remote”. Aggregated values (min/max/avg) over the
schedule duration are available for both local and remote ends.
The report contains the following fields, for both local and remote ends of the radio links:
● Total Transmitted Octets (TTO), incremental counter in Tx direction on the radio
● Total Transmitted Frames (TTF), incremental counter in Tx direction on the radio
● Total Discarded Frames (TDF), incremental counter in Tx direction on the radio
● Ethernet transmit rate in kbps , built on TTO (total transmitted octets) counters and sampled at a
time defined in the data collection schedule
● Ethernet Throughput in %. This elaborated counter provides the percentage of the available
bandwidth for Ethernet really used for Ethernet traffic in Tx direction. The reference is the
bandwidth available for Ethernet traffic.
● Ethernet discarded frame ratio (in %) gives the percentage of Ethernet frames which are
discarded against the total number of transmitted frames. This is also an elaborated
counter built upon total discarded frames (TDF) and total transmitted frames (TTF) counters.
nomad Multi-Link Ethernet Tx Report
Conditional formatting is enabled on this report:
● Ethernet Throughput:
○ Yellow if > 50%
○ Orange if > 80%
○ Red if > 90%
● Ethernet Discarded Ratio:
○ Red if > 0%
In order to get further details, it is possible to drill-down to the single-link report including a chart and
detailed measures. To do so, select a link (i.e. a row).
Ethernet Single-Link Report
The single-link Ethernet Tx report is composed of a grid and a chart. The chart provides Ethernet Tx
Transmit rate along the time for both ends of the link (i.e. local and remote). It is possible to zoom in and
out on the chart simply selecting a time interval with the mouse. The “reset” button resets the initial scale
of the chart. Series can be enabled or disabled simply clicking on the series name.
Per default, the chart displays the data for the last seven (7) days starting from the latest available
measurement. This time interval can be adjusted using the time selection boxes (i.e. “From Date” and “To
Date”) in the top left-hand corner of the chart and pressing the “Update Chart” button.
The grid contains all Ethernet Tx Transmit rate values in the time interval for both local and remote radio
ports.
47
All rights reserved. Passing on and copying of this document, use and communication of its contents is not permitted
without prior consent of Oghmasys IT Services GmbH
Oghmasys IT Services GmbH, Gentzgasse 72/27, 1180 Vienna
UID: ATU62104403
Registered no. FN 268554 h
nomad Ethernet Tx Single-Link Report
M005 - G.826 Performance Monitoring
Description
This module gathers the ITU G.826 performance measurements aggregated over 15 minute or 1 day
periods for the whole network in one single report. ITU G.826 counters are retrieved for both ends of each
radio link included in the schedule (and corresponding group) selected in the first grid of the report. The
time spans are as the selected schedules are due to last for.
The following G.826
● Errored Seconds (ES)
● Severely Errored Second (SES)
● Unavailable Seconds (UAS)
● Background Block Error (BBE)
Corresponding data collection schedule type: G.826 History
Supported Equipment
Network elements:
● 9400AWY
● 9500MXC
● 9500MPR
48
All rights reserved. Passing on and copying of this document, use and communication of its contents is not permitted
without prior consent of Oghmasys IT Services GmbH
Oghmasys IT Services GmbH, Gentzgasse 72/27, 1180 Vienna
UID: ATU62104403
Registered no. FN 268554 h
Report
The G.826 report can be displayed and exported directly from the map with a click on a link or from the
“G.826” tab of the performance dashboard: Modules->Microwave->Performance Dashboard.
nomad Performance Dashboard - G.826 Tab
G.826 Multi-Link Report
This report provides G.826 15 minute measurements of each radio link included in the schedules (and
corresponding groups) selected in the first grid of the report. The time spans are as the selected schedules
are due to last for.
The ends of the link are referred as “Local” and “Remote”. Aggregated values (min/max/avg/sum) over the
schedule duration are available for both local and remote ends.
The report contains the following fields, for both local and remote ends of the radio links:
● Errored Seconds (ES)
● Severely Errored Second (SES)
● Unavailable Seconds (UAS)
● Background Block Error (BBE)
Note: In case no error occurs on a link for 15 minutes, no counter is retrieved.
nomad G.826 Multi-Link report
M008 - Adaptive Modulation
Description
This module allows the monitoring of the adaptive modulation along the time for all the microwave links in
the network. It provides for 15 minute intervals the usage of each modulation scheme in milliseconds, for
each radio link.
Supported Equipment
Managed Elements: 9500MPR (MSS4/8)
Reports
The adaptive modulation report can be displayed and exported directly from the map with a click on a link
or from the “Adaptive Modulation” tab of the performance dashboard: Modules->Microwave>Performance Dashboard.
49
All rights reserved. Passing on and copying of this document, use and communication of its contents is not permitted
without prior consent of Oghmasys IT Services GmbH
Oghmasys IT Services GmbH, Gentzgasse 72/27, 1180 Vienna
UID: ATU62104403
Registered no. FN 268554 h
nomad Performance Dashboard - Adaptive Modulation Tab
Adaptive Modulation Multi-Link Report
This report provides for 15 minute intervals the usage of each modulation scheme in milliseconds, for each
radio link included in the schedules (and corresponding groups) selected in the first grid of the report. The
time spans are as the selected schedules are due to last for.
The ends of the link are referred to as “Local” and “Remote”.
M009 - Hardware Inventory
Description
This module provides a full network microwave equipment inventory report which contains, for each
equipment: part numbers, serial numbers and software release number of every hardware item present in
the equipment, including outdoor units (ODU). Licenses are also retrieved for each managed element.
Inventory data is collected from every network element and grouped in one single report for the whole
network. This is particularly interesting for large scale inventory tasks such as warranty, spare parts and
phase-out management.
Supported Equipment
Managed Elements:
● 9400AWY
● 9500MXC
● 9500MPR (MSS4/8)
Report
The full hardware inventory report can be displayed or exported from the menu Modules->Microwave>Hardware Inventory. It is composed of a grid and a chart representing the split of managed elements by
types. The grid contains a row for each hardware item in the network, grouped by managed element, with
the following parameters:
● Location of the Managed Element the item belongs to
● Information on the Managed Element the item belongs to
○ User label
○ Type
○ Software release
● Item position in the Managed Element
● Item part number
● Item unique serial number
● Item type
● For items which are E1 boards, the report also contains the number of E1 ports on the board and
the number of these ports which are enabled (i.e. “used”).
50
All rights reserved. Passing on and copying of this document, use and communication of its contents is not permitted
without prior consent of Oghmasys IT Services GmbH
Oghmasys IT Services GmbH, Gentzgasse 72/27, 1180 Vienna
UID: ATU62104403
Registered no. FN 268554 h
nomad Microwave Hardware Inventory Report
51
All rights reserved. Passing on and copying of this document, use and communication of its contents is not permitted
without prior consent of Oghmasys IT Services GmbH
Oghmasys IT Services GmbH, Gentzgasse 72/27, 1180 Vienna
UID: ATU62104403
Registered no. FN 268554 h
End of Document
52
All rights reserved. Passing on and copying of this document, use and communication of its contents is not permitted
without prior consent of Oghmasys IT Services GmbH
Oghmasys IT Services GmbH, Gentzgasse 72/27, 1180 Vienna
UID: ATU62104403
Registered no. FN 268554 h