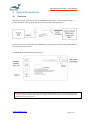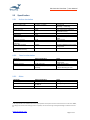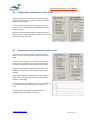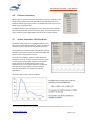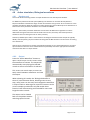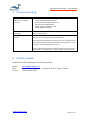
1
IBP Precision Simulator | User Manual WHALETEQ IBP Precision Simulator IBPS 100 IBP Simulator with resistor network (Active and Passive) IBPS 110 IBP Simulator without resistor network (Active only) Operation Manual Version 2014-03-01 For use with software versions 1.3.0.x www.whaleteq.com IBP Precision Simulator | User Manual 1 Introduction IEC 60601-2-34:2005 requires the following performance tests for the invasive blood pressure (IBP) function of a patient monitor: - Accuracy of pressure measurement (static, real pressure sources) - Accuracy of systolic (dynamic, real or simulated pressure sources) - Frequency response (dynamic, real pressure sources) - Alarm response time (dynamic, real or simulated pressure sources) Although some of the tests in the standard refer to real pressure sources, in many cases manufacturers of the monitor and sensor are different. In this case, under both product certification and medical device regulations, it may be appropriate to test the patient monitor using simulated signals only, using the industry wide 5µV/V/mmHg specification for IBP sensors. Also for the frequency response test, an alternate method is to test the patient monitor and sensor separately, with the patient monitor tested by simulated signals, and the sensor tested by step response. On this basis, WhaleTeq has developed a system which can perform all of the above tests using simulated signals. The system provides the following features and functions: - Active (electrical) simulation of pressures using a precision divider, with voltages output at 5µV/Vs/mmHg, where Vs is the measured or set sensor supply voltage. Active simulation includes the following types of output: Static pressures (constant output voltage) Dynamic pressures, sine waves up to 40Hz BioSim Mode, a sample of real biological waveform but with adjustable SYS/DIA and heart rate Biological waveforms, based on samples from the Pysionet website - Internal measurement of sensor supply voltage (allows the system to automatically adjust for the sensor supply) - An output that tracks the sensor voltage at 100mV / 1mV output (e.g. a full scale output of 7.5mV, equivalent to 300mmHg, this output has 750mV) - Passive simulation of static pressures using a network of precision resistors The WhaleTeq IBP Simulator is based on WhaleTeq ECG technology, which in addition to standard waveforms (e.g. sine) can be used for streaming of biological arterial blood pressure waveforms such as those from the Physionet website. Contact WhaleTeq for more details. Important note: Simulation is provided based on 5µV/V/mmHg. Most sensors are slightly non-linear with the output falling by 2 - 4mmHg (~1%) at 300mmHg (the exact amount depends on the sensor). Most patient monitors compensate for this by (non-linear compensation). Therefore, when testing by simulation many patient monitors will show slightly higher readings than expected especially at the higher pressures. From experience, the typical error at 300mmHg is around +2mmHg, with a maximum of +4mmHg. This “error” is well within the allowable limit of ±12mmHg. On request MEDTEQ can provide special software that simulates a real sensor including specified non-linearity as provided by the sensor manufacturer www.whaleteq.com Page 2 of 13 IBP Precision Simulator | User Manual 2 System Description 2.1 Overview The system consists of the host PC (PS), a USB Module and the device under test (DUT, usually a patient monitor or other equipment for direct measurement of blood pressure). The host PC provides commands to the USB Module to set up relays, or output voltage depending on the mode selected by the user. The USB Module has the following connections: Important note: this system assumes a floating (isolated) measurement circuit in the IBP monitor (i.e. Type CF patient isolation). If the circuit is not isolated, and the system grounds are common, there may be sufficient noise to introduce errors. www.whaleteq.com Page 3 of 13 IBP Precision Simulator | User Manual 2.2 Active simulation When active simulation is selected, the USB Module outputs voltages based on 5µV/V/mmHg. Although most IBP monitors use a nominal supply voltage of 5V (i.e. sensor output of 25µV/mmHg), this voltage is nominal only and typical systems only control this to around ±1%. Therefore, for accurate simulation, the IBP monitor’s supply voltage should be known. The USB module incorporates a function to accurately measure this supply voltage which is then used to calculate the simulation voltage more precisely (e.g. if the supply voltage is 4.980V, the USB module will create voltages based on 24.9µV/mmHg). This function is only performed on demand (i.e. when the user presses the button to measure the voltage), and can only be accessed in the “Off” mode. The user can also override this function at any time and manually enter the supply voltage if required. When dynamic waveforms are output, the waveform data is continuously streamed from the host PC to the USB Module. 2.3 Passive simulation If passive simulation is selected, the output is switched over to an isolated network of resistors which accurately simulate 5µV/V/mmHg to within ±0.1% of full scale. Control of this network is by internal relays. The benefits of this circuit are: (a) It is not necessary to know or adjust for the supply voltage (the resistive network will act proportionally) (b) Less noise (passive, isolated circuit only) (c) Precise: the network has been created out of 0.05% resistors to ensure the 0.1% requirement in IEC 60601-2-34 is met. 2.4 Voltage monitor The voltage monitor connects directly to sensor terminals VD+ and VD-. It allows the user to monitor the actual mV being supplied to the IBP sensor input. This terminal can be used for calibration, or alternately to monitor the applied voltage using a calibrated reference meter during the tests. The latter approach allows you to avoid having to calibrate the WhaleTeq IBP simulator. In some cases the IBP monitoring device (patient monitor) may slightly load the applied voltage. The simulator output impedance is 100Ω. Normally sensor input circuits are high impedance, with negligible loading. However it is possible the input circuits are designed with less than 100kΩ input impedance, in which case the output voltage will drop depending on the impedance (e.g. 10kΩ will cause the output to drop by 1%, 100kΩ by 0.1%). In these cases, the test can still be performed by using a reference meter to monitor the true applied voltage. The sensor voltage can be manually adjusted so that the set mmHg will correspond accurately to the output mV. Example: measured sensor supply voltage is 4.980V, and the sensor was found to have a 1% loading effect (mV output was 1% lower than expected). In this case, setting the sensor supply voltage to 4.980 x 1.01 = 5.030V will compensate for the loading effect. www.whaleteq.com Page 4 of 13 IBP Precision Simulator | User Manual 2.5 2.5.1 Specification Active simulation Parameter Output voltage range Design Specification -1.25mV ~ +8.25mV DAC resolution Overall Accuracy 2.2µV ±5µV1 Output Drift Output Noise Frequency range <2µV / 30 min <2µV Sine: 0 – 40Hz Frequency accuracy Sample rate (waveform streaming) Sensor load resistance ±0.1% 5kHz Sensor voltage measurement accuracy ±0.1% 2.5.2 1.33kΩ Sample rate 5kHz, filtered at 720Hz 50ppm crystal Output filtered at 720Hz Resistance between sensor supply voltage leads Passive simulation Parameter Sensor load resistance Design Specification 1.33kΩ Network accuracy Network values ±0.1% (full scale) 300, 240, 150, 60, 30, 0, -30, 45mmHg 2.5.3 Notes Equivalent to -50mmHg ~ +330mmHg 1 LSB DAC compensation applied for increased accuracy. After 10 min warm up Notes Resistance between sensor supply voltage leads 0.05% resistors used Matches the values in IEC 606012-34 for 300mmHg full scale. Other Parameter Power supply Environment Warm up time Design Specification USB (+5Vdc, 0.3A) +15°C ~ +35°C 35-80% RH 5 min Notes USB high powered mode By design only, not tested <2µV drift after warm up 1 The output divider uses a 100Ω resistor. If the input impedance of the patient monitor measurement circuit is less than 300kΩ, the voltage may be reduced accordingly. If this is suspected, use direct monitoring of the applied voltage as indicated in Section 2.4 www.whaleteq.com Page 5 of 13 IBP Precision Simulator | User Manual 3 Set up 3.1 Software installation 3.1.1 System requirements: The WhaleTeq IBP Simulator system uses a normal PC to interface and control the USB module. The PC should meet the following requirements: - Windows PC (XP or later) Microsoft .NET 2.0 or higher Administrator access (if necessary for installation of software/driver) Free USB port Minimum 512MB RAM The system uses USB streaming based on 300ms packets of data, which means the PC must be able to provide new data every 300ms. For modern PCs, this is a very low demand. However, screen savers, background virus checking and other time based or CPU intensive functions may occasionally interrupt streaming of data. Also, PCs with low RAM (512MB or less) and running many programs (particularly Internet Explorer) may force the PC to continuously use the hard drive which greatly increases the chance of interrupting the streaming of data. For IBP simulation, interruptions are rare and tend to occur only times which are not critical for tests (for example, returning from screen saver). As such, the latest version of software is instructed to ignore streaming errors. In this event the USB module will loop the last 5ms of stored data until the next packet arrives. Users planning on long term simulation should take care to select a PC with sufficient RAM to avoid hard drive access, disable screen savers and background virus checking. 3.1.2 USB driver installation The system uses a USB mode called “CDC” which emulates a serial COM port for which Microsoft Windows® already has the driver for this installed. However, it is necessary to link the USB Module to this driver, which follows a process similar to installing a driver. The linking file “mchpcdc.inf” is available at http://www.whaleteq.com/products_special/35/software Copy this file to a known folder. When the USB is first connected, select manual installation, and point to older containing the above linking file. Continue to follow instruction. There may be a warning that he driver is not recognized by Windows® which can be ignored. This linking file is provided by Microchip® for use with PIC microprocessors having in built USB function. The same linking file is used for all WhaleTeq equipment, and only needs to be installed one time. Depending on policies of IT departments, installation may require administrator access. www.whaleteq.com Page 6 of 13 IBP Precision Simulator | User Manual 3.2 Test set up Connect the patient monitor to the simulator using a cable which exposes the four wires that are normally connected to the sensor (i.e. cutting a normal cable, or using a specially prepared connector). These four wires will be: VS+ = Sensor supply voltage (normally +5V ) VD+ = Sensor differential + output (normally floating) VD- = Sensor differential - output (normally floating) VS- = Sensor supply voltage (normally 0V ) To identify which lead is which, find whichever leads have a stable +5V between them. These will be the VS+ and VS- leads. The remaining leads will be VD+ and VD- respectively, and are typically floating at around 2.5V. In typical flat cables use for pressure sensors, these are in order. If VD+ and VD- are incorrectly identified, it is not a concern as they can be easily swapped after connection. It is noted that some IBP sensors have additional leads which are intended for the patient monitor to identify the sensor. In such cases, users should contact the sensor manufacturer, or measure the resistance to the 0V line to determine the appropriate set up to complete the simulation. 3.3 Environment, noise reduction Due to the very low voltages involved, a noise free environment may be necessary for testing IBP monitors. This can be achieved relatively easily by using a metal bench or metal sheet underneath the DEVICE under test, the USB Module, and also connecting together the ground as shown: With this set up, turn the IBP monitor on and confirm that the level of noise is acceptable for tests. For most tests, this set up is satisfactory without any special efforts. Important note: this system assumes a floating (isolated) measurement circuit in the IBP monitor (i.e. Type CF patient isolation). If the circuit is not isolated, and the system grounds are common, there may be errors introduced. www.whaleteq.com Page 7 of 13 IBP Precision Simulator | User Manual 4 Operation 4.1 Main Screen Functional blocks that are not related to the mode selected are shaded out in normal use. The function to “Measure Sensor Voltage” is available only in the “Off” mode. www.whaleteq.com Page 8 of 13 IBP Precision Simulator | User Manual 4.2 Setting the sensor supply voltage Before using any active simulation mode, the sensor supply voltage must be set, as the output of a real pressure sensor is proportional to the supply voltage. The sensor supply voltage can be set in two ways: 1) Click the button “Measure Sensor Voltage”. The system will automatically measure the supply voltage coming from the patient monitor (or IBP system) Note: this button is only available in the “Off” mode. 2) Click the check box to allow manual adjusting. With this checked, the user can enter voltage manually. For the purpose of calibration, the nominal value of 5.000V is used (so that output is exactly 25µV/mmHg, or 7.500mV for 300mmHg). When the software is started, the default value is 0.000V. If any active simulation mode is selected and the voltage remains at 0.000V, a warning message will be displayed and the sensor voltage set to the nominal value of 5.000V. 4.3 System zero offset Because of the very small voltages involved, there are normally small dc offsets in every system which are significant with respect to the 0.1% full scale specification (±7.5µV). Before testing or performing a calibration check, the user should zero all items of equipment at the same time to eliminate this offset. This includes: - the device under test (IBP or patient monitor) WhaleTeq IBP Simulator (i.e. set up 0.0mmHg) any equipment used to monitor the voltage either directly (at the VD terminals) or at the “Voltage Monitor” terminals For active simulation, this can be with a static output of 0.0mmHg, or in the “Off” mode, after the sensor supply voltage is set. For passive simulation, this can be done with a setting of 0mmHg. With a setting of 0.0mmHg confirmed, zero the patient monitor (IBP function) and any peripheral monitoring equipment. Important note: all metal to metal contact will create small potentials, due to thermal emf’s and oxidation. Use only the terminal block provided (no other terminals, switches etc). Tighten the terminal block firmly (without excess), avoid movement of the terminals, and if testing over very long periods occasionally loosen/retighten the terminals to avoid potentials caused by oxidation. Always re-zero the system after connection to the terminals. In case of doubt about the contact quality, solder directly to the terminals under the terminal block. Allow time to cool to ambient before zeroing the system www.whaleteq.com Page 9 of 13 IBP Precision Simulator | User Manual 4.4 Output static pressures in active mode Voltages simulating static pressures can be output using “Active Simulation (Static / dynamic pressures), and with a frequency setting of 0Hz. In this case, SYS and DIA pressures are ignored, and the static pressure is output based on the MAP (mean arterial pressure) setting. The user can adjust the MAP with the up/down buttons, or type in directly. For direct typing the output does not change until the enter key is pressed. 4.5 Output sine wave pressures in active mode Sine waves can be output using the “Active Simulation (Static / Dynamic pressures), with a frequency other than 0.0Hz. If the SYS value is adjusted, the DIA value is not modified unless the user attempts to set the SYS below DIA value. The MAP is automatically updated based on (SYS+DIA)/2. Similarly, if the DIA value is adjusted the SYS value is not modified unless greater than SYS. MAP is automatically updated. If MAP value is adjusted, SYS and DIA are adjusted by the same amount, provided range limits are not exceeded (50mmHg, +330mmHg). For the alarm tests in IEC 60601-2-34, it is recommended to use the MAP to quickly adjust the pressures higher or lower. The system will only change the pressure after the completion of a full cycle (e.g. 1s at 1Hz). www.whaleteq.com Page 10 of 13 IBP Precision Simulator | User Manual 4.6 Passive simulation When passive simulation is selected, the panel to select the simulation value will be made available. Internally, the USB module will switch over to an isolated network of precision resistors. An audible click of the relays can be heard when changing settings. For highest accuracy, when changing over from active to passive simulation, users should remember to zero the systems again, as the zero offset in the active network may be slightly different to that in the passive network. 4.7 Active simulation, BioSim Mode The BioSim mode refers to a normalized sample of a one beat from a real biological waveform2, which can then be adjusted for heart rate, systolic and diastolic pressures. This waveform is considered more appropriate for testing the ability of the patient monitor to detect SYS, MAP, DIA pressures than testing with sine waves. At a heart rate of 60bpm, monitors usually detect SYS, DIA values correctly. At higher heart rates the test signal is compressed, and has higher frequency components. Some reduction in the indicated SYS value can be expected in this case as patient monitors normally low pass filtering. A large reduction may, for example, indicate the monitor is not suitable for neonatal applications. The profile of the wave is shown as follows: 2 Beat sample data is taken from Physionet database, MGH/MF database, Signal No. MGH002, 13 minutes into the record www.whaleteq.com Page 11 of 13 IBP Precision Simulator | User Manual 4.8 4.8.1 Active simulation, Biological waveforms Background This mode allows streaming of data of sample waveforms from the Physionet website. For WhaleTeq multichannel ECG system (MECG), the software can interface directly with the Physionet website to download a large number of waveforms using Format 16 or Format 212. It was originally intended to adapt this software to allow streaming of arterial blood pressure waveforms as found in the multi-parameter databases such as MGH and MIMIC. However, these multi-parameter databases were found to be difficult to negotiate via a direct download. Storage formats have also be found to be unusual, and many of the blood pressure waveforms are not useful (just noise or static pressure). Therefore, WhaleTeq has taken a small selection of biological waveforms with samples of typically 40-60s, with the primary purpose of demonstrating that the IBP simulator can be used for streaming such waveforms. Users that are interested in streaming real biological waveforms can contact WhaleTeq to arrange a special software interface. Users should take the responsibility to find the appropriate waveforms and extract the data in a simple format. 4.8.2 Output Press the “Select Waveform” button to open a small screen. On this screen select the waveform of interest. The output will automatically start playing the selected record as soon as a waveform is selected. This screen can remain open so users can easily switch between waveforms and view the output. When selecting this mode, the “Biological Waveform Control” panel becomes active, allowing users to start, stop, reset (return to the start) and navigate the waveform in steps of ±10s or ±60s to get to a point of interest. As the current samples provided are only 40s to 60s these function have little meaning and intended for users with longer duration records. The output can be viewed both on the patient monitor and the graphical screen. www.whaleteq.com Page 12 of 13 IBP Precision Simulator | User Manual 5 Trouble shooting Problem USB module not recognized (USB driver is installed correctly) Resolution Recognition of USB devices needs to be done in order: 1) Close MEDTEQ software if open 2) Disconnect the USB module for ~2s 3) Reconnect the USB module 4) Wait for the recognition sound 5) Start MEDTEQ software USB module stops responding Noisy signal (patient monitor) Disconnect the USB module, reconnect the USB module and restart the USB module. Confirm the set up as described in 3.3 is implemented, check grounds are connected using a continuity tester. Confirm the noise level with a static pressure. The sample rates for some patient monitors are less than 10Hz, which means the noise may be a result of sampling rather set up. Confirm with the manufacturer that the patient monitor input is a type which is compatible with simulated signals at 5µV/V/mmHg. 6 Contact details WhaleTeq can be contacted by the following means: Email: Post: Phone: [email protected] No. 17-1, Ln. 131, Sec. 1, Hangzhou S. Rd., Taipei, Taiwan +886 2 2394 8788 www.whaleteq.com Page 13 of 13