1
IBP Precision Simulator | User Manual
2.5
2.5.1
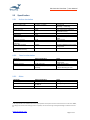
Specification
Active simulation
Parameter
Output voltage range
Design Specification
-1.25mV ~ +8.25mV
DAC resolution
Overall Accuracy
2.2µV
±5µV1
Output Drift
Output Noise
Frequency range
<2µV / 30 min
<2µV
Sine: 0 – 40Hz
Frequency accuracy
Sample rate (waveform
streaming)
Sensor load resistance
±0.1%
5kHz
Sensor voltage
measurement accuracy
±0.1%
2.5.2
1.33kΩ
Sample rate 5kHz, filtered at
720Hz
50ppm crystal
Output filtered at 720Hz
Resistance between sensor supply
voltage leads
Passive simulation
Parameter
Sensor load resistance
Design Specification
1.33kΩ
Network accuracy
Network values
±0.1% (full scale)
300, 240, 150, 60, 30, 0, -30, 45mmHg
2.5.3
Notes
Equivalent to
-50mmHg ~ +330mmHg
1 LSB
DAC compensation applied for
increased accuracy.
After 10 min warm up
Notes
Resistance between sensor supply
voltage leads
0.05% resistors used
Matches the values in IEC 606012-34 for 300mmHg full scale.
Other
Parameter
Power supply
Environment
Warm up time
Design Specification
USB (+5Vdc, 0.3A)
+15°C ~ +35°C
35-80% RH
5 min
Notes
USB high powered mode
By design only, not tested
<2µV drift after warm up
1
The output divider uses a 100Ω resistor. If the input impedance of the patient monitor measurement circuit is less than 300kΩ,
the voltage may be reduced accordingly. If this is suspected, use direct monitoring of the applied voltage as indicated in Section
2.4
www.whaleteq.com
Page 5 of 13