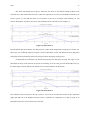
1
ECE-499 REPORT
Telemetry Systems for the Union College
Aero Design Team
Joseph Laub, EE
Joshua Fields, ME, Robert Lattanzi, ME, Ervin Meneses, EE, Matthew Wenner, ME
John Spinelli Ph.D. Advisor
3/18/2015
Laub
1
SUMMARY
The 2015 Union College Aero Team aims to compete in the SAE Aero Design Regular Class competition
this year and it is the goal of this project to provide this team with a telemetry system that will help improve
prototypes and designs while also supplying next year’s team with a system to compete in the Advanced Class
competition. This telemetry system will measure and record information such as altitude, airspeed, and ground speed
while also relaying some of this information, along with a video feed from the aircraft, to a ground station. The
information gained from a telemetry system on a prototype flight will help the engineers designing the aircraft
understand their design better and will help them and future teams improve their designs and models.
The telemetry system has undergone two prototypes that have used the design requirements as the basis of
their design. These systems are named The Yorktown, the first prototype, and The Hornet, the second. The Hornet is
the current and improved system that fulfills more requirements and uses the lessons learned from the first
prototype. This system measures and collects altitude, airspeed, temperature, and takeoff/landing times while the
addition of a GPS device will add location, groundspeed, and UTC time.
The Yorktown was tested on the first prototype aircraft, P1 Murcielago, which flew unsuccessfully and a
broken wire resulted in no telemetry results. The Hornet will be flown on the second prototype aircraft, P2
Murcielago, and with the lessons learned from The Yorktown the current system will be able to record information
for the engineers to use in their design for the final competition aircraft. After the competition this system will be
passed on to next year’s Aero Team so that they may compete in the Advanced Class competition for the first time
in Union College’s history. This system has been built with this goal in mind and has been designed to be easily
broken down and built up with the assistance of a user manual. The Hornet system will give the 2015 Aero Team
better insight into their aircraft once the second prototype aircraft is ready to fly and after the GPS unit is integrated
into the system it will be ready for the 2016 Aero Team and all future Union College Aero Design Teams.
2
Union College 2015 Aero Design Team
Telemetry Systems
TABLE OF CONTENTS
Summary........................................................................................................................................................................ 1
1.0 Introduction ............................................................................................................................................................. 5
2.0 Background.............................................................................................................................................................. 6
2.1 History ................................................................................................................................................................. 6
2.2 Economic............................................................................................................................................................. 6
2.3 Environmental ..................................................................................................................................................... 7
2.4 Manufacturability ................................................................................................................................................ 7
2.5 Health and Safety ................................................................................................................................................ 7
3.0 Design Requirements ............................................................................................................................................... 8
3.1 Competition Requirements .................................................................................................................................. 8
Table 1: Requirements from SAE rules. ............................................................................................................... 8
3.2 Team Requirements............................................................................................................................................. 9
Table 2: Requirements generated by the 2015 Union College Aero Design Team............................................... 9
3.3 Requirements Prioritized ................................................................................................................................... 10
Table 3: Requirements prioritized....................................................................................................................... 10
3.4 Functional Decomposition of the Project .......................................................................................................... 11
Figure 1: Systems and subsystems of the telemetry project. ............................................................................... 12
4.0 Design Alternatives ............................................................................................................................................... 12
4.1 Research ............................................................................................................................................................ 12
4.1.1 Data Acquisition Research ............................................................................................................................. 12
Equation 1 ........................................................................................................................................................... 12
Figure 2: A pitot-static tube where Pt is total pressure and Ps is static pressure.................................................. 13
Equation 2 ........................................................................................................................................................... 13
4.1.2 Communication Protocol Research ................................................................................................................ 14
Figure 3: I2C example circuit. ............................................................................................................................ 15
4.2 Justification of Components .............................................................................................................................. 15
4.2.1 Communication Protocol and Microcontroller Selection ............................................................................... 15
Figure 4: From left to right, Digilent’s chipKIT Max32 Prototyping Platform, the Arduino Mega 2560, and the
Arduino Mini Pro. ............................................................................................................................................... 16
4.2.2 Sensor and Memory Unit Selection ................................................................................................................ 17
Figure 5: Airy 3g Camera (Left). Sony FPV Camera (Right). ............................................................................ 19
4.3 Requirements Met ............................................................................................................................................. 19
Table 4: Requirements met by component selection. ......................................................................................... 20
5.0 Preliminary Proposed Design ................................................................................................................................ 21
5.1 Preliminary Telemetry System Design .............................................................................................................. 21
Figure 6: The preliminary proposed design for the telemetry system. ................................................................ 21
Figure 7: The left plot show the payload in 3D space. The right plot shows this from a side view. ................... 22
Figure 8: A payload path with and without drag forces at 30 mph at 100 feet. .................................................. 23
Laub
3
Figure 9: A payload path with and without drag forces at 10 mph at 100 feet. .................................................. 23
5.2 Preliminary Design Conclusions ....................................................................................................................... 24
Figure 10: P1 Murcielago under construction (left). Top view of the fuselage with The Yorktown (right). ...... 24
6.0 Final Design and Implementation .......................................................................................................................... 25
6.1 Final Design Functional Decomposition ........................................................................................................... 25
Table 5: Breakdown of components for systems and subsystems. ..................................................................... 25
Figure 11: The Hornet block diagram. ................................................................................................................ 26
6.2 Hardware Setup ................................................................................................................................................. 28
Figure 12: DAS hardware diagram. Unused pins not shown. ............................................................................. 28
Figure 13: Ports on the outside of the fueslage. .................................................................................................. 29
Figure 14: FPV system diagram (left) and FPD system diagram (right). The TV monitor’s power source is not
shown in this diagram and would depend on the monitor available. .................................................................. 30
Figure 15: GSDAS diagram. ............................................................................................................................... 30
6.3 Software ............................................................................................................................................................ 31
Figure 16: Flowchart for DAS software. See Appendix K for C++ sketches. .................................................... 31
Figure 17: Example of stored EEPROM data points from The Yorktown system. ............................................ 33
7.0 Performance Estimates and Results ....................................................................................................................... 34
7.1 System Results .................................................................................................................................................. 34
Figure 18: Fake flight testing in the lab. ............................................................................................................. 34
7.2 Requirements Completed .................................................................................................................................. 35
Table 6: Requirements based on Table 3. Green represents completed. Red represented incomplete. Blue
represents unknown. ........................................................................................................................................... 36
Figure 19: Stairwell test 2. .................................................................................................................................. 37
Figure 20: Stairwell test 3. .................................................................................................................................. 37
8.0 Production Schedule .............................................................................................................................................. 38
Table 7: Project milestones and dates. ................................................................................................................ 39
9.0 Cost Analysis ......................................................................................................................................................... 40
Table 8: Project costs and totals without shipping. ............................................................................................. 40
10.0 User Manual ........................................................................................................................................................ 41
11.0 Conclusions and Future Work ............................................................................................................................. 41
12.0 Acknowledgments ............................................................................................................................................... 41
13.0 References ........................................................................................................................................................... 42
14.0 Appendices .......................................................................................................................................................... 42
Appendix A ............................................................................................................................................................. 42
Appendix B ............................................................................................................................................................. 43
Appendix C ............................................................................................................................................................. 43
Appendix D ............................................................................................................................................................. 43
Appendix E.............................................................................................................................................................. 44
Appendix F .............................................................................................................................................................. 44
Appendix G ............................................................................................................................................................. 44
Laub
5
1.0 INTRODUCTION
The goal of this project is to design and build a telemetry system that can be used to test and improve
prototype aircraft for the 2015 Union College Aero Team while also preparing the 2016 team with the means to
compete in the Advanced Class competition. A telemetry system is a system that automatically measurers and
collects data from a place that is not accessible by normal means of testing. For example, a system that can measure
and collect data from an unmanned aircraft during flight would be considered a telemetry system. Altitude, airspeed,
groundspeed, location, and time are examples of measurements that could be made on an aircraft.
The 2015 Union College Aero Team will compete in the SAE Aero Design Regular Class Competition on
April 24th through the 26th. Teams must design and build an aircraft that is capable of carrying as much weight as
possible, the goal this year is 28 pounds, while adhering to design requirements such as size, power, and materials.
No telemetry system is required for the Regular Class competition; however, a telemetry system would be beneficial
to testing prototypes for the competition. This would allow the engineers designing and building the aircraft to
gather information about the aircraft while it is in flight. Past Union College Aero Teams have never obtained
empirical data about their aircraft during flight. This creates a gap from year to year as teams are not able to quantify
past performances. A telemetry system would solve this problem and give future teams better results to start from.
The Advanced Class competition’s challenge is different than the Regular Class competition. Teams must
design and build an aircraft that can drop a three pound humanitarian aid package, represented as a sandbag, onto a
target from at least 100 feet. This competition does require a telemetry system that can gather altitude data as well as
transmit a video feed from the aircraft to the copilot on the ground. The pilot is not allowed to see the video feed and
must fly the aircraft by sight. The copilot uses the video feed to help the pilot line up the aircraft over the target
zone, a circle with a 50 foot radius, and then releases the package over the target. It is the copilots mission to hit the
target and the pilots mission to fly the aircraft. The telemetry system required is integral to this process. Just as an
aircraft’s flight would be considered failed if the aircraft crashed, any failure in the telemetry system is also
considered a failed flight. The telemetry system is why Union College has never competed in the Advanced Class.
The 2015 team has electrical engineers and mechanical engineers, making it the first interdepartmental Union
College Aero Design Team. This telemetry system will be mounted in the aircraft and will collect and store data
from sensors, transmit data to a ground station, and provide a video feed for the copilot. The system will not only be
6
Union College 2015 Aero Design Team
Telemetry Systems
used this year for post-flight analysis of test flights and prototypes, but it will also allow Union College to compete
in the Advanced Class competition for the first time next year.
2.0 BACKGROUND
2.1 HISTORY
The Union College Aero Team has competed in the SAE Aero Design competition since 2004. In the past
two years the team has placed in the top 10 out of more than 40 schools from countries all over the world. Last year
the SAE Aero Design rules began mandating an electric motor with a 1000 Watt limit rather than a combustion
motor which changed the strategies of the teams. This year is the first time that electrical engineering majors have
been a part of the Union College Aero Team. Having two electrical engineers to work with the electric propulsion
system and the telemetry system, for the advance class competition, will help diversify the team’s skills and design a
better aircraft.
The 1000 Watt limit and the lack of actual data from the aircraft in flight were not addressed last year. In
order to stay under the 1000 Watts limit the team chose a system that operated at a much lower power so that any
noise in the system would never peak above 1000 Watts. Accurate speed and altitude data were never collected
during flight which left this year’s team only with performance estimates of last year’s aircraft. This lack of
information makes it more difficult to learn from last year’s mistakes and accomplishments because it is impossible
to quantify their flight performance. Since there was no telemetry system implemented last year, this project does
not have pervious Union College telemetry systems to learn from.
2.2 ECONOMIC
Building the aircraft will be expensive and last year’s team spent approximately $13,000 by the end of the
project. This cost included everything such as building materials and the cost of travel down to Georgia for
competition. There is no telemetry system budget from last year’s team to approximate this project’s budget.
However, the Student Research Grant at Union College typical provide $500 maximum for projects such as this
senior thesis. $500 will be the base amount for this project and the goal will be to spend no more than $500 since
this is the typical maximum amount allowed for grants. However, due to previous grants this project was not
eligible. Instead the Electrical and Computer Engineering Department at Union College will pay for the project
materials and components. No set amount was given from the department and so a $500 maximum was assumed.
Laub
7
To fund travel and shipping expenses for this project, outside funding along with the Student Conference
Travel Grant were sought out. A $2500 grant from James Taylor, a $500 grant from Schneider Electric, and a $600
travel grants for each team member will pay for shipping and travel costs for the competition. This combined $3600
is not solely for telemetry systems, but it is for the entire team which includes this project. A full breakdown of costs
and expenses can be seen in section 9.0 of this report.
2.3 ENVIRONMENTAL
The environmental issues and problems associated with this project mainly concern the power source of the
aircraft, a lithium-polymer battery. The rules mandate the use of a lithium-polymer battery, more specifically a 6 cell
lithium-polymer battery. 1 If the battery were to become damaged at any point then it will not only become
dangerous, but it will also pose an environmental risk as well. The lithium in the battery could ignite and result in a
combustion reaction that would be dangerous to the surroundings. However, because the competition now uses
batteries and not gasoline, as it did for years, carbon emission has been reduced. There is risk involved with lithiumpolymer batteries but these batteries are safer and more environmentally friendly than gasoline engines.
2.4 MANUFACTURABILITY
The telemetry system designed and built this year will not only be used for this year’s aircraft, but it will
also be used for next year’s team as well. This means that this system needs to be constructed so that it can be rebuilt
and modified easily. The system should be modular in its design and should be able to be moved around the aircraft
in case of last minute aircraft design alterations or fixes. Sensors should be easily replaceable in the event of a crash
and this should be a simple process. Therefore, sensors were designed to be connected using standard jumper wires
and headers. An in-depth user manual was written so that next year’s team could easily rebuild the system and begin
testing. Components and their datasheets have been logged in an accessible place for future teams and this should
allow Union College to use this system for competitions and testing for any aircraft that is built.
2.5 HEALTH AND SAFETY
There are several safety issues associated with this project. There is a 6 cell battery operating close to 1000
Watts and a motor that is being rotating at approximately 6000 rpm. When using the 6 cell battery it will draw close
to 40 A or more of current to reach 1000 Watts of power at 22 V. This amount of current and power could be fatal if
1
Dong, Lonnie R. 2015 Aero Design® East and West. Rep. SAE International, 30 Aug. 2014. Web. 21 Nov. 2014.
<http://students.sae.org/cds/aerodesign/rules/2015_aero_rules.pdf>.
8
Union College 2015 Aero Design Team
Telemetry Systems
not handled properly. If the two battery leads short out the battery it could be destroyed and could ignite. If a
propeller became detached it could critically injure somebody. Because of these dangers several precautions were
taken when testing to motor. Appendix A shows the procedure for charging the battery so that it does not damage
cells and risk exploding. Doing this safely is critical for running tests on the motor. If the battery is charged
incorrectly it could be damaged and even ignite.
When the motor is being tested with the propeller it is important for people to be out of the way and in a
safe location. Appendix B lays out how to set up the test bed for testing the motor safely. If the propeller were to
become detached from the motor it would likely fly forward, however, it could also fly outward from the motor.
This is why safety glasses are worn during tests and why people always stand behind the motor.
3.0 DESIGN REQUIREMENTS
The design requirements for the telemetry system stem from two main sources. The SAE International
2015 Collegiate Design Series: Design Aero East and West Rules and the Union College 2015 Aero Design Team.
3.1 COMPETITION REQUIREMENTS
The SAE International 2015 Collegiate Design Series: Design Aero East and West Rules clearly layout the
requirements of a telemetry system and a data acquisition system (DAS). Table 1 below outlines the different
requirements taken from the competition rules.
Table 1: Requirements from SAE rules.
Requirement
Rule Section
Altitude must be monitored in real-time at a ground station.
5.1.13
Must record the altitude at the moment the payload is released.
5.1.13
Altitude must be measured with the precision of ± 1 ft.
5.1.14
The DAS must have a visible read-out at the ground station.
5.1.14
The DAS must include an arming/reset switch.
5.1.14
The DAS cannot use the flight control frequency (2.4 GHz).
5.1.14
Must include a first person view (FPV) system onboard the aircraft with a ground station display.
5.1.16
There are not many requirements that concern the telemetry or DAS and most of these requirements pertain to
altitude. However, any failure of the DAS during flight or any violation of these requirements will result in a missed
Laub
9
flight attempt. Making sure that these requirements are met and that none of the rules are violated is a top priory for
this project. These requirements are considered the mandatory project requirements.
3.2 TEAM REQUIREMENTS
Making a telemetry system for next year’s competition is not the only goal of this project. The other goal of
this project is to provide a system for the current Union College Aero Design Team so that the engineers designing
the prototypes can learn more about their aircraft in flight. The mechanical engineers were able to provide several
ideas concerning what would be useful to them during the design process. Table 2 shows a list of features desired by
the team and why these are important.
Table 2: Requirements generated by the 2015 Union College Aero Design Team.
Requirement
Monitor airspeed
Justification
Airspeed will help the team analyze the performance of the aircraft in flight. This
can also be used to estimate the maximum takeoff weight of the aircraft which
will help find the maximum payload weight.
Monitor groundspeed
Groundspeed and altitude are used to calculate the path the payload would take
when released from the aircraft. This allows the team to calculate how far ahead
of the target the payload needs to be dropped in order to score.
Record location
Location would let the team plot the path of the aircraft after a flight.
Ample non-volatile onboard
Having enough memory onboard the aircraft for an entire flight would allow the
memory
analysis of stored data post-flight. Non-volatile memory would ensure saved data
even in the event of a power loss.
Record takeoff/landing time
Having a way of knowing when the aircraft took off and when it landed so that
airspeed could be recorded at those moments.
Accelerometer data
Measuring the amount of force the aircraft endures during a flight could help the
team quantify safety factors for design.
Gyroscopic data
This data could bring insight into how the aircraft performed inflight. This would
be useful for determining how much shake or flutter the aircraft endured.
10
Union College 2015 Aero Design Team
Failsafe drop
Telemetry Systems
Having a failsafe drop method so that the package could not be dropped unless the
aircraft were above 100 feet would ensure that that rule was never violated.
Data FPV overlay
Overlaying the data transmitted to the ground station onto the first person display
(FPD) would allow the copilot to monitor the data and watch the FPV feed all the
in the same place.
Transmit all data
Transmitting all of the data stored on the aircraft would allow real-time
performance evaluation of the aircraft while in flight.
User Interface (UI) panel
A panel that can be mounted on the outside of the aircraft so that the telemetry
system can be controlled without the use of a computer.
3.3 REQUIREMENTS PRIORITIZED
Prioritizing these requirements helped determine the functional decomposition of the project. Since some of
these requirements are more important than others, Table 3 was created to organize the project. Requirements are
listed in three categories: M for mandatory, I for primary, and II for secondary. Each requirement also has a project
requirement number (PR#) so that it may be referenced later.
Table 3: Requirements prioritized.
PR#
Requirement
Priority
PR1
Altitude must be monitored in real-time at a ground station.
M
PR2
Must record the altitude at the moment the payload is released.
M
PR3
Altitude must be measured with the precision of ± 1 ft.
M
PR4
The DAS must have a visible read-out at the ground station.
M
PR5
The DAS must include an arming/reset switch.
M
PR6
The DAS cannot use the flight control frequency (2.4 GHz).
M
PR7
Must include a FPV system onboard the aircraft with a ground station display.
M
PR8
Ample non-volatile onboard memory.
I
PR9
Minimize weight of telemetry system.
I
PR10
Minimize size of telemetry system.
I
Laub
11
PR11
Single low power source (Advanced Class only).
I
PR12
Use motor battery as power source (Regular Class only).
I
PR13
Monitor airspeed.
I
PR14
Monitor groundspeed.
I
PR15
Record location.
I
PR16
Transmit altitude data.
I
PR17
Project cost less than $500.
II
PR18
Recording takeoff/landing time.
II
PR19
UI panel.
II
PR20
Accelerometer data.
II
PR21
Gyroscopic data.
II
PR22
Failsafe drop.
II
PR23
Data FPV overlay.
II
3.4 FUNCTIONAL DECOMPOSITION OF THE PROJECT
With the requirements defined they can be assigned to different systems within the project. These four
systems are: the FPV System, DAS, FPD system, and ground station data analysis system (GSDAS). Figure 1
outlines the four systems, their subsystems, and where they are implemented.
12
Union College 2015 Aero Design Team
Telemetry Systems
Figure 1: Systems and subsystems of the telemetry project.
4.0 DESIGN ALTERNATIVES
With the requirements set and prioritized in Table 3 the selection of components and methods began. First,
research was done to determine different methods of acquiring data such as altitude and groundspeed. Then a
protocol for communicating with sensors was selected as well as memory unit solutions and microcontroller
selection.
4.1 RESEARCH
4.1.1 DATA ACQUISITION RESEARCH
It was found that the most common method of measuring altitude was through the measurement of
atmospheric pressure. By measuring the pressure and the subsequent changes in that pressure the change in altitude
can be determined using the Barometric Formula, Equation 1. Where m is the mass of one molecule, k is the
Boltzmann’s constant, g is gravity, h is height, T is temperature, P0 pressure at ground level, and Ph is pressure
measured above ground level.
𝑷𝑷𝒉𝒉 = 𝑷𝑷𝟎𝟎 𝒆𝒆−𝒎𝒎𝒎𝒎𝒎𝒎/𝒌𝒌𝒌𝒌
(1)
Laub
13
This method is susceptible to error as the local pressure changes throughout the day. Over a long period of time the
altitude measurements become less reliable. Altitude can also be measured using a Global Positioning System (GPS)
receiver. This is can be done if four or more satellites are being received, however, GPS is inaccurate due to the
slight variations in altitude and large distances to satellites. Even under ideal conditions this can be accurate to about
50 feet which does not agree with PR3 in Table 3.
Altitude may also be measured using ultrasonic or sonic methods and the amount of time the reflection
takes to return to the sensor. At a consumer level this is only capable of short ranges such as 25 cm, the longer range
sonic altimeters are expensive and not within the scope of this project. The consumer level method of recording
altitude with ultrasonic is not sufficient because the range is extremely small.
Measuring airspeed can be done through the use of pressure with a pitot-static tube. Pictured in Figure 2,
this tube uses the difference of total and static pressure to calculate velocity, Equation 2.
Figure 2: A pitot-static tube where Pt is total pressure and Ps is static pressure.
𝒗𝒗𝟐𝟐 =
𝟐𝟐(𝑷𝑷𝒕𝒕 −𝑷𝑷𝒔𝒔 )
𝝆𝝆
(2)
Equation 2 solves for airspeed, v, by dynamic pressure, 𝑃𝑃𝑡𝑡 − 𝑃𝑃𝑠𝑠 , and dividing by the air density, 𝜌𝜌. This is a common
technique and is known as the indicated airspeed (IAS).
Calibrated airspeed (CAS) uses the pitot-static tube as well, however, it attempts to correct for errors in the
measured static pressure. A pitot-static tube must face directly forward on an aircraft such that the air flowing over
the tube is perpendicular to the holes for static pressure. If the tube has been mounted incorrectly or the aircraft yaws
14
Union College 2015 Aero Design Team
Telemetry Systems
suddenly the static pressure measurement may be inaccurate. This is more difficult to calculate than IAS, however, it
is more accurate.
Groundspeed differs from airspeed in that airspeed is the aircraft’s speed relative to the air around it and
groundspeed is the speed relative to the earth below it. Groundspeed is important for calculating the projectile
motion of a payload drop from an aircraft. Methods researched for calculating groundspeed were found using
landmarks, airspeed and wind speed, and GPS. If the distance between two landmarks is known then the time it
takes to get from one to another can be used to calculate groundspeed. This can be accurate if the distance known is
accurate and if the time it takes to pass over each landmark is timed accurately. However, this is impractical in that
the aircraft would have to fly directly over two known landmarks and the groundspeed would only be known for a
moment. Image processing would make this possible but difficult, time consuming, and expensive.
Groundspeed can also be found by using airspeed and wind speed. By summing the airspeed and wind
speed in the direction of the aircraft, groundspeed can be calculated with ease. However, measuring the wind speed
at the ground is not necessarily the wind speed at the aircraft and this method proves to be easy theoretically but
difficult practically. GPS calculates groundspeed by measuring the distance between two locations and time at those
two locations. This calculates groundspeed easily and is much more accurate than finding altitude with GPS since it
is easier to detect lateral and longitudinal movement rather than movement normal to the earth.
4.1.2 COMMUNICATION PROTOCOL RESEARCH
The research done for the information to be measured in the above section meant that sensor
instrumentation would be a large part of the project. Communication with these sensors to read and save their data is
a central aspect of the project. This is the DAS and it was decided that this would be done through the use of a
microcontroller because of past experience and knowledge of C++. Two methods were researched and considered
for this project, the first being serial peripheral interface (SPI) and the second being inter-integrated circuit (I2C).
SPI is a protocol commonly used in embedded systems similar to this project. SPI uses four wires, not
including power and ground, to communicate with sensors. These serial wires carry the serial clock (SCLK), the
master out slave in (MOSI), master in slave out (MISO), and the slave select (SS). When communicating with one
slave device, such as a sensor, the SS is fixed and communication is essentially a three-wire system. The master,
such as a microcontroller, sends read or write commands using MOSI to the slave and the slave sends information
back across the MISO line. However, when multiple slave devices attempt to connect to the four serial buses the
Laub
15
communication becomes more complicated as the SS line must switch which slave to communicate with. SPI works
well for embedded systems with fewer slave devices and less size constraints since four wires are required for
communication this uses more pins on a microcontroller.
I2C protocol is similar to SPI in that a master device can control several slave devices; however, I2C only
uses two wires, not including power and ground. These two serial lines are the serial clock (SCL) and serial data
(SDA) lines. I2C is designed for multiple slave devices because each I2C compatible device has its own one byte
address. Figure 3 below outlines a typical I2C circuit where the master device may be a microcontroller and the
slave devices may be sensors.
Figure 3: I2C example circuit.
Communicating with multiple sensors along the same serial buses reduces the amount of wires and pins that needed
to be used by the microcontroller. This can be done because I2C sensors all have their own individual addresses. To
read or write data from a sensor the master sends out the specified address and gets an acknowledge back from the
sensor. Then the master knows to wait and receive data from the sensor or to write information, depending on the
slave and command. This allows for quick communication since each slave has its own predetermined address in the
datasheet and since this protocol is used regularly there is ample documentation for troubleshooting and design as
well as many devices made to be I2C compatible.
4.2 JUSTIFICATION OF COMPONENTS
4.2.1 COMMUNICATION PROTOCOL AND MICROCONTROLLER SELECTION
Before selecting components and parts for the DAS it was decided to use the I2C protocol instead of the
SPI protocol. This was because I2C’s two wire protocol would require fewer pins than the SPI method. The SPI
method was found to be more complex with many variations that would not integrate easily with each other. Since
16
Union College 2015 Aero Design Team
Telemetry Systems
I2C only uses two data wires, for a total of four wires with power and ground, sensors can be daisy chained together
and operate without using a complicated SS method. Fewer wires comply with PR9 and PR10 from Table 3 and
simplify the overall design of sensor instrumentation.
Three microcontrollers were considered for this project, Digilent’s chipKIT Max32 Prototyping Platform,
the Arduino Mega 2560, and the Arduino Mini Pro.
Figure 4: From left to right, Digilent’s chipKIT Max32 Prototyping Platform, the Arduino Mega 2560, and
the Arduino Mini Pro.
The Digilent’s chipKIT Max32 Prototyping Platform was already in the possession of the Union College Aero
Design Team and was therefore in compliance with PR17 for minimizing the cost of the project. However, this
microcontroller was poorly documented when compared with the Arduino microcontrollers. The Arduino Mega
2560 is similar to the Digilent’s chipKIT Max32 Prototyping Platform in its size and weight but it is better
documented and has many examples online. The Arduino Mini Pro is much smaller than the other two
microcontrollers; however, it is more difficult to prototype with since the pins do not come equipped with headers
already in place.
At the beginning of this project the chipKIT Max32 Prototyping Platform was tested first with an airspeed
sensor from last year’s Aero Team. This airspeed sensor, the EagleTree Airspeed MicroSensor V3, is I2C
compatible but proved very difficult to interface with the chipKIT Max32 Prototyping Platform. The decision was
made to switch to the Arduino Mega 2560 due to its increased documentation and I2C examples online as well as its
many pins and headers for easy prototyping. This microcontroller was able to communicate successfully with the
I2C airspeed sensor was adopted for the preliminary telemetry system design. The Arduino Mini Pro replaced the
Laub
17
Arduino Mega 2560 for the final design of the system due to its decreased size and weight. Having fewer pins was
not an issue due to the two wire I2C method.
4.2.2 SENSOR AND MEMORY UNIT SELECTION
With the Arduino Mega 2560 or Arduino Mini Pro selected, depending on either the preliminary or final
design, sensor components and a memory unit were selected. The EagleTree Airspeed MicroSensor V3, pictured in
Appendix C was selected primarily because the Aero Team already owned this device from last year’s team. This
sensor was built for a premade telemetry system package; however, it has a standalone I2C mode which was used
for this project. Research into other airspeed sensors was considered but not seriously perused.
Altimeter selection was based on the research in section 4.1.1 of this report and it was decided to use the
pressure to altitude technique. This was because it was more accurate than GPS and the ultrasonic range was
inadequate. The MPL3115A2 and BMP180 were the primary considerations for this project. Both sensors are
designed for I2C protocol and both claim to be within the one foot precision range which complies with PR3 in
Table 3. The difference between the two was in there documentation. The MPL3115A2 had great detail in its
documentation and provided an example sketch for the Arduino microcontrollers. This sample sketch would make
understanding the sensor easier and this was why the MPL3115A2 was chosen, pictured in Appendix D.
GPS is unique in that there is a standard for receiving information set by the National Marine Electronics
Association (NMEA). NMEA sentences are comma separated lines that a GPS unit outputs serially. Each line begins
with a data type which defines how the rest of the sentence is to be interpreted. For example, a sentence starting with
‘$GPGGA’ is the Fix Information sentence with a set number of commas. These sentences can be understood
because there is an order of information per data type. In the ‘$GPGGA’ sentence the information between the first
and second commas contains the Coordinated Universal Time (UTC) information from the satellites. Between the
first and second commas will always be the UTC time following the Fix Information data type sentence. Since GPS
is structured in a known way it is easy to determine what these sentences convey with online resources that help
decode the sentence structure. However, this also means that a GPS unit outputs NMEA sentences serially and a
parsing technique has to decode information in real-time if only specific data points are needed such as
groundspeed.
I2C GPS devices are not common due to the method that GPS units output their data. The Navigation V2,
which uses the GTPA010 GPS unit and pictured in Appendix E, attempts to access this data using an I2C breakout
18
Union College 2015 Aero Design Team
Telemetry Systems
board. This breakout board and I2C compatible device was chosen for the project so that the sensors could be used
on the same I2C data bus. Adding a serial communication device would complicate the design and use more pins on
the microcontroller.
The VL6180 Time of Flight sensor, pictured in Appendix F, was donated to this project by Jim Hedrick.
This sensor used IR and the time delay of the reflection to measure the distance to the reflecting surface. Measuring
altitude with this sensor is not possible since its range is 25 cm, however, mounting this sensor on the bottom of the
fuselage of the aircraft would allow the system to determine takeoff and landing time. When the sensor reads a value
of about three inches, the distance from the runway to the fuselage when grounded, then the aircraft is on the
runway. If the sensor reads a 25 cm, the maximum, the aircraft is in the air. This information can be used along with
the other information onboard to the aircraft to mark the times in which the aircraft took off and landed.
To analyze this information on the aircraft post-flight, the information needs to be stored onboard the
aircraft. Transmitting all of the data to a ground station includes the possibility of losing information or receiving
incorrect data. Therefore, storing information in a non-volatile memory unit is required as seen in PR8. The
microcontrollers in Figure 4 have built-in Electrically Erasable Programmable Read-Only Memory (EEPROM) that
is non-volatile. The Arduino Mega 2560 has 4096 bytes and the Arduino Mini Pro has 512 bytes of storage. This
was one of the contributing factors for selecting the Arduino Mega 2560 originally. However, as sensors were added
to the project and more was learned about storing information and the length of flights it was determined that more
than 4096 bytes of space would be needed. For example, if 20 bytes of information need to be recorded, the
estimated amount based on all of the sensor outputs, at a sample time of 0.5 seconds, then at 4096 bytes only about
1.7 minutes of information may be stored. Flights at competition were found to average about 2.5 minutes based on
videos found from last year’s competition. Using the onboard EEPROM space on the Arduino Mega 2560 does not
meet PR8; therefore, other solutions were explored. The I2C EEPROM 256 kbit, Appendix G, component fulfills
PR8 by containing 32,768 bytes of space which equates to approximately 13.7 minutes of flight information based
on the parameters given in the example earlier. This component was also selected for it I2C compatibility, allowing
it to be easily integrated into the system on the I2C buses.
PR1 and PR16 require that altitude be monitored at the ground station. To accomplish this a transmitter and
receiver pair was chosen. The 434 MHz RF Link Transmitter and the 315 MHz RF Link Transmitter are both able to
transmit data wirelessly to a matching receiver at the ground station. Using a form of Amplitude Shift Keying (ASK)
Laub
19
the transmitters transmit bits over their given frequencies. The 315 MHz transmitter’s 5th harmonic overlaps with the
GPS’s frequency of 1575.42 MHz. Therefore, the 434 MHz transmitter, shown with the receiver in Appendix H,
was chosen to avoid interference.
The FPV and FPD system components were selected by greatly considering PR9 and PR10 from Table 3.
Reducing the size and weight of these components was essential in their selection because a camera such as the
GoPro was considered too large and heavy. The cameras shown in Figure 5 below were the two smallest
commercially available cameras found on the market.
Figure 5: Airy 3g Camera (Left). Sony FPV Camera (Right).
The Airy 3g camera was selected because of the clear weight and size reductions compared to the Sony FPV Camera
where the Airy weighs 3 grams the Sony weighs 71 grams. The Sony FPV Camera’s main advantages are price, $40
cheaper, and the swivel arm that could be connected to the aircraft. The camera could be easily rotated for a more
precise angle; however, the size and weight advantages of the Airy 3g Camera are more important to the project than
the swivel arm advantage. The Airy 3g Camera also has a recommended Boscam Transmitter and Receiver pair,
pictured in Appendix I, which help simplify the FPV and FPD systems. The receiver RCA plugs can connect to any
monitor with RCA ports.
4.3 REQUIREMENTS MET
Through the selection of these components most of the mandatory and priority I requirements were filled
along with some of the priority II requirements. Table 4 below shows which requirements had been met by which
component and how.
20
Union College 2015 Aero Design Team
Telemetry Systems
Table 4: Requirements met by component selection.
PR#
PR1
Status
Filled
How
434 MHz transmitter to receiver and Arduino Mega 2560 connected to a laptop and serially
monitoring software.
PR2
TBD
Future work.
PR3
Filled
MPL3115A2 altimeter’s precision within one foot.
PR4
Filled
434 MHz transmitter to receiver and Arduino Mega 2560 connected to a laptop and serially
monitoring software.
PR5
Filled
Arduino microcontrollers contain reset switches.
PR6
Filled
No components operate at 2.4 GHz.
PR7
Filled
Airy 3g Camera and Boscam Transmitter/Receivers
PR8
Filled
I2C EEPROM 256 kbit component.
PR9
Filled
Microcontroller, components, and I2C protocol selected to reduce weight.
PR10
Filled
Microcontroller, components, and I2C protocol selected to reduce size.
PR11
Filled
A 9 V battery powers the Arduino Mini Pro which steps down and regulates 3.3 V for components.
PR12
Filled
A voltage divider can be used to step down voltage from 6 cell motor battery.
PR13
Filled
EagleTree Airspeed MicroSensor V3 component.
PR14
Filled
Navigatron V2 component.
PR15
Filled
Navigatron V2 component.
PR16
Filled
434 MHz transmitter/receiver components.
PR17
Filled
See section 9.0 for cost analysis.
PR18
Filled
VL6180 Time of Flight sensor.
PR19
Filled
See section 6.0 for UI design.
PR20
Future Work
See section 11.0 for future work.
PR21
Future Work
See section 11.0 for future work.
PR22
Future Work
See section 11.0 for future work.
PR23
Future Work
See section 11.0 for future work.
Laub
21
5.0 PRELIMINARY PROPOSED DESIGN
5.1 PRELIMINARY TELEMETRY SYSTEM DESIGN
The preliminary proposed design for the telemetry system project was named The Yorktown. This was
designed during the fall of 2014 and was the telemetry system on the aircraft up until January of 2015 when it was
replaced by the design in section 6.0 named The Hornet. From the systems and subsystems of Figure 1 from section
3.4, The Yorktown consisted of the DAS, the FPV system, and the FPD system. However, given the cost of the FPV
and FPD systems these were never mounted on the aircraft due to concerns of possible crash before the competition.
The GPS, memory unit, transmitter, and UI had not been designed or implemented yet. The preliminary proposed
design block diagram can be seen below in Figure 6.
Figure 6: The preliminary proposed design for the telemetry system.
22
Union College 2015 Aero Design Team
Telemetry Systems
Most of the work on The Yorktown was related to the DAS. The design includes the MPL3115A2 altimeter and the
EagleTree Airspeed MicroSensor V3. Using these two sensors airspeed, altitude, and temperature were recorded.
Temperature was recorded as a placeholder for other variables in future designs.
At the beginning of this project research was done for the Advanced Class competition by simulating the
drop of a three pound humanitarian aid package. When the aircraft is airborne it will be collecting data and relaying
altitude, airspeed, and groundspeed to the ground station. Latitude and longitude are not relevant for the copilot at
the ground station. This information can then be processed and the estimated amount of lead distance to the target
can be computed.
MATLAB was used to simulate the fall of a three pound payload from a given altitude and groundspeed.
Taking drag forces into account, a simulated fall from the aircraft from 100 feet at 10 mph, a reasonable speed for a
slow flying aircraft based on videos from past competitions, can be seen in Figure 7.
Figure 7: The left plot show the payload in 3D space. The right plot shows this from a side view.
Appendix J shows the full MATLAB script for calculating these paths. The script uses the altitude and the velocities
of the aircraft which will be found by the sensors in the DAS. From these simulations it was determined that drag
forces are not influential to the accuracy of the payload drop and can be ignored to simplify the calculation. Figure 8
shows the difference of two identical drops, one with drag forces and one without.
Laub
23
Figure 8: A payload path with and without drag forces at 30 mph at 100 feet.
Here 30 mph was chosen for a faster aircraft because drag forces are dependent partially on velocity so the larger the
velocity the larger the drag. Figure 8 shows that the difference the drag force makes is only about 2 meters at a
higher speed. If the aircraft were flying slowly over the target the difference the drag forces make are negligible as
seen in Figure 9 below, therefore, they can be ignored.
Figure 9: A payload path with and without drag forces at 10 mph at 100 feet.
The fall of 2014 was largely focused on the simulation and research of the telemetry system. By the end of
the winter break The Yorktown system was operating as expected with altitude and airspeed being recorded. The
ChipKit Max32 Prototyping Platform was used as the microcontroller for the DAS in the beginning. But due to
24
Union College 2015 Aero Design Team
Telemetry Systems
issues interfacing with the airspeed sensor this microcontroller was replaced with the Arduino Mega 2560 in
November of 2014.
5.2 PRELIMINARY DESIGN CONCLUSIONS
In December of 2014 the first prototype aircraft, P1 Murcielago, had finished construction and was ready
for testing. The Yorktown had been tested in the lab prior to the test of the aircraft and was installed in the fuselage
of the aircraft for the first test flight.
Figure 10: P1 Murcielago under construction (left). Top view of the fuselage with The Yorktown (right).
P1 Murcielago was tested on December 15th, 2014 and suffered two crashes. The first test was conducted to get the
aircraft moving forward, as if down a runway. The aircraft swerved into a snowbank and the front landing gear was
destroyed and no telemetry data was gathered from this test.
The second test was conducted in the field house at Union College and the telemetry system was tested
before use. However, at some point before or during testing the SCL wire broke off of the Arduino Mega 2560 and
no data was recorded during the field house tests. The aircraft was able to takeoff but stalled due to the angle of the
wing. The aircraft crashed nearly immediately after takeoff and P1 Murcielago was decommissioned shortly after.
From testing The Yorktown system several lessons were learned about circuit construction, test procedures,
and code structure. Solid wire is more prone to breaking than stranded wire because of its stiffness. The SCL line in
The Yorktown was a solid wire and it snapped off in the microcontroller header. At the time of these test flights only
the 4096 bytes of EEPROM space were available on the Arduino Mega 2560. This meant that test runs had to be
under two minutes and this restricted the team’s ability to test quickly. The code structure needed to be changed to
Laub
25
allow for a start and stop function so that data acquisition could be paused while other members of the team are
preparing the aircraft for the next test.
6.0 FINAL DESIGN AND IMPLEMENTATION
6.1 FINAL DESIGN FUNCTIONAL DECOMPOSITION
Figure 1 in section 3.4 outlines the systems and subsystems implemented in the final design for the
telemetry system. This design of the telemetry system, named The Hornet, includes all four systems and their
subsystems. Table 5 breaks down the components for each system and subsystem along with the voltage
requirements of each device. Figure 11 below, illustrates the block diagram for The Hornet.
Table 5: Breakdown of components for systems and subsystems.
System
Subsystem
Component
Voltage Requirements
Minimum (V)
Maximum (V)
First Person View
Camera
Airy 3g Camera
5.0
16.0
System
Video Transmitter
Boscam 5.8 GHz FPV Transmitter
7.4
14.8
Microcontroller
Arduino Mini Pro
7.0
12.0
Memory Unit
I2C EEPROM 256kbit Chip
1.7
5.5
Data Transmitter
434 MHz RF Link Transmitter
1.5
12.0
FTDI Port
3.3
5.0
Red LED
N/A
N/A
Yellow LED
N/A
N/A
Push Button
N/A
N/A
200 Ω Resistor
N/A
N/A
200 Ω Resistor
N/A
N/A
300 Ω Resistor
N/A
N/A
EagleTree Airspeed MicroSensor V3
3.0
16.0
MPL3115A2 Altimeter
1.95
3.6
Navigatron V2 GPTA010 GPS
3.0
5.0
VL6180 Time of Flight
2.6
3.3
Data Acquisition
User Interface
System
Sensors
26
Union College 2015 Aero Design Team
Telemetry Systems
First Person Display
Video Receiver
Boscam 5.8 GHz FPV Receiver
7.4
13.0
System
Display
Any video monitor with RCA ports
N/A
N/A
Data Receiver
434 MHz RF Link Receiver
4.9
5.0
Microcontroller
Arduino Mega 2560
7.0
12.0
Information
Computer with Arduino Software
N/A
N/A
Ground Station
Data Analysis
System
Display
Figure 11: The Hornet block diagram.
The FPV system is made up of two subsystems, the camera and video transmitter. These can both be
powered by a 3 cell 11.1 V battery or they can use voltage from a 6 cell battery that is stepped down with a voltage
divider or regulator. This system has been tested in the lab using a HD TV with RCA connectors; it has not been
mounted to the aircraft for test flights due to risk of damages.
Laub
27
The DAS is made up of four subsystems, two of which overlap. The memory unit subsystem and the
sensors subsystem overlap because the memory unit, which is an I2C EEPROM chip, is I2C compatible like the
sensors. This means that the memory unit and sensors operate on the same I2C bus which reduces the amount of
pins required by the board and the amount of wires needed for the hardware. The sensors are connected using the
I2C bus and a 3.3 V power line and ground line can power each component. All of the sensors chosen for this
subsystem were chosen for the 3.3 V output of the Arduino Mini Pro. The sensors have a wide range of voltage
requirements, however, 3.3 V works for each of the components.
The data transmitter subsystem is made up of just the 434 MHz Transmitter which can also be powered by
the 3.3 V output of the Arduino Mini Pro or by the power source of the Arduino Pro which is a 3 cell 11.1 battery, or
a 9 V battery for testing in the lab. In order to maximize the signal strength of this component the supply voltage
should be as large as possible. By using the 11.1 V battery instead of the 3.3 V output, the signal should be more
powerful and therefore have a larger range.
The UI subsystem was built out of six components, which includes three resistors. Two LEDs, a red LED
and a yellow LED, are connected to pins 3 and 4 on the Arduino Mini Pro. These two LEDs are used to let the user
know from a glance what the approximate status of the telemetry system is. If the system has power then the red
LED is on. If the system is working, as in acquiring data, zeroing altitude, reading, or clearing data then the yellow
LED is on. The pushbutton was designed for starting and stopping the telemetry system instead having to connect it
to a computer via USB.
The FTDI port allows the FTDI pins on the Arduino Mini Pro to be accessed via a mini USB. This allows a
computer to be connected and can act as a serial output for troubleshooting or control. The FTDI port is used in the
UI as the downloading port for the information saved onboard the aircraft. The user can connect a mini USB to USB
cord to the FTDI port and their computer. Then they will be prompted with the option to read the information saved
on the I2C chip, they may also clear this information.
The GSDAS uses three components to interpret the information sent from the aircraft. A data receiver, the
434 MHz Receiver, receives the information from the DAS and is connected to an Arduino Mega 2560. The
microcontroller is then able to process the information and eliminate noise using the Virtual Wire library for
Arduino microcontrollers. Then the information can be outputted to the computer serially and read with a serial
communication software such as the Arduino Integrated Development Environment (IDE) software or puTTY.
28
Union College 2015 Aero Design Team
Telemetry Systems
6.2 HARDWARE SETUP
The hardware design for this was broken down into the four systems with the DAS being the most
complex. The FPV, FPD, and GSDAS systems did not require as much design because of their relative simplicity.
Figure 11 below shows the hardware design for the DAS.
Figure 12: DAS hardware diagram. Unused pins not shown.
The I2C bus seen in Figure 12 is critical to the DAS. This is where all of the sensors and the memory unit get their
commands and information. The microcontroller cannot receive or send information without the SCL and SDA lines
and the power and ground lines are used by multiple subsystems. Pins 2, 3, and 4 are used for the UI and to simplify
the design the pins uses the GND and 3.3V bus lines to reduce pin usage and wire length. The transmitter also uses
the 3.3V and GND lines from the bus, however, alternative designs have had the VCC input of the transmitter
connect to the positive terminal on the battery for a more powerful signal.
The FTDI port connects to the Arduino Mini Pro with a six-wire jumper cable and having a USB port that
is independent of the microcontroller has been beneficial to the design of the system. The FTDI board has the USB
port needed to interface with the microcontroller and because it is separate it can be moved around on the aircraft
Laub
29
without having to relocate the microcontroller. In the second prototype of the aircraft a slot was made for the USB
port and the UI. This makes it easier to connect to the port from the outside of the aircraft.
Figure 13: Ports on the outside of the fueslage.
There was no design process needed for the FPV or FPD systems. These systems were simplified by the
selection of pre-made subsystem components. The only assembly needed is connecting the power, camera, and
monitors to the transmitter or receiver. Figure 14 below shows two diagrams for both the FPV and FPD systems.
Both the transmitter and receiver have built-in antennas that are not shown in the diagrams.
30
Union College 2015 Aero Design Team
Telemetry Systems
Figure 14: FPV system diagram (left) and FPD system diagram (right). The TV monitor’s power source is not
shown in this diagram and would depend on the monitor available.
The GSDAS uses only two components and a computer to display the information received from the
aircraft. The microcontroller is the Arduino Mega 2560, which has a built-in USB connection, and it can be powered
from the computer that it is connected to. Figure 15 shows the setup of the microcontroller and the data receiver, the
USB to computer serial connection is not shown in this diagram.
Figure 15: GSDAS diagram.
Laub
31
6.3 SOFTWARE
To control the four sensors and store data several sketches had to be written in the Arduino IDE software
which uses a modified C++ programming language. This system gives the user three options when powered on and
connected with a USB cable to computer. The user may run the data acquisition mode, read the EEPROM memory,
or clear the EEPROM memory. This can be done by sending the microcontroller a ‘1,’ ‘2,’ or ‘3’ serially from the
computer. The data acquisition loop may also be started by pressing the push button on the UI. If the data
acquisition loop has been started it can also be stopped by pressing the push button. Figure 16 below shows the
flowchart for the DAS diagram, this is order of events that take place when the system is powered on.
Figure 16: Flowchart for DAS software. See Appendix K for C++ sketches.
Reading and clearing the memory is a quick process that allows the user the reset the system for the next
flight. When the memory is being read or cleared the yellow LED on the UI will become solid to indicate that the
system is working and it will turn off when it is finished. If the data acquisition loop is chosen, then the LED will
blink once to indicate that it is zeroing altitude; then it will become solid once it is zeroed and acquiring data. An
entire dataset is acquired every 0.5 seconds and one variable is measured at a time during this dataset. Time is the
first value that is measured and this is obtained from the Arduino Mini Pro’s clock in the microcontroller. Time is
32
Union College 2015 Aero Design Team
Telemetry Systems
used for post-flight analysis and is recorded in milliseconds. This variable uses two bytes of EEPROM space per
measurement on the EEPROM chip.
Airspeed is the found from the Airspeed MicroSensor V3 and is recorded in miles per hour. This variable
only requires one byte of space from the EEPROM per data point. Then pressure is found from the MPL3115A2 and
is used to calculate altitude in feet. One byte per data point is allocated for this variable. Temperature is then
measured from the MPL3115A2 and is in Fahrenheit. This information requires one byte per data point and even
though this variable is not of major post-flight analysis importance, it is still recorded because of its availability on
the MPL3115A2.
The VL6180 range finder information is measured after the MPL3115A2. This returns the range in
centimeters from the bottom of the fuselage to the ground. However, due to its short range it will return 25.5cm
when the aircraft is airborne. This is because nothing is within its range and so it returns the maximum value it can
measure. This information will be useful for determining if the aircraft is on the runway or not and it requires one
byte of EEPROM space per data point.
The GTPA010 GPS is the last sensor to be used during each loop. It returns latitude, longitude, UTC time,
and groundspeed. Latitude and longitude will be interesting to examine after a flight and could be used to plot the
path the airplane took during flight. Both latitude and longitude require four bytes each of EEPROM space. UTC
time is the time from the satellites and this information will be used to help determine when the flight took place.
Due to the precision of the UTC time this requires four bytes of space on the EEPROM chip per data point.
Groundspeed is an important measurement for calculating the lead time to a target with altitude. This is the last
measurement and is recorded in meters per second. Groundspeed requires two bytes of EEPROM space per data
point.
After acquiring all of the data for the current dataset, some of the information needs to be scaled because of
the way in which some sensors return values. Altitude information calculated from pressure is divided by 100 to
scale it down to feet. Some of the other information is scaled up by devices, however, it is kept this way and postflight analysis compensates for this known scaling. The groundspeed, UTC time, and location data have all been
scaled by 100 to make them integers for storage and they are scaled down during in the post-flight analysis.
Each variable is stored on the EEPROM chip one at a time. EEPROM data can be explained as two
columns of data, addresses on the left and data on the right. The EEPROM chip contains 32,768 addresses that can
Laub
33
be written to one at a time. Data is written to one address and then the next data point is written to the incremented
address and so on. This creates one column of mixed data points; however, because the method of writing data is
known then the pattern of the data can be separated out during analysis. Figure 17 illustrates this two column
explanation and how the order of data can be predicted.
Figure 17: Example of stored EEPROM data points from The Yorktown system.
Since the pattern of the information in the column is known, it can be extracted easily using a MATLAB script
developed for the project, Appendix L.
After the information has been saved the altitude information is then transmitted to the ground station. Then
the loop checks the push button and if it has been pressed it enters standby mode, else it continues looping. When
the system enters standby mode the next ten addresses on the EEPROM space have the value 255 written to them.
When reading the memory, the read function knows where to stop when reading all of the data because ten 255 data
points in a succession indicates a stop. It would be inefficient to read all of the 32,768 addresses onboard the chip if
large amounts haven’t been used. This minimizes the time that the user has to wait while the data is read from the
EEPROM chip.
34
Union College 2015 Aero Design Team
Telemetry Systems
7.0 PERFORMANCE ESTIMATES AND RESULTS
7.1 SYSTEM RESULTS
The Hornet system is the current design of the telemetry system for this project and can be seen in Figure
11 from section 6.1. This system was completed with the exception of the GPS component. The Navigatron V2,
which uses the GTPA010 GPS, was selected for its ability to communicate with a microcontroller using the I2C
protocol. However, this device was never successful in communicating over the I2C bus. The component was tested
serially to determine if it was functioning correctly and when using a serial communication method it is able to
return the NMEA sentences with accurate location and time information. A parser sketch was developed to read the
information serially from the GPS; however, it is still under development and has not been integrated into the overall
Hornet design yet. The GPS component is the only incomplete component from the Figure 11 diagram.
The remainder of the system works as expected in the lab and results have been produced by lifting the
system up and down and imitating a flight. Figure 18 below shows a fake flight test using all of the components with
the exception of the GPS.
Fuselage Range Finder
(mm)
Air Speed
(miles/hour)
Air Speed Plot from file fakeFlight.txt
100
50
0
0
20
0
20
0
20
0
20
40
100
120
40
60
80
Time (seconds)
Altitude Plot from file fakeFlight.txt
100
120
40
100
120
100
120
60
80
Time (seconds)
Fuselage Range Finder Plot from file fakeFlight.txt
400
200
0
Altitude
(feet)
20
10
Temperature
(F)
0
60
80
Time (seconds)
Temperature Plot from file fakeFlight.txt
65
64.5
64
40
60
Time (seconds)
80
Figure 18: Fake flight testing in the lab.
Laub
35
This test shows the system working as expected. The airspeed plot shows several spikes as someone blew into the
airspeed sensor to simulate airflow. The VL6180 range finder returns approximately 40 mm when the ‘aircraft’ is
close to the ground and 255 mm when it is ‘airborne.’ The MPL3115A2 shows altitude as the system was raised up
and down in the lab by fishing wire. The zero point for altitude in this test was 10 feet. This was done so that
negative numbers were not recorded when the altitude data drifted by a few feet. Temperature data is shown in the
fourth plot but it is insignificant.
This information was interpreted by the MATLAB file “EEPROMRead.m” seen in Appendix L.
“EEPROMRead.m” was written to accept a comma separated file such as .txt or .csv. It reads the column of data and
parses the information based on a user input of the order and length of data.
The Hornet has not been tested in an aircraft because the second prototype aircraft, P2 Murcielago, has not
been completed yet. The system is ready to be tested once the aircraft’s fuselage has been finished. If the aircraft is
able to fly data will be recorded on the telemetry system and will be analyzed using the same method that the fake
flight was analyzed.
When test flights take place they will be recorded on two main cameras. A high frames per second (FPS)
camera will be used to monitor the takeoff and landing of the aircraft. This will be placed facing normal to the
runway so that the aircraft runs left to right on the screen. By setting up a meter stick on the runway distance can be
measured and then the time the aircraft takes to cross this distance will determine its speed. This will be compared to
the airspeed measurement at that moment to determine its accuracy. To determine when that moment was a second
camera will be used. By filming the yellow LED with a handheld camera the timecode of the video file and the time
of the data acquisition can be synced. This way, when reviewing the footage, viewers can look at the plot of data and
match any time on the plot to the synced footage from the camera. This combines the video and the data for a visual
and empirical analysis post flight.
7.2 REQUIREMENTS COMPLETED
The competition that this year’s team is competing in is April the 24th through the 26th. Work on the
telemetry system will continue and the final design of the system, The Enterprise, will become the final system
based off of The Hornet. The Enterprise system will incorporate the GPS and will be packaged in a custom 3D
printed package. This will allow the team to easily install or uninstall the telemetry package on or off the aircraft. To
date, Table 6 shows which requirements that have been completed.
36
Union College 2015 Aero Design Team
Telemetry Systems
Table 6: Requirements based on Table 3. Green represents completed. Red represented incomplete. Blue
represents unknown.
PR#
Requirement
Priority
PR1
Altitude must be monitored in real-time at a ground station.
M
PR2
Must record the altitude at the moment the payload is released.
M
PR3
Altitude must be measured with the precision of ± 1 ft.
M
PR4
The DAS must have a visible read-out at the ground station.
M
PR5
The DAS must include an arming/reset switch.
M
PR6
The DAS cannot use the flight control frequency (2.4 GHz)
M
PR7
Must include a FPV system onboard the aircraft with a ground station display.
M
PR8
Ample onboard non-volatile memory.
I
PR9
Minimize weight of telemetry system.
I
PR10
Minimize size of telemetry system.
I
PR11
Single low power source (Advanced Class only)
I
PR12
Use motor battery as power source (Regular Class only)
I
PR13
Monitor airspeed.
I
PR14
Monitor groundspeed.
I
PR15
Record location.
I
PR16
Transmit altitude data.
I
PR17
Project cost less than $500.
II
PR18
Recording takeoff/landing time.
II
PR19
UI panel
II
PR20
Accelerometer data.
II
PR21
Gyroscopic data.
II
PR22
Failsafe drop.
II
PR23
Data FPV overlay.
II
Laub
37
PR3 states that altitude must be precise within one foot; however, the altitude retuned by MPL3115A2
sometimes has a drift characteristic that may violate this requirement. In some tests the altitude measured by the
sensor is precise to a foot and other times it is off by three or four feet. For example, when climbing a 31 foot
staircase the altimeter was able to provide accurate information most of the time as seen in Figure 19.
Figure 19: Stairwell test 2.
Filtered altitude data means that the first data point was a spike which disrupted the zeroing process for this test.
These tests were conducted using The Yorktown system in December of 2014. The Hornet has been designed to
compensate for these preliminary spikes by throwing out outliers during the zeroing process.
In MATLAB, the information was shifted down and the first data point corrected. The Figure 19 test
showed that at the top of the stairwell, the system was measuring 31.65 feet. This precision satisfies PR3; however,
the data in Figure 20 shows that the max altitude was 34.18 feet which does not satisfy PR3.
Figure 20: Stairwell test 3.
Since altitude is based on pressure, this test is prone to a lot of noise from heat and weather. If the competition
judges base PR3 off of the datasheet then this sensor is sufficient for competition, but if PR3 is based off of
performance then a new sensor will need to be selected.
38
Union College 2015 Aero Design Team
Telemetry Systems
PR2 is incomplete because no payload drop mechanism has been constructed. However, this requirement
will not be difficult for next year’s team to fulfill. When the drop mechanism is activated a flag byte can be sent to
the ground station via the transmitter onboard the telemetry system. This flag byte indicates when the drop
mechanism was activated and the altitude information sent directly after this flag will be the altitude at the time of
the drop. PR22 also pertains to the drop mechanism and this can be achieved by only allowing the drop command to
be sent if the previous altitude measurement was above 100 feet.
Using the main battery on the aircraft as the system’s power source has not been completed because work
on other aspects of the project took priority. This requirement, PR12, will be completed if the team decides that the
telemetry package will fly on the competition aircraft and not just the prototypes. PR14 and PR15 both depend on
the GPS’ integration into the system and this will be completed during the design of The Enterprise system.
PR20, PR21, and PR23 are goals that would bring more information and streamlined use to the team. These
goals are considered future work and are not within the scope of this project. If more time was available then these
components could be researched and integrated, but there is not enough time before the competition to focus on
secondary goals such as these.
8.0 PRODUCTION SCHEDULE
The majority of the fall of 2014 was spent researching components, protocols, and techniques that could be
applied to this project. In December of 2014 the first prototype was completed and tested unsuccessfully; however,
lessons were learned and work on the second prototype, The Hornet, started shortly after. Table 7 below indicates
milestones and updates as they occurred over the course of this project.
Laub
39
Table 7: Project milestones and dates.
Date
Milestones
10/6/2014
Preliminary research and requirements completed.
10/13/2014
chipKit Max32 Prototyping Platform and airspeed sensor testing.
10/20/2014
MATLAB projectile simulation begins, continued chipKit Max32 and airspeed testing.
10/27/2014
MATLAB projectile simulation shows drag and groundspeed relevance to path of payload drop.
11/3/2014
EEPROM and I2C research completed. I2C protocol selected for sensor communication design. FPV
and FPD components ordered.
11/10/2014
I2C software testing and research with chipKit Max32 Prototyping Platform. Altimeter component
research begins.
11/17/2014
Arduino Mega 2560 is selected as the microcontroller. Arduino Mega 2560 and MPL3115A2 ordered.
12/9/2014
Arduino Mega 2560, MPL3115A2, and Airspeed MicroSensor V3 interfacing successfully. The
Yorktown is designed, built, and tested. GPS component ordered.
1/14/2015
Research for The Hornet design and GPS testing begins.
1/23/2015
Continued GPS troubleshooting. RF link components and Arduino Mini Pro ordered.
1/30/2015
The Hornet system is built with the Arduino Mini Pro and the UI.
2/11/2015
Data transmitter and receiver tested successfully and continued GPS I2C testing.
2/20/2015
GPS I2C communication method replaced with serial communication method.
2/27/2015
The Hornet system is finished with the exception of the GPS integration. The Enterprise system design
begins.
Inefficiencies in this project can be attributed to the GPS selection and the initial chipKit Max32
Prototyping Platform tests. The chipKit Max32 Prototyping Platform was tested for several weeks because it was
already owned and did not need to be ordered. This microcontroller was unable to interface with the airspeed sensor
and was eventually replaced by the Arduino Mega 2560. Had the Arduino Mega 2560 been selected earlier, a couple
weeks could have been saved. The GPS selected for this project was intended to work with the I2C bus; however, it
was unable to communicate using this protocol. Troubleshooting took many weeks and it was determined that the
40
Union College 2015 Aero Design Team
Telemetry Systems
documentation available for the I2C GPS was inadequate. Had the selection of the GPS been more careful, then this
could have been avoided, however, the GPS currently works with a serial communication method.
9.0 COST ANALYSIS
The total cost of the components and materials for this project was $379.18 as seen below in Table 8.
Table 8: Project costs and totals without shipping.
Item
Cost/Item
Quantity
Total
Airy 3g Mini Camera
$69.90
1
$69.90
Boscam 5.8Ghz FPV System
$139.90
1
$139.90
MPL3115A2
$14.95
1
$14.95
Arduino Mega 2560
$43.09
1
$43.09
Break Away Headers - Straight
$1.50
1
$1.50
Jumper Wire - 0.1", 4-pin, 12"
$1.95
4
$7.80
ProtoBoard - Square 2"
$2.95
1
$2.95
Navigatron v2
$59.89
1
$59.89
Arduino Pro Mini 328 3.3 V
$9.95
1
$9.95
FTDI Basic Breakout 3.3 V
$14.95
1
$14.95
Jumper Wire - 0.1", 6-pin, 6"
$1.50
1
$1.50
RF Link Transmitter - 434MHz
$3.95
1
$3.95
RF Link Receiver - 434MHz
$4.95
1
$4.95
I2C EEPROM - 256kbit
$1.95
2
$3.90
Total Expenses
$379.18
This satisfies PR17’s goal of $500, however, this does not take into account shipping costs for the various
components. Travel costs to competition are not included in this table, because these are being covered through a
Student Conference Travel Grant and donation money to the Union College Aero Design Team.
Laub
41
10.0 USER MANUAL
The user manual for this project can be seen in Appendix M. This manual is intended for next year’s team
and was written so that anyone may take the telemetry system and install it on an aircraft. The user manual is subject
to change based on future work of The Enterprise system.
11.0 CONCLUSIONS AND FUTURE WORK
The goal of this telemetry system project was to design and build a system that could be used for testing
prototypes and for the Advanced Class competition. The current system, The Hornet, accomplishes most of the goals
set in Table 3. This system is ready to be installed on an aircraft and flown for testing as soon as the current
prototype aircraft is complete. Work will continue and The Enterprise system will become the final telemetry system
for next year’s team. By designing this system to fulfill the telemetry and data acquisition requirements set for the
Advanced Class competition, next year’s team can focus on the aircraft design and not the telemetry. It is not
possible to classify the success of this project until the prototype aircraft has flown and data is recorded. The
outcome of the test flight with the telemetry system will determine if this project has been a success for this year’s
team. Lab tests and simulations have been able to prove that this system works, however, no field tests have been
completed to this date. The telemetry system project will continue past the scope of this capstone project to make
sure that next year’s team can compete in the Advanced Class competition for the first time in Union College’s
history.
12.0 ACKNOWLEDGMENTS
Brad Bruno
John Butkus
Gene Davison
Josh Fields
Lisa Galeo
Jim Hedrick
Robert Lattanzi
Ervin Meneses
Schneider Electric
John Spinelli
James Taylor
Matthew Wenner
42
Union College 2015 Aero Design Team
Telemetry Systems
13.0 REFERENCES
[1] Dong, Lonnie R. 2015 Aero Design® East and West. Rep. SAE International, 30 Aug. 2014. Web. 21 Nov.
2014. <http://students.sae.org/cds/aerodesign/rules/2015_aero_rules.pdf>.
[2] Himpe, Vincent. Mastering the I²C Bus. Susteren: Elektor International Media, 2011. Print.
[3] Hojnacki, Richard. "Electric Propulsion System & Test Bed Design Senior Project 497 Report." Thesis. Advisor.
Ashok Ramasubramanian. Union College, 2013. Print.
[4] Hojnacki, Richard. "Electric Propulsion System & Test Bed Design Senior Project 498 Report." Thesis. Advisor.
Ashok Ramasubramanian. Union College, 2014. Print.
[5] (). . Available: http://www.helipal.com/airy-3g-mini-camera.html.
[6] (). . Available: http://www.helipal.com/boscam-5-8ghz-fpv-system-500mw.html.
[7] (). . Available: http://www.helipal.com/sony-700tv-lines-ccd-camera-pal.html.
14.0 APPENDICES
APPENDIX A
1.
2.
3.
4.
5.
6.
7.
8.
9.
10.
11.
12.
13.
14.
Make sure the battery is in the fireproof container/bag.
Before plugging in the EZ Peak Plus charger.
a. Connect the multicolored connectors from the battery to the appropriate spot on the balance
adapter board (You’ll know you’re correct because it only fits on way).
i. 4s batteries to the 4s slot, 6s batteries to the 6s slot, etc.
b. Connect the power cable deans connectors (from battery) to the deans connectors on the charger.
Plug in the AC power cord for the EZ Peak Plus charger to the closest outlet.
Use the “STOP/BATTERY TYPE” key to select the “PROGRAM SELECT LiPo BATT” category.
Press “ENTER/START” to advance to the “LiPo CHARGE” screen.
Use the “STATUS/+/-” key to scroll to the “LiPo BALANCE” screen and press “ENTER/START.”
a. The amp rate value will flash on and off.
Use the “STATUS/+/-” key to scroll the amp rate up or down to the desired rate.
a. To find desired rate take the capacity of the battery divided by 1000.
i. mAh/1000 = amp rate
Press the “ENTER/START” key again.
a. Battery voltage will flash
Use the “STATUS/+/-” key to adjust the voltage up or down to match the voltage and cell count indicated
on the battery.
Press and hold the “ENTER/START” key.
a. Charge will chime and display “BATTERY CHECK WAIT...”
Next the display will show “R: #SER S: #SER” to indicate the number of cells the charger detected (R) and
the number you selected (S).
a. If these values do not match press “STOP”
b. DO NOT start charging if values do not match.
If these values match press “ENTER/START”
As the pack charges the display will show the battery type, cell count, charge rate, pack voltage, charge
time, and amount of milliamps the pack is receiving.
When completed it will display “FULL”
Laub
43
15. To stop charging press “STOP”
APPENDIX B
1.
2.
3.
4.
5.
6.
7.
8.
9.
10.
11.
12.
13.
14.
15.
16.
17.
18.
19.
Find a large, open, and empty room for testing.
Move the test bed to a safe location in the room so that people are not likely to walk by the spinning propellers.
Place damping blocks (foam) underneath the corners of the test bed.
Place a 10 lb weight flush up against the back rail of the test bed.
Mount the motor to the front of the test bed and tighten.
Attach the propeller to the front of the motor.
Double check that the bolt holding the propeller on the motor is in fact secure.
Attach the leads of the motor to the electronic speed controller (ESC).
Connect the deans power leads from the power limiter to the deans power leads on the ESC.
a. If the ESC does not have deans connected already. Solder deans connectors to the power leads.
Connect to the “Programmer” output of the ESC to any open connection on the receiver.
Use the blank signal connection from the ESC to connect to the power limiter.
a. Ensure that the blue wire from the power limiter connects to the white wire from the ESC.
Connect the remaining signal connection from the power limiter to the throttle on the receiver.
Attach the wattmeter to the deans connectors on the power limiter.
a. If no deans connectors attached, solder then on the meter’s leads.
Make sure you are standing behind and clear of the motor. DO NOT stand to the sides of the spinning
propellers and wear goggles.
Place battery in wooden box.
Attach deans connections from the battery to the watt meter.
a. If no deans connectors, solder them in place.
b. The watt meter will light up, indicating the battery voltage, current, and power.
Before activating the transmitter, make sure throttle (left stick) is at zero (all the way down).
Power on the transmitter. You should hear a series of beeps and the motor will stall a little bit.
a. If you see a flashing orange light on the receiver, then the transmitter is not bound. Refer to “Binding
Procedure” for more information.
You are now able to run the motor with the transmitter and begin a testing procedure.
APPENDIX C
APPENDIX D
44
APPENDIX E
APPENDIX F
APPENDIX G
APPENDIX H
APPENDIX I
Union College 2015 Aero Design Team
Telemetry Systems
Laub
APPENDIX J
payloadDrop.m attached below.
45
Humanitarian Aid
Package Drop Simulation
Table of Contents
Reset Workspace .................................................................................................................
User Defined Constants ........................................................................................................
Equations ...........................................................................................................................
Initialize Constants ..............................................................................................................
Calculations ........................................................................................................................
Create Target Circle ............................................................................................................
Plot Results ........................................................................................................................
Results ..............................................................................................................................
Joseph Laub
2015 Union College Aero Design Team
Telemetry Systems Engineer
11/14/14
This script is intended for the Union College Aero Design Teams for the
SAE Advanced Class Competition. A simulated payload drop of a
humanitarian aid package from a moving aircraft onto a circle target.
This script uses gravity and drag forces to simulate the drop from any
altitude and velocity. The User Defined Constants section can be used to
change the simulate to the needs of the user.
The lead distance and lead time to the target are returned. This is how
far ahead of the target area the payload needs to be dropped in order to
hit the center of the target.
Contact Info: [email protected]
Note that axes are defined as:
x is axis parallel to center axis of aircraft (forward and backward)
y is axis perpendicular to center axis of aircraft (left and right)
z is altitude (up and down)
Reset Workspace
close all
clear
clc
User Defined Constants
altitude = 100; % feet
xSpeed = 30; % mph
1
1
1
2
2
2
3
3
5
Humanitarian Aid Package Drop Simulation
ySpeed = 0; % mph
zSpeed = 0; % mph
r = 0.05; % meters, radius of payload package
tr = 50; % feet, radius of target
m = 3; % pounds, max of package
CD = 0.6; % Estimated from:
% <http://www.engineeringtoolbox.com/drag-coefficient-d_627.html>
Equations
Drag Force Equation F_D = 1/2 rho v^2 C_D A
Initialize Constants
% Coverstions
mphToMetersSecond = 0.44704;
metersSecondToMPH = 1/0.44704;
feetToMeters = 0.3048;
metersToFeet = 1/0.3048;
% Initial Conditions
alt = altitude; % Feet
vx0 = xSpeed; % mph
vy0 = ySpeed; % mph
vz0 = zSpeed; % mph
%Initial conditions converted into metric
alt = alt*feetToMeters; % Meters, drop height
vx0 = vx0*mphToMetersSecond; % m/s, initial x
vy0 = vy0*mphToMetersSecond; % m/s, initial y
vz0 = vz0*mphToMetersSecond; % m/s, initial z
of 100 feet = 30.5 meters
velocity
velocity
velocity
% Coefficents
rho = 1.225; % kg/m^3
CD;
% Constants
A = pi*r^2; % Area of package, estimated as a 5cm radius
g = 9.81; % Gravity, m/s/s
m = m*0.453592; % mass of package, kg
targetR = tr*feetToMeters; % Radius of target area meters
dt = 0.01; % Time step
n = 0; % Step stopping number
Calculations
vy(1)
vx(1)
vz(1)
dx(1)
=
=
=
=
vy0;
vx0;
vz0;
0;
2
Humanitarian Aid Package Drop Simulation
dy(1) = 0;
dz(1) = alt;
i = 1;
while dz(i) >= 0
az = -g + 0.5*rho*CD*A*vz(i)^2;
% acceleration in z-direction
vz(i+1) = vz(i) + az*dt;
% velocity in z-direction
dz(i+1) = dz(i) + vz(i)*dt + 0.5*az*dt^2; % new distance in z
ax = -0.5*rho*CD*A*vx(i)^2;
% acceleration in x-direction
vx(i+1) = vx(i) + ax*dt;
% vecocity in x-direction
dx(i+1) = dx(i) + vx(i)*dt + 0.5*ax*dt^2; % new distance in x
ay = -0.5*rho*CD*A*vy(i)^2;
% acceleration in y-direction
vy(i+1) = vy(i) + ay*dt;
% vecocity in y-direction
dy(i+1) = dy(i) + vy(i)*dt + 0.5*ay*dt^2; % new distance in y
i = i + 1;
end
leadTime
= (length(dx)-1)*dt;
leadDistance = dx(length(dx)-1);
Create Target Circle
theta = 0:pi/50:2*pi;
targetX = targetR * cos(theta) + leadDistance;
targetY = targetR * sin(theta);
Plot Results
if max(dx) > max(dz)
axisLimit = ceil(max(dx)*1.15);
else
axisLimit = ceil(max(dz)*1.15);
end
figure;
str1 = (['Aircraft traveling at <', num2str(xSpeed), 'x, ',...
num2str(ySpeed), 'y, ', num2str(zSpeed), 'z> mph, Altitude: ',...
num2str(altitude), ' ft']); % Makes the title for figure
plot3(dx, dy, dz, 'r','LineWidth',2); hold on
plot3(targetX, targetY, zeros(length(targetX)), 'b--');
axis([0 axisLimit -axisLimit/2 axisLimit/2 0 axisLimit]);
axis square
title(str1);
xlabel('X-Direction (meters)');
ylabel('Y-Direction (meters)');
zlabel('Z-Direction (meters)');
legend('Projectile Path', 'Target Area');
3
Humanitarian Aid Package Drop Simulation
grid ON
figure;
str2 = (['Aircraft traveling at <', num2str(xSpeed), 'x, ',...
num2str(ySpeed), 'y, ', num2str(zSpeed), 'z> mph, Altitude: ',...
num2str(altitude), ' ft (Side View)']); % Makes the title for figure
plot(dx, dz, 'r', 'LineWidth', 2);
axis([0 axisLimit 0 axisLimit]);
title(str2);
xlabel('X-Direction (meters)');
ylabel('Z-Direction (meters)');
legend('Projectile Path');
grid ON
4
Humanitarian Aid Package Drop Simulation
Results
leadDistance = max(dx)*metersToFeet;
disp(['Lead Distance: ' num2str(leadDistance), ' feet']);
disp(['Lead Time: ' num2str(leadTime), ' seconds']);
disp([char(10) 'Done with payloadDrop.m']);
Lead Distance: 106.1988 feet
Lead Time: 2.53 seconds
Done with payloadDrop.m
Published with MATLAB® R2014a
5
Laub
51
APPENDIX K
Telemetry Hornet sketches below.
telemetryHornet
// Joseph Laub
// 2/21/15
// Telemetry System Prototype 2
// Code name Hornet
// Prototype system to be used on the Aircraft Murcielago 2
//-----------------------------------------------------------------------------------------------------------------------------// Arduino Library Setup
#include <Wire.h>
// For the i2c bus
#include "Arduino.h"
// For communicating with the EagleTree Air Speed Sensor V3
#include "MPL3115A2.h"
// For communicating with the MPL3115A2
#include <EEPROM.h>
// Load the EEPROM library
#include <VirtualWire.h> // Load Virtual Wire Library so that RF ground link can be established.
#include <SFE_VL6180X.h> // Load the VL6180 Library for Time of Flight sensor
#include <Average.h>
MPL3115A2 myPressure;
//Create an instance of the object for altitude sensor
const int onLEDPin = 4; // Red LED
const int infoLEDPin = 3; // Yellow LED
const int buttonPin = 2; // Button on the User Interface Board
#define VL6180X_ADDRESS 0x29
VL6180xIdentification identification;
VL6180x sensor(VL6180X_ADDRESS);
void setup() {
Serial.begin(115200);
Serial.println("Telemetry System v2.0: Hornet");
Wire.begin(); // Join i2c bus
pinMode(onLEDPin, OUTPUT);
pinMode(infoLEDPin, OUTPUT);
pinMode(buttonPin, INPUT);
if(sensor.VL6180xInit() != 0){
Serial.println("FAILED TO INITALIZE"); //Initialize device and check for errors
};
sensor.VL6180xDefautSettings(); //Load default settings to get started.
// vw_set_ptt_inverted(true); // Required for RF Link Module
52
Union College 2015 Aero Design Team
// vw_setup(1200);
// vw_set_tx_pin(1);
// Bits per second
// pin 1 used a as the transmit data out into the TX link module
// Get sensor online
myPressure.begin();
myPressure.setModeBarometer(); // Measure pressure in Pascals from 20 to 110 kPa
myPressure.setOversampleRate(7); // Set Oversample to the recommended 128
myPressure.enableEventFlags(); // Enable all three pressure and temp event flags
delay(1000);
}
Serial.println("System Setup Successfully");
digitalWrite(onLEDPin, HIGH);
Serial.println("Enter 1 for Data Acquisition Mode");
Serial.println("Enter 2 for Read EEPROM Mode");
Serial.println("Enter 3 for Clear EEPROM Mode");
int buttonState = 0; // variable for reading the pushbutton status
int byteRead = 0;
boolean waiting = true;
void loop() {
waiting = true;
delay(1000);
while (waiting == true) {
buttonState = digitalRead(buttonPin);
if (Serial.available()) {
byteRead = Serial.read();
}
if (buttonState == HIGH) {
Serial.println("DATA ACQUSITION MODE SELECTED");
}
dataAcquisitionLoop();
waiting = false;
delay(2000);
if (byteRead == 49) {
Serial.println("DATA ACQUSITION MODE SELECTED");
}
dataAcquisitionLoop();
waiting = false;
delay(2000);
if (byteRead == 50) {
Serial.println("READ EEPROM MODE SELECTED");
readEEPROM();
Serial.println("EEPROM READ");
byteRead = 0;
waiting = false;
Telemetry Systems
Laub
}
delay(2000);
if (byteRead == 51) {
Serial.println("CLEAR EEPROM MODE SELECTED");
clearEEPROM();
Serial.println("EEPROM CLEARED");
}
}
byteRead = 0;
waiting = false;
delay(2000);
Serial.println("STAND BY MODE");
while (waiting == false) {
digitalWrite(infoLEDPin, HIGH);
delay(500);
digitalWrite(infoLEDPin, LOW);
delay(500);
}
}
altitudeZero
// Joseph Laub
// Altitude Zeroing
// 2/19/15
int g = 1;
int zeroing = 0;
int avgAmount = 2;
float tempAlt = 0;
int tempAltitude[200];
float altitudeZero()
{
digitalWrite(infoLEDPin, HIGH);
delay(250);
digitalWrite(infoLEDPin, LOW);
Serial.println("ZEROING ALTITUDE");
// Ignore the first 50 samples
for (g = 0; g <= 100; g++) {
tempAlt = pressureToAltitude(findPressure())/100;
}
}
delay(100);
Serial.println(tempAlt);
return (tempAlt-10);
53
54
Union College 2015 Aero Design Team
clearEEPROM
// Joseph Laub
// 2/16/15
// Clears the EEPROM addresses within the I2C Chip
// Address for the I2C Chip is 0x50
unsigned int clearAddr;
int clearData;
void clearEEPROM() {
clearData = 255;
digitalWrite(infoLEDPin, HIGH);
// write 255 to all 32768 bytes of the EEPROM Chip
for (clearAddr = 0; clearAddr < 32768; clearAddr++) {
Wire.beginTransmission(0x50);
Wire.write((int)(clearAddr >> 8)); // MSB
Wire.write((int)(clearAddr & 0xFF)); // LSB
Wire.write(clearData);
Wire.endTransmission();
delay(5);
}
}
digitalWrite(infoLEDPin, LOW);
dataAcqusitionLoop
/*
Joseph Laub
2/16/15
This is the Data Acquisition Loop for Hornet.
Hornet uses I2C protocol to communicate with various sensors.
The order of events in the Data Acquisition Loop are:
Find Data
Make Necessary Corrections to Data
Store Data in EEPROM Chip
Transmit Data
Check for Stop Button
Repeat
The following variables are recorded by the system:
Air Speed
Altitude
Ground Speed
GPS Altitude
Latitude
Longitude
Pressure
Temperature
Time
Time of Flght
The following sensors are used in the Hornet system:
Telemetry Systems
Laub
55
Eagle Tree Air Speed Sensor V3...........Air Speed
MPL3115A2................................Altitude, Pressure, Temperature
Navigatron v2............................Ground Speed, GPS Altitude, Latitude, Longitude
VL6180...................................Time of Flight
*/
// Initilizing variables
boolean dataLoop = true; // If true then keep looping the data acquisition loop. If false, return.
byte timeLSB
byte timeMSB
= 0; // Holds the least significant 8 bits of the timeBin
= 0; // Holds the most significant 8 bits of the timeBin
float airSpeedData = 0; // Set air speed value to zero for start
float altitudeData = 0; // Set altitude value to zero for start
float pressureData = 0; // Set pressure value to zero for start
float timeBeforeLoop = 0; // This variable holds the time value for the script
float timeDiff
= 0;
// Holds the difference in time that has been calucted. Used for determining sampling
times
float timeZero
= 0; // Used for zeroing time
float zed
= 0;
long address
= 0; // This variable chooses which EEPROM address to write to for function writeEEPROM
int altDecData
= 0; // Variable holds the decimal places from the altitude
long maxAddress
= 32768; // The maximum address that will be reached by the system before ending
int sampleTime
= 500; // in milliseconds, time between measurements
int temperatureData = 0; // Set temperature value to zero for start
int ToFData
= 0; // in mm, Time of Flight data for liftoff confirmation
int timeBin
= 0; // Holds the time as a binary value
void dataAcquisitionLoop() {
zed = altitudeZero();
timeZero = millis(); // Take a time stamp of when this loop starts so that data can be synced to this starting time.
digitalWrite(infoLEDPin, HIGH); // Turn on infoLED to indicate that data is being acquired.
Serial.println("DATA ACQUISITION LOOP EXECUTED");
while (dataLoop == true) {
timeBeforeLoop = millis() - timeZero; // in ms, time before data is acquired
airSpeedData = findAirSpeed();
// in mph, air speed is returned
pressureData
= findPressure();
// in Pa, pressure is returned multiplied by 1000 to preserve
decimal values
temperatureData = findTemperature();
// in F, temperature is returned
altitudeData = pressureToAltitude(pressureData); // in ft, altitude is returned multiplied by 100 to preserve
two decimal places
ToFData
= sensor.getDistance();
// in mm, Time of Flight data measures distance from base of plane
to ground (to about 25 cm)
altitudeData = altitudeData/100 - zed;
places. Correct this magnitude.
// Altitude was multpied by 100 to preserve two deciaml
56
Union College 2015 Aero Design Team
pressureData = pressureData/1000;
variables. Correct the magnitude
Telemetry Systems
// Pressure was multiplied by 1000 to preserve accuracy for int
altDecData = (altitudeData - floor(altitudeData))*100; // This takes the decimal value of the altitude
altitudeData = floor(altitudeData);
// Rounds down the altitude so that we can add the decimal values
back later
timeBin = timeBeforeLoop/10; // Time is stored in units of centiseconds.
timeMSB = timeBin >> 8;
// The most significant bits of time in cs
timeLSB = timeBin & 255;
// The least significant bits of time in cs
Serial.println("HORNET TELEMETRY DATA");
Serial.print("TIME ELAPSED:\t"); Serial.print(timeBeforeLoop/1000); Serial.println("\t(s)");
// Serial.print("TIME ELAPSED:\t"); Serial.print(timeBin, BIN); Serial.println("\t(cs) in binary");
Serial.print("TIME MSB:\t"); Serial.println(timeMSB);
Serial.print("TIME LSB:\t"); Serial.println(timeLSB);
Serial.print("ADDRESS:\t"); Serial.print(address); Serial.println("\tEEPROM");
Serial.print("AIR SPEED:\t"); Serial.print(airSpeedData); Serial.println("\t(mph)");
Serial.print("TIME OF FLIGHT:\t"); Serial.print(ToFData); Serial.println("\t(mm)");
// Serial.print("PRESSURE:\t"); Serial.print(pressureData); Serial.println("\t(Pa)");
Serial.print("ALTITUDE:\t"); Serial.print(altitudeData); Serial.println("\t(ft)");
// Serial.print("ALTITUDE DECIMAL:\t"); Serial.print(altDecData); Serial.println("\t(ftx10^2)");
// Serial.print("ALTITUDE ZEROING:\t"); Serial.print(zed); Serial.println("\t(ft)");
Serial.print("TEMPERATURE:\t"); Serial.print(temperatureData); Serial.println("\t(F)");
// writeEEPROM returns an incrimented address value for the next writeEEPROM
address = writeEEPROM(address, timeMSB);
// Write the first part of the time
address = writeEEPROM(address, timeLSB);
// Write the second part of the time
address = writeEEPROM(address, airSpeedData); // Write the air speed to address.
address = writeEEPROM(address, ToFData);
// Time of Flight Data
address = writeEEPROM(address, altitudeData); // Write the change in altitude to address.
//address = writeEEPROM(address, altDecData);
// Write the change in altitude decimal places to address.
address = writeEEPROM(address, temperatureData); // Write the temperature to address.
//transmitData(stopType);
while (timeDiff < sampleTime) {
// Waits until one entire sampleTime has passed from the start of
dataAcquisitionLoop
timeDiff = (millis() - timeZero) - timeBeforeLoop; // This time difference is how much time has elapsed since
this loop started
}
timeDiff = 0;
// Resets timeDiff for next loop
if (address >= maxAddress) {
// If the address is at its limit
address = 0; // Reset address to 0 so that data can loop
}
buttonState = digitalRead(buttonPin);
if (buttonState == HIGH) {
Serial.println("DATA ACQUISITION LOOP TERMINATED");
Laub
}
}
}
dataLoop = false;
delay(1000);
digitalWrite(infoLEDPin, LOW); // Turn on infoLED to indicate that data is being acquired.
return;
findAirSpeed
// Joseph Laub
// 12/3/14
// Finds and returns the air speed using the EagleTree Air Speed Sensor V3
int addressAirSpeed = 0x75;
// Data sheet claims 0xEA, however, use the high 7 version (0x75)
int w = 0x07;
// Not sure why 0x07, however, I think this puts the sensor in read mode
float r = 0;
// Used to store the air speed
float findAirSpeed() {
r = 0; // reset r to 0
Wire.beginTransmission(addressAirSpeed);
Wire.write(w);
Wire.endTransmission();
Wire.requestFrom(addressAirSpeed, 2); // request 2 bytes from device
Wire.available(); //check and see how many bytes are available, should be 2
r = Wire.read();
Wire.endTransmission();
}
return r;
findAltitude
// Joseph Laub
// 12/7/14
// Finds the pressure recorded on the MPL3115A2. This can later be converted to a change in altitude
float findAltitude() {
float f = myPressure.readAltitudeFt();
}
return f;
findPressure
// Joseph Laub
57
58
Union College 2015 Aero Design Team
Telemetry Systems
// 12/3/14
// Finds the pressure recorded on the MPL3115A2. This can later be converted to a change in altitude
float findPressure() {
float p = myPressure.readPressure();
}
return p*1000;
findTemperature
// Joseph Laub
// 12/3/14
// Finds the temperature recorded on the MPL3115A2.
float findTemperature() {
float t = myPressure.readTempF();
return t;
}
pressureToAltitude
int pressureToAltitude(float pre) {
// p = 101325(1 - 2.25577e-5 * h)^5.25588
// p = z(x - c * h)^v
// solve for h
// h = (x-(p/z)^(1/d))/v
const float z = 101325;
const float x = 1;
const float c = 0.0000225577;
const float v = 5.25588;
float h = 0; // Altitude to be calculated
pre = pre/1000;
float part1 = pow((pre/z), (1/v));
h = (x-part1)/c;
h = h*3.28084;
return h*100;
}
readEEPROM
// Joseph Laub
// 2/16/15
// Reads the EEPROM addresses within the I2C Chip
// Address for the I2C Chip is 0x50
Laub
void readEEPROM() {
long j = 0;
int flagEnd = 0; // flagEnd will determine if there is no more data. Ten 255's in a row means it is the end.
digitalWrite(infoLEDPin, HIGH);
while (j < 32768 && flagEnd < 10) {
byte rdata = 0xFF;
Wire.beginTransmission(0x50);
Wire.write((int)(j >> 8)); // MSB
Wire.write((int)(j & 0xFF)); // LSB
Wire.endTransmission();
Wire.requestFrom(0x50, 1);
if (Wire.available()) rdata = Wire.read();
Serial.print("Address:\t"); Serial.print(j); Serial.print("\tData:\t"); Serial.println(rdata);
j++;
if (rdata == 255) {
flagEnd++;
}
else {
flagEnd = 0;
}
}
}
digitalWrite(infoLEDPin, LOW);
transmitData
// Joseph Laub
// 2/10/15
// Function that transmit a given data type and data
void transmitData(int data) {
//
char dataMsg[4];
data = abs(data);
vw_set_ptt_inverted(true); // Required for RF Link Module
vw_setup(1200);
// Bits per second
vw_set_tx_pin(1);
// pin 1 used a as the transmit data out into the TX link module
// delay(200);
itoa(data, dataMsg, 10);
vw_send((uint8_t *)dataMsg, strlen(dataMsg));
vw_wait_tx();
// Serial.println("SENT");
}
59
60
Union College 2015 Aero Design Team
writeEEPROM
// Joseph Laub
// 12/3/14
// Writes to a given address a given value
int writeEEPROM(unsigned int addr, byte val) {
int writeData = val;
Wire.beginTransmission(0x50);
Wire.write((int)(addr >> 8)); // MSB
Wire.write((int)(addr & 0xFF)); // LSB
Wire.write(writeData);
Wire.endTransmission();
delay(10);
addr++;
return addr;
}
APPENDIX L
EEPROMRead.m attached on next page.
Telemetry Systems
Reading and Formating EEPROM Data
from File with Custom Data Type Order
Table of Contents
Reset the workspace ............................................................................................................
Load in EEPROM Data File .................................................................................................
Declare Variable Type Order ................................................................................................
Declare Byte Values to Data Types ........................................................................................
Sort EEPROM Data and Separate Out Data Types ....................................................................
Binary Shifting ...................................................................................................................
Recorect Data Scaling ..........................................................................................................
Enter Units for Data ............................................................................................................
Plot Data ...........................................................................................................................
1
1
2
2
2
3
4
4
4
Joseph Laub
2015 Union College Aero Design Team
Telemetry Systems Engineering
1/31/15
This script loads a data file from a flight or test and plots the data.
The user must input the order that the information is in in the data
column of the test file. Make sure that there are no extra spaces of
headers in the text file and that it is only two columns of data.
Addresses on the left and data on the right.
Follow the instructions in the command window and results should be
plotted. A basic understanding of the telemetry system and EEPROM is
needed to understand this script accuractly. Reference
<http://muse.union.edu/seniorproject-laubj/> for more information.
Reset the workspace
close all
clear
clc
Load in EEPROM Data File
Load in data using the dlmread function. Store two columned matrix in N. The first column are addresses
and the second column contains the data.
dataFile = ''; % Filename goes here, including the extension. Make sure
% there are no extra spaces or headers in file.
N = dlmread(dataFile, '\t');
disp([ dataFile ' file read.' char(10) ])
% Separate the addresses and data into individual columns.
addresses = N(:,1);
dataRead = N(:,2);
1
Reading and Formating EEPROM Data from File with
Custom Data Type Order
Declare Variable Type Order
Using a for loop, enter the data types in the order that EEPROM stores the different types. For now ignore
the fact that some data contains more bytes than others.
% i keeps the while loop going.
i = 1;
% Keeps track of the amount of variables.
varCount = 0;
while (i == 1)
s1 = ['Enter variable tpye ' num2str(varCount+1)...
' or enter "0" when done:' char(10)];
dataTypeInput = input(s1, 's');
if (dataTypeInput == '0')
i = 0;
else
varCount = varCount + 1;
eval(['var', num2str(varCount), ' = ', 'dataTypeInput' ]);
end
end
clc
disp([ 'Variable(s) type order declared.' char(10) ]);
Declare Byte Values to Data Types
Here we declare the amount of bytes used per data type using a for loop.
% Keeps track of the amount of bytes used per cycle.
cycleLength = 0;
for (i = 1:varCount)
s2 = ['Enter number of bytes associated with ' eval([ 'var',...
num2str(i) ]) '.' char(10)];
byteAmountInput = input(s2);
eval([ 'dataLength', num2str(i), ' = ', 'byteAmountInput']);
cycleLength = cycleLength + byteAmountInput;
end
clc
disp([ 'Variable byte values declared.' char(10) ]);
Sort EEPROM Data and Separate Out Data
Types
This for loop sorts through the data from the file given and sorts the data based on the variables/byte
amounts entered by the user.
2
Reading and Formating EEPROM Data from File with
Custom Data Type Order
% Create data variables. Later I will delete this first index.
for (i = 1:varCount)
eval([ 'data', num2str(i), ' = ', '0;' ]);
end
% Used for the index of the data variables.
k = 1;
for i = 1:cycleLength:length(dataRead)-cycleLength
index = i;
for (j = 1:varCount)
bytes = eval([ 'dataLength', num2str(j) ]);
for (b = 1:bytes)
d = [ 'data' num2str(j) ];
dl = eval([ 'length(', 'data', num2str(j), ');' ]);
dl = dl + 1;
in = dataRead(index);
eval([ 'data', num2str(j), '(', num2str(dl), ')', ' = ',...
num2str(in) ';']);
index = index + 1;
end
j = j + 1;
end
k = k + 1;
end
% Delete the first index because it was created earlier just to create the
% variable.
for (i = 1:varCount)
eval([ 'data', num2str(i), '(1)', ' = ', '[];' ]);
end
Binary Shifting
For the variables that are saved using multiple bytes, bitshift functions are need to shift and or the bytes
so that the actual value may be obtained.
for (j = 1:varCount)
% c holds the amount of bytes in the selected variable (j)
% j is the number of the variable. It cycles through the variables
eval([ 'c = dataLength', num2str(j), ';' ]);
% if the amount of bytes in the selected variable is more than 1, then
% we are going to have to shift over the most significant bytes and or
% them with the least significant bytes.
if (c > 1)
% i holds the index of the tempData.
% tempData is used to hold the variable data until it is all
% shifted and or'ed together. Then the variable becomes tempData.
i = 1;
% This for loop cycles through the entire data vector. Where k is
3
Reading and Formating EEPROM Data from File with
Custom Data Type Order
% the first byte of a byte word in each cycle. The cycle length is
% the amount of bytes for each data point in a variable.
for (k = 1:c:((index-1)/cycleLength)*c)
eval([ 'MSB = data', num2str(j), '(', num2str(k), ');' ]);
% This loop cycles through a byte word and shifts and or's it
% all together for one data point. t is the current byte in the
% cycle.
for (t = 1:(c-1))
eval([ 'LSB = data', num2str(j), '(', num2str(k+t), ');'...
]);
MSB = bitor(bitshift(MSB, 8), LSB);
end
tempData(i) = MSB;
i = i + 1;
end
eval([ 'data', num2str(j), ' = tempData;' ]);
end
end
disp([ 'Data sorted and restored.' char(10) ]);
Recorect Data Scaling
Some of the data might have been scaled before it was written to the EEPROM. Use the For loops to
correct the data.
for (i = 1:varCount)
s2 = ['Enter a scale to multiply with ' eval([ 'var', num2str(i) ])...
'. Or enter 1 for no scaling.' char(10)];
scaler = input(s2);
eval([ 'data', num2str(i), ' = ', 'data', num2str(i), '.*scaler;' ]);
end
clc
disp(['Data scaled where appropriate' char(10)]);
Enter Units for Data
User enters the units associated with the variables
for (i = 1:varCount)
s3 = ['Enter the units associated with ' eval([ 'var', num2str(i) ])...
'.' char(10)];
unitsInput = input(s3, 's');
eval([ 'data', num2str(i), 'Units = unitsInput' ]);
end
Plot Data
User chooses if he/she wants all of the data in a subplot plot or individual plots.
clc
4
Reading and Formating EEPROM Data from File with
Custom Data Type Order
s4 = ['Choose a method to plot data:' char(10)...
'Enter 0 for no plots.' char(10)...
'Enter 1 for subplot method.' char(10)...
'Enter 2 for individual variable plots.' char(10) ];
method = input(s4);
clc
switch(method)
case 0
disp('No plots created');
% Subplot method
case 1
s5 = ['Are one of these variables the x-axis?' char(10)...
'Enter the corresponding variable number or 0'...
' for no x-axis.' char(10) char(10) ];
s5Temp = [''];
% Creates a string list of the variables for the user to see.
for (sTemp = 1:varCount)
s5Temp = [s5Temp 'Variable ' num2str(sTemp) ': '...
eval([ 'var', num2str(sTemp)]) char(10) ];
end
s5 = [ s5 s5Temp ];
xAxisInput = input(s5);
% This switch/case statement will decide how to plot the
% individual plots.
switch(xAxisInput)
% No x-axis selected. Plot all variables singularly.
case 0
disp('No x-axis selected.');
for (p = 1:varCount)
subplot(varCount, 1, p);
plot(eval([ 'data', num2str(p) ]), 'b-o');
title([eval([ 'var', num2str(p) ])...
' Plot from file ' dataFile]);
xlabel('Index');
ylabel([eval([ 'var', num2str(p) ]) ' ('...
eval(['data', num2str(p), 'Units' ]) ')']);
end
% x-Axis selected. Plot all variables with the x-axis.
case num2cell(1:varCount)
xAxisTitle = eval([ 'var' num2str(xAxisInput), ';']);
disp([ xAxisTitle ' selected as x-axis.']);
xAxis = eval([ 'data', num2str(xAxisInput), ';' ]);
xAxisUnits =...
eval([ 'data', num2str(xAxisInput), 'Units;' ]);
subIn = 1;
for (p = 1:varCount)
switch(xAxisTitle)
case (eval([ 'var', num2str(p) ]))
5
Reading and Formating EEPROM Data from File with
Custom Data Type Order
otherwise
subplot((varCount-1), 1, subIn);
plot(xAxis, eval([ 'data',...
num2str(p) ]), 'b-o');
title([eval([ 'var', num2str(p) ])...
' Plot from file ' dataFile],...
'FontWeight', 'bold');
xlabel([xAxisTitle ' (' xAxisUnits ')']);
ylabel([eval([ 'var', num2str(p) ])...
char(10) ' (' eval(['data',...
num2str(p), 'Units' ]) ')']);
subIn = subIn + 1;
end
end
otherwise
disp('Unknown input. No plots created');
end
% Individual plots method
case 2
s5 = ['Are one of these variables the x-axis?' char(10)...
'Enter the corresponding variable number or'...
' 0 for no x-axis.' char(10) char(10) ];
s5Temp = [''];
% Creates a string list of the variables for the user to see.
for (sTemp = 1:varCount)
s5Temp = [s5Temp 'Variable ' num2str(sTemp) ': '...
eval([ 'var', num2str(sTemp)]) char(10) ];
end
s5 = [ s5 s5Temp ];
xAxisInput = input(s5);
% This switch/case statement will decide how to plot the
% individual plots.
switch(xAxisInput)
% No x-axis selected. Plot all variables singularly.
case 0
disp('No x-axis selected.');
for (p = 1:varCount)
figure;
plot(eval([ 'data', num2str(p) ]), 'b-o');
title([eval([ 'var', num2str(p) ])...
' Plot from file ' dataFile]);
xlabel('Index');
ylabel([eval([ 'var', num2str(p) ]) ' ('...
eval(['data', num2str(p), 'Units' ]) ')']);
end
% x-Axis selected. Plot all variables with the x-axis.
case num2cell(1:varCount)
xAxisTitle = eval([ 'var' num2str(xAxisInput), ';']);
disp([ xAxisTitle ' selected as x-axis.']);
6
Reading and Formating EEPROM Data from File with
Custom Data Type Order
xAxis = eval([ 'data', num2str(xAxisInput), ';' ]);
xAxisUnits =...
eval([ 'data', num2str(xAxisInput), 'Units;' ]);
for (p = 1:varCount)
switch(xAxisTitle)
case (eval([ 'var', num2str(p) ]))
otherwise
figure;
plot(xAxis, eval([ 'data', num2str(p) ]),...
'b-o');
title([eval([ 'var', num2str(p) ])...
' Plot from file ' dataFile]);
xlabel([xAxisTitle ' (' xAxisUnits ')']);
ylabel([eval([ 'var', num2str(p) ])...
' (' eval(['data', num2str(p),...
'Units' ]) ')']);
end
end
otherwise
disp('Unknown input. No plots created');
end
otherwise
disp('Unexpected input. No plots created.');
end
clc
disp('EEPROMRead.m done');
Published with MATLAB® R2014a
7
68
Union College 2015 Aero Design Team
APPENDIX M
Telemetry System V2.0: Hornet User Manual attached on next page.
Telemetry Systems
[Type text]
[Type text]
[Type text]
3/17/2015
UNION
COLLEGE
AERO
DESIGN
TEAM
TELEMETRY SYSTEM V2.0: THE HORNET
USER MANUAL
Written by Joseph Laub | [email protected]
Joseph Laub
Telemetry System V2.0: Hornet User Manual
1
Contents
Parts List: ...................................................................................................................................................... 2
Test Setup: .................................................................................................................................................... 2
Figure 1: Arduino Mini Pro. ..................................................................................................................... 2
Figure 2: FDTI Jumper connected to the Arduino Mini Pro. .................................................................... 2
Figure 3: FTDI connection to Arduino Mini Pro. ..................................................................................... 2
Figure 4: Mini USB to FTDI..................................................................................................................... 3
Figure 5: Arduino Mini Pro and User Interface board. ............................................................................. 3
Figure 6: 3-Wire Jumper to Arduino Mini Pro. ........................................................................................ 3
Figure 7: 3-Wire Jumper to User Interface. .............................................................................................. 3
Figure 8: Power jumper to User Interface board....................................................................................... 4
Figure 9: I2C Bus Hub. ............................................................................................................................. 4
Figure 10: Sensors connected to I2C Bus Hub. ........................................................................................ 4
Figure 11: Battery Jumper connected to Arduino Mini Pro. ..................................................................... 4
Figure 12: 9 V Battery connected. ............................................................................................................ 4
Figure 13: Serial Port selection. ................................................................................................................ 5
Figure 14: Board selection. ....................................................................................................................... 5
Figure 15: Upload the sketch. ................................................................................................................... 5
Figure 17: Serial Monitor.......................................................................................................................... 5
Figure 18: Setting the baud rate. ............................................................................................................... 5
Figure 19: Monitor output. ........................................................................................................................ 6
Aircraft Setup:............................................................................................................................................... 6
Figure 20: Pitot-static tube in the wing section......................................................................................... 6
Appendices:................................................................................................................................................... 8
Joseph Laub
Telemetry System V2.0: Hornet User Manual
2
Parts List:
A log of photographs for each part can be seen in Appendix.
1) Arduino Mini Pro Board
2) 6-Wire Jumper
3) FDTI Port
4) USB to Mini USB
5) Computer
6) User Interface
7) 3-Wire Jumper
8) I2C Bus Hub
9) AirSpeed MicroSensor V3
10) VL6180 (Time of Flight) Sensor
11) GTPA010 (GPS) Sensor
12) MPL3115A2 (Altimeter) Sensor
13) 256 kbit EEPROM Chip
14) Battery Jumper
15) 9 V Battery
Test Setup:
For testing The Hornet telemetry system follow these steps. This setup is not meant to be installed
on an aircraft. For aircraft installation, go to page _______.
1) Begin with the
microcontroller.
Arduino
Mini
Pro
Figure 1: Arduino Mini Pro.
2) Connect the 6-Wire Jumper to the Arduino
Mini Pro’s BLK through GRN headers.
Figure 2: FDTI Jumper connected to the
Arduino Mini Pro.
3) Then connect the FTDI Port to the other
end of the 6-Wire Jumper. Make sure that
the BLK ports of the Arduino Mini Pro and
FDTI port are connected. The FTDI port
and the Arduino Mini Pro’s BLK-GRN
headers should line up one-to-one.
4) Then take the USB to Mini USB cord and
connect the mini USB to the FTDI port.
Figure 3: FTDI connection to Arduino Mini Pro.
Joseph Laub
Telemetry System V2.0: Hornet User Manual
3
Figure 4: Mini USB to FTDI.
5) The USB end of the USB to Mini USB
cord connects to any computer capable of
running the Arduino IDE software.
6) Now place the User Interface board near
the Arduino Mini Pro.
Figure 5: Arduino Mini Pro and User Interface
board.
7) Take the 3-Wire Jumper and connect it to
pins 2-4 on the Arduino Mini Pro. Note
which color wire is connected to pin 2.
Figure 6: 3-Wire Jumper to Arduino Mini Pro.
8) Take the other end of the wire and connect
it to the User Interface. Make sure that the
pin 2 color wire is connected to the header
closest to the yellow wire on the board as
seen in Figure 8.
Figure 7: 3-Wire Jumper to User Interface.
Joseph Laub
Telemetry System V2.0: Hornet User Manual
9) The power connection for the User
Interface is soldered to the Arduino Mini
Pro. It is the 2-Wire female connections
(red and black). Connect this to the User
Interface board and insure that the red wire
lines up with the small red wire on the User
Interface board.
Figure 8: Power jumper to User Interface
board.
10) Now we will set up the I2C Bus Hub which
is already connected to the Arduino
through soldered black, red, brown, and
blue connections.
Figure 9: I2C Bus Hub.
11) Each of the four sensors (parts 9-12) have
multicolored 4-wire jumpers connected to
them. Each jumper is aligned to match the
black, red, brown, and blue wires from the
Arduino Mini Pro. Connect all four sensors
such that the green wires all alright with
the black wire’s row. Seen in Figure 11. It
is important these rows to not cross as this
will ruin the system.
12) Now connect the Battery Jumper connector
to the Arduino Mini Pro’s RAW and GND
headers. Red to RAW and black to GND.
Figure 10: Sensors connected to I2C Bus Hub.
Figure 11: Battery Jumper connected to
Arduino Mini Pro.
13) Now connect a 9 V battery to the Battery
Jumper. A 9 V battery will only connect
one way.
Figure 12: 9 V Battery connected.
4
Joseph Laub
Telemetry System V2.0: Hornet User Manual
Now that the hardware portion of The Hornet system has been assembled, upload the telemetryHornet
Arduino Sketch. If you do not have the Arduino IDE software then visit this link:
http://arduino.cc/en/Main/Software.To upload this sketch follow these steps:
1) Open the telemetryHornet.ino file in the
Arduino IDE software.
2) Select the correct Serial Port for the system
that is connected to your computer. Note
that this may be different depending on the
type of computer you are using. For more
information about Serial Ports visit
http://arduino.cc/en/Guide/Windows
Figure 13: Serial Port selection.
3) Select the correct Board next. Select:
Arduino Pro or Pro Mini (3.3V, 8MHz) w/
ATmega328
Figure 14: Board selection.
4) Upload the telemetryHornet sketch by
pressing the upload button.
Figure 15: Upload the sketch.
5) Now open the Serial Monitor.
Figure 17: Serial Monitor.
6) Make sure the baud is set to 115200.
Figure 18: Setting the baud rate.
5
Joseph Laub
Telemetry System V2.0: Hornet User Manual
6
7) You should now see an output screen that
matches Figure 20.
Figure 19: Monitor output.
Enter a ‘1’ to initiate the data acquisition system. The system will take a moment zero the altitude and
then it will begin displaying data. Go to the troubleshooting section of the manual to confirm that the data
is correct or if any issues have been encountered.
Aircraft Setup:
For installing The Hornet telemetry system in an aircraft make sure the following guidelines are noted.
This installation will largely depend on the design of the aircraft but it is important to keep these
guidelines in mind when installing this system.
•
•
•
•
The airspeed sensor uses a Prandtl style pitot-static tube, pictured in Appendix J, which measures
total pressure and static pressure to find air speed. The pitot-static tube must face directly forward
to get an accurate measurement. Place the airspeed sensor inside the wing section normal to the
leading edge and away from the propeller to avoid wash. Figure 21 demonstrates this technique.
Figure 20: Pitot-static tube in the wing section.
The MPL3115A2 altimeter sensor also measures pressure to find a change in altitude. Keep this
sensor away from the wash of the propeller and from any significant heat sources such as the
battery and motor.
The VL6180 Time of Flight sensor should be mounted on the bottom of the fuselage. Make sure
that it has a clear line of sight to the ground. It uses IR and the delay of the reflection to determine
distance, therefore any objects in its path, such as the landing gear, would make it inaccurate.
The GTPA010 GPS communicates with satellites at 1575.42 MHz and is susceptible to
interference from electronic devices, the motor in particular. Mount this sensor as far away from
Joseph Laub
•
•
Telemetry System V2.0: Hornet User Manual
the motor and electrical systems as reasonably possible and keep it as high as possible. As clear
of a line of sight to the satellites as possible is also important but not entirely necessary.
The User Interface board should be easily accessible for the system to be started or stopped. The
LEDs are important indicators that allow the status of the system to be observed without a
computer.
The FDTI port must be accessible in order to read and clear the memory.
7
Joseph Laub
Telemetry System V2.0: Hornet User Manual
8
Appendices:
Appendix A: Arduino
Mini Pro.
Appendix B: 6-Wire
Jumper.
Appendix C: FDTI
Port.
Appendix D: USB
to Mini USB.
Appendix E:
Computer with USB
ports.
Appendix F: User Interface
Board.
Appendix G: 3-Wire
Jumper.
Appendix H: I2C
Bus Hub.
Appendix J: AirSpeed
MicroSensor V3.
Appendix K: VL6180.
Appendix L:
GTPA010.
Appendix M:
MPL3115A2.
Appendix N: 256 kbit
EEPROM Chip.
Appendix O: Battery
Jumper.
Appendix P: 9 V
Battery.