1
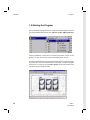
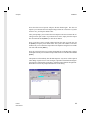
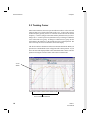
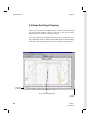
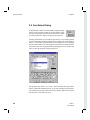
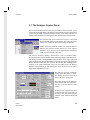
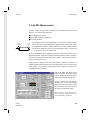
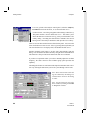
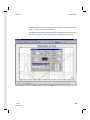
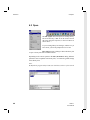
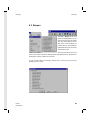
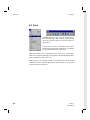
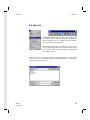
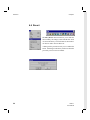
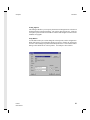
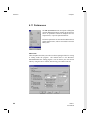
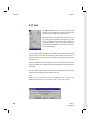
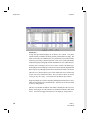
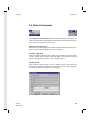
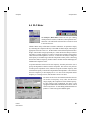
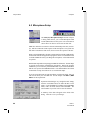
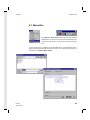
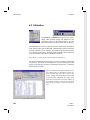
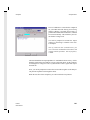
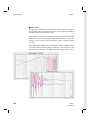
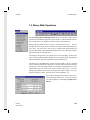
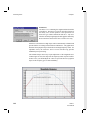
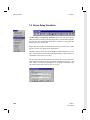
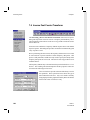
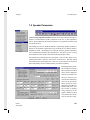
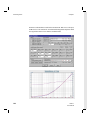
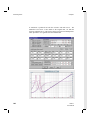
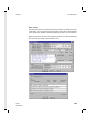
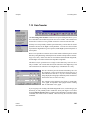
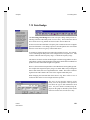
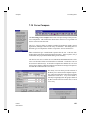
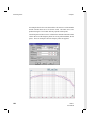
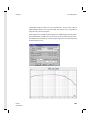
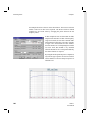
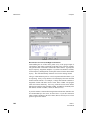
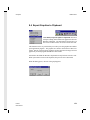
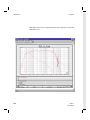
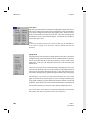
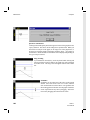
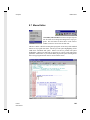
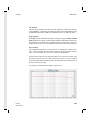
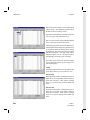
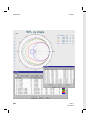
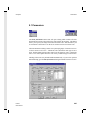
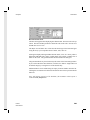
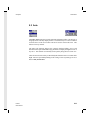
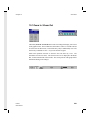
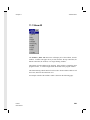
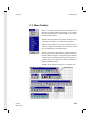
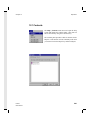
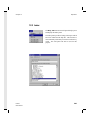
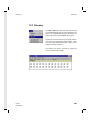
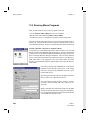
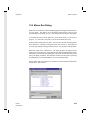
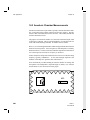
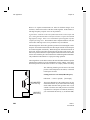
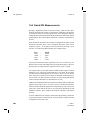
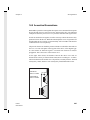
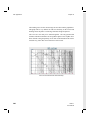
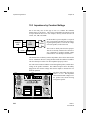
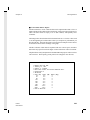
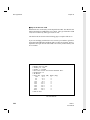
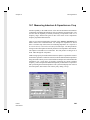
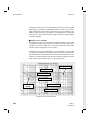
Getting Started
Chapter 3
Let's now go back to the analyzer control panel. Select the Analyzer |
Parameters item from the menu, or use the tool button or F5.
Analyzer Parameters
As shown below, one of the group panels in this dialog is called Sweep.
This panel contains a list box titled Data Curve. This allows you to
choose the data curve for the next sweep, just as you would in the Curve
Library dialog. Providing this function here eliminates the need of
having to leave the Analyzer Parameters and open the Curve Library.
There are several other similar features offered in this panel. You can set the
Name for the data curve here as well. Also, by pressing the Graph button you
can select the data curve for display alone, and disable all other curves.
Another commonly used feature is to take static measurements from this
dialog. You can turn the Oscillator On/Off by using the lower left hand button.
This function is also provided on the main menu and on a tool button.
If you have a requirement where you wish to manually adjust the oscillator
frequency, the slider control in the Oscillator group panel provides this
capability.
The dialog also features several buttons which perform automatic unit conversion. By clicking the unit button you will be cycled through a list of units.
Note: Static measurements and readings are obtained by this dialog on a
continual basis whenever this dialog
is visible.
Note: You can change the color of the
meter readouts by clicking on the Value
or Freq black readouts.
40
LMS 4.1
User Manual