1
Utilities Menu
Chapter 8
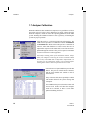
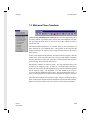
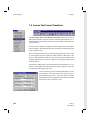
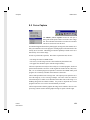
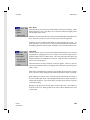
Color Match
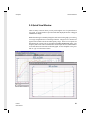
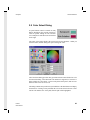
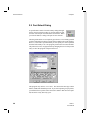
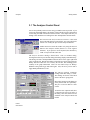
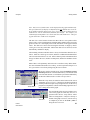
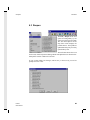
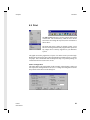
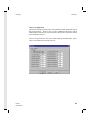
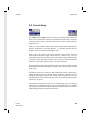
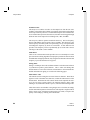
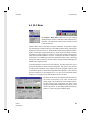
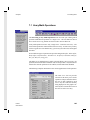
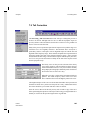
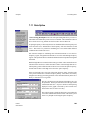
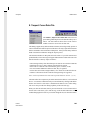
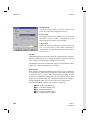
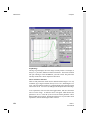
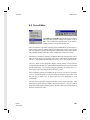
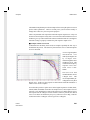
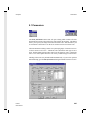
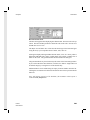
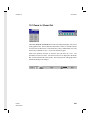
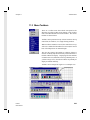
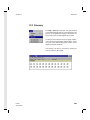
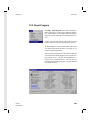
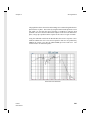
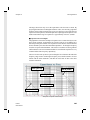
The slider controls a tolerance matching value in ±% for pixel colors scanned
in the image. The current value is displayed above. If the value is zero, then
pixels will only be selected as part of the curve if their color matches the exact
Curve Color selection described above. A higher tolerance value will allow
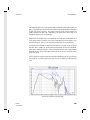
more latitude in pixel matching. The Preview button will run the curve
scanning process, and draw a sample curve on top of the image. This shows
you how the pixel curve colors will be mapped. The Clear button will erase the
preview curve. The small color button allows you to change the color used for
the preview curve and LL/UR markers.
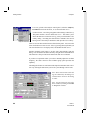
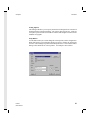
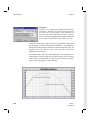
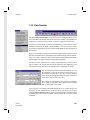
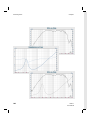
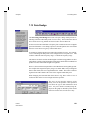
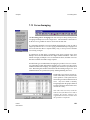
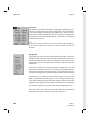
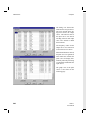
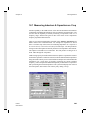
Using the Capture Dialog
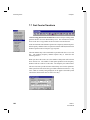
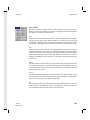
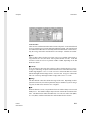
The first step is to load the desired file with the Load File button. Once the file
is loaded you should probably next go to the Horizontal and Vertical panels to
select the type of graph and the frequency axis.
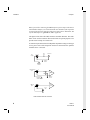
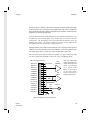
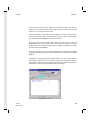
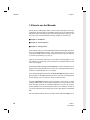
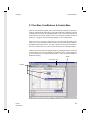
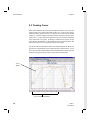
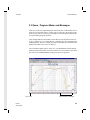
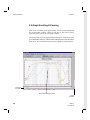
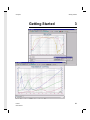
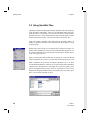
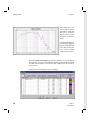
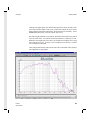
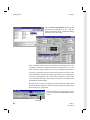
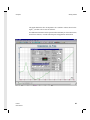
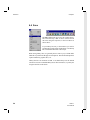
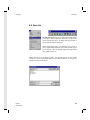
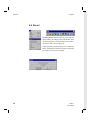
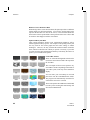
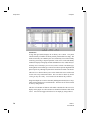
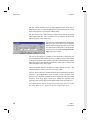
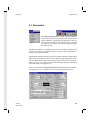
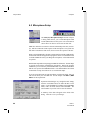
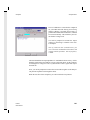
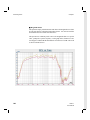
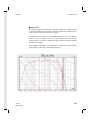
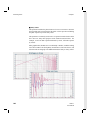
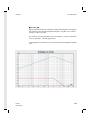
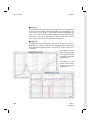
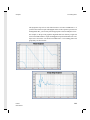
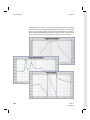
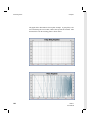
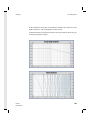
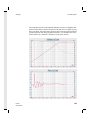
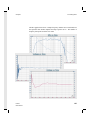
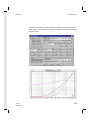
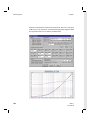
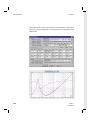
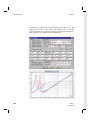
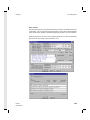
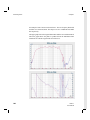
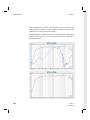
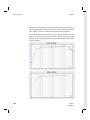
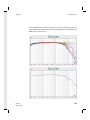
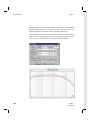
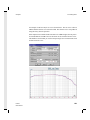
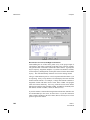
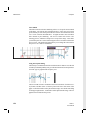
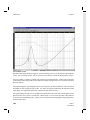
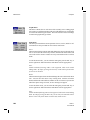
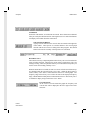
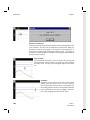
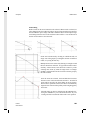
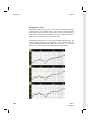
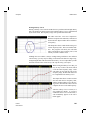
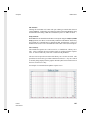
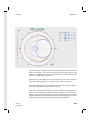
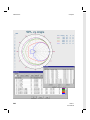
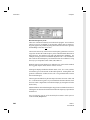
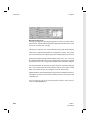
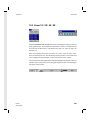
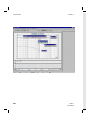
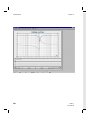
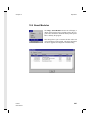
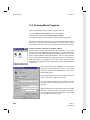
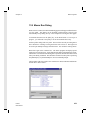
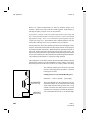
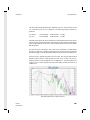
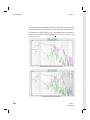
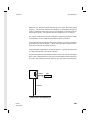
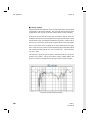
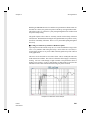
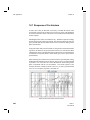
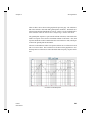
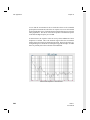
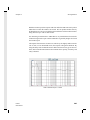
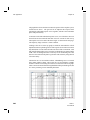
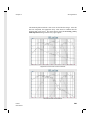
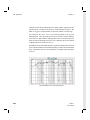
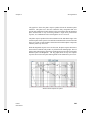
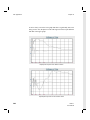
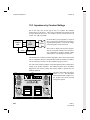
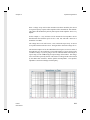
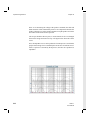
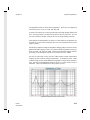
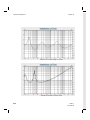
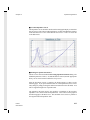
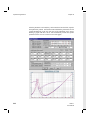
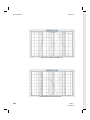
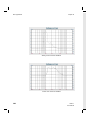
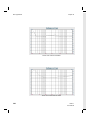
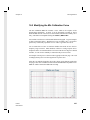
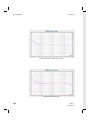
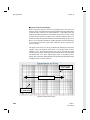
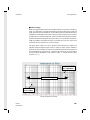
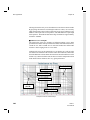
The two LL/UR reference coordinates must now be defined. Click the Lower
Left button, and then select a reference point in the lower left corner of the
graph. A small LL marker will be placed on the image. Next do the same thing
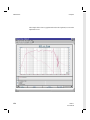
for the upper right marker. A UR marker will be placed on the image. The two
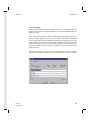
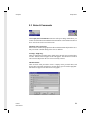
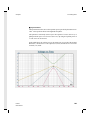
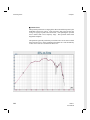
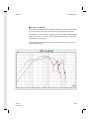
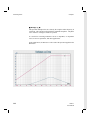
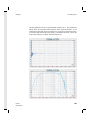
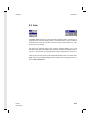
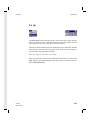
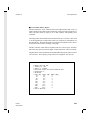
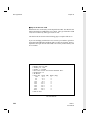
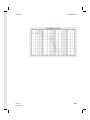
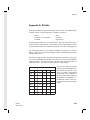
graphics below illustrate this process.
178
LMS 4.1
User Manual