1
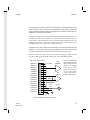
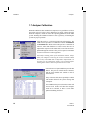
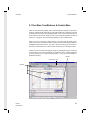
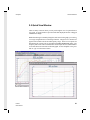
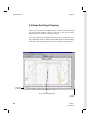
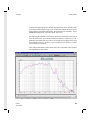
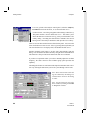
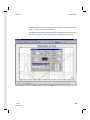
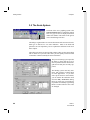
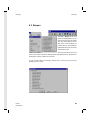
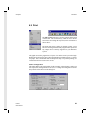
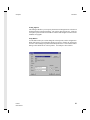
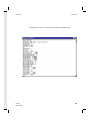
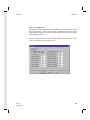
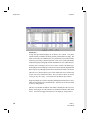
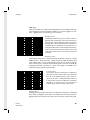
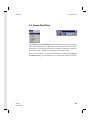
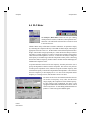
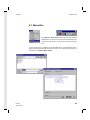
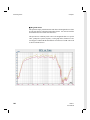
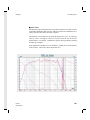
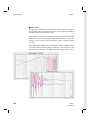
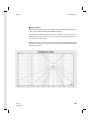
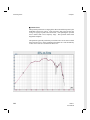
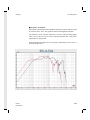
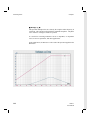
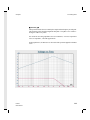
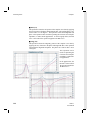
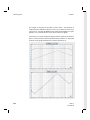
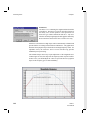
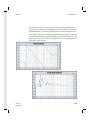
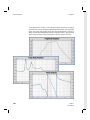
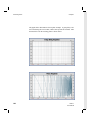
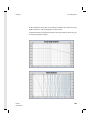
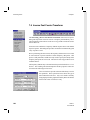
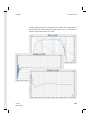
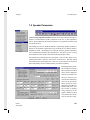
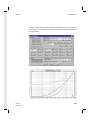
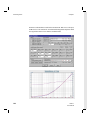
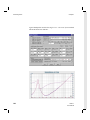
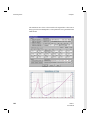
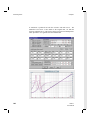
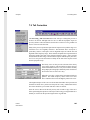
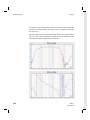
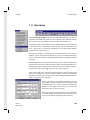
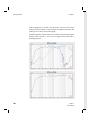
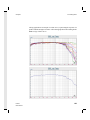
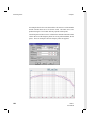
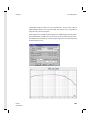
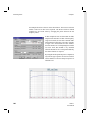
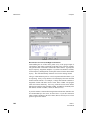
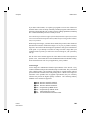
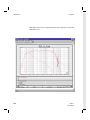
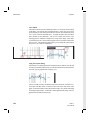
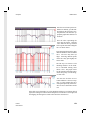
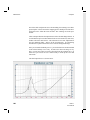
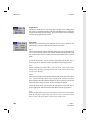
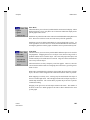
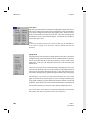
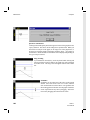
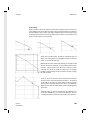
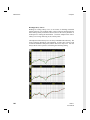
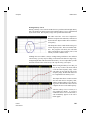
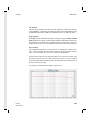
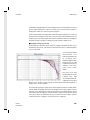
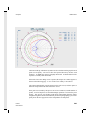
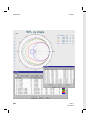
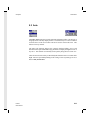
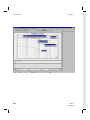
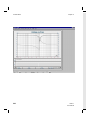
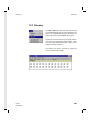
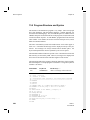
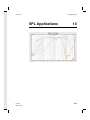
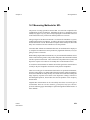
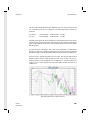
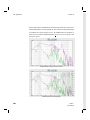
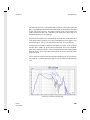
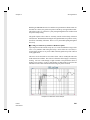
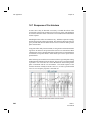
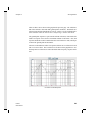
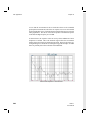
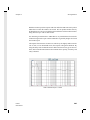
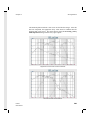
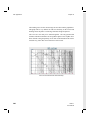
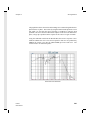
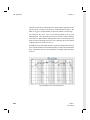
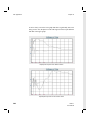
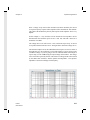
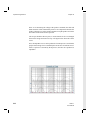
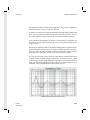
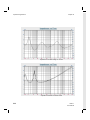
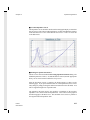
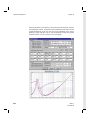
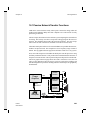
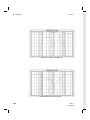
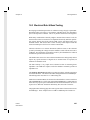
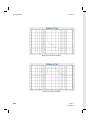
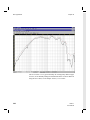
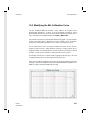
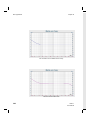
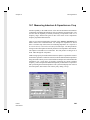
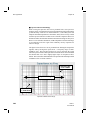
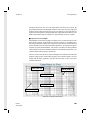
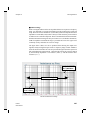
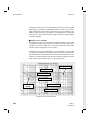
Chapter 14
SPL Applications
The graph here shows the phase response produced from the minimum phase
transform. This phase curve does not contain the delay components that were
present in the summation response method. The reason for this is that the minimum
phase transform has no way of knowing whether a single driver produced the
response, or a combination of drivers through the use of a crossover.
The phase response produced from the summation of the individual ranges is the
actual true phase for the system. This method can and should be used when the total
phase of a system is required which contains the non-minimum phase components
caused by multi-way crossovers.
While the magnitude response curves are the same, the phase response differences
between the two methods will produce very different time domain graphs. The two
graphs on the following page show the step and impulse responses derived from the
minimum phase and magnitude. The top graph shows the step and impulse
responses derived from the phase and magnitude of the summation system curve.
Minimum Phase response for System.
LMS 4.1
User Manual
303