1
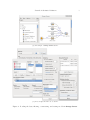
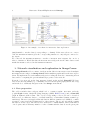
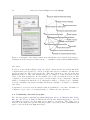
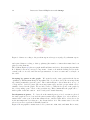
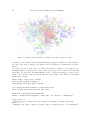
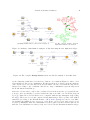
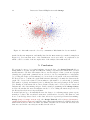
10
Interactive Network Exploration with Orange
Figure 3: A subgraph of the Pubmed article network with the selected article “Detecting protein function and protein-protein interactions. . . ,” visualized together with 14 similar articles.
and others.
For the node-level indices (Figure 4(b)), the widget outputs another network in which the
computed indices are appended to each node in the same way as, for instance, the Net File
widget appends the data read from the file. This data can then be explored in the Net
Explorer widget or other data analysis widgets, for example to build a prediction model
based on the network structure. For an example, refer to the case study in Section 4.3. The
computed node level indices are node degree, average neighbor degree, clustering coefficient,
number of triangles in which the node participates, number of cliques, degree centrality,
closeness centrality, betweenness centrality, information centrality, core number, eccentricity,
and others.
Computation of selected network analytic tasks is parallelized to save time. In multi-core
computers, one processor core is always left free to enhance the user experience.
3.4. Community detection in graphs
Two label propagation clustering algorithms (Raghavan, Albert, and Kumara 2007; Leung,
Hui, Liò, and Crowcroft 2009) are implemented in the Net Clustering widget. As both
algorithms are iterative, the user must set the number of iterations. The widget gets a
network on the input, and appends clustering results to the network data. Communities can
then be explored in the Net Explorer widget.