1
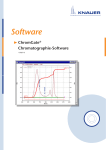
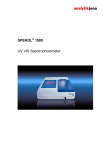
Optimize Integration Events
3.
Figure 64
At the bottom of the Instrument window is a Graphical Integration Toolbar that
can be used to graphically enter Integration parameters into the method.
The Instrument window’s Graphical Integration
toolbar.
Left Status Bar
message area
Tool Tips
pop-up message
Right Status Bar
message area
4.
First, you will set the new Threshold values for your data sample.
5.
Click on the Threshold button located on the Graphical Integration toolbar.
Notice
The tools can be identified by the caption in
the Left Status bar (at the bottom left of the
Instrument window) or the Tool Tips pop-up
message. To see either of these, hold the
cursor over the button.
Figure 65
Threshold button.
Threshold Button
6.
As you move the cursor over the chromatogram, the arrow will turn into a “+”
sign accompanied by a moving vertical bar which is used to set the location of
the graphical integration function selected. When no integration function is
selected, this cursor can also be used to select and zoom in on any area of the
chromatogram.
Optimizing the Method
Artisan Technology Group - Quality Instrumentation ... Guaranteed | (888) 88-SOURCE | www.artisantg.com
7-3