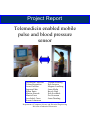
1
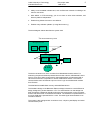
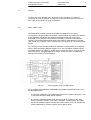
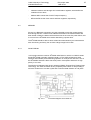
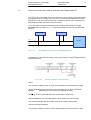
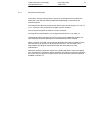
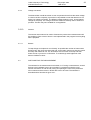
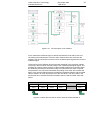
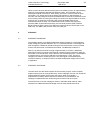
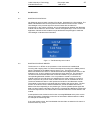
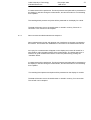
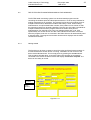
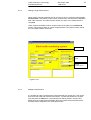
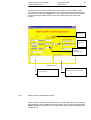
Project Report
Telemedicin enabled mobile
pulse and blood pressure
sensor
Ana Belén Cabrerizo
Tobias Bergström
Anna Carlsson
Ingemar Edin
Erkan Emin
Mattias Enstedt
Martin Ernst
Ana Isabel Carro
Svante Johansson
Thomas Könberg
Erik Larsson
Magnus Lundberg
Jonas Melin
Kaveh Nadi
Erik Svedbäck
Per Svensson
Jonas Örnehag
Department of Computer Science and Electrical Engineering
Division of Industrial Electronics
Luleå University of Technology
Industrial Electronics
EIS-project 2000
1999-05-20
1
ABSTRACT
The last course, in the MSc in Electrical Engineering – Industrial Electronics, at Luleå
University of Technology, is a project course.
This year the goal was to produce a blood pressure and pulse measurement device.
It was supposed to be used in elderly care since it is an inconvenience for them to
have to go to a hospital just to measure their pulse and blood pressure. With this
device these measurements can be made in their home environment which would
help them to relax and make the measurement more accurate. A doctor would also
be relieved of a lot of work since he would be able to run measurements parallel with
other work and then come back to analyse them at a later point. It would also be
easier to compare with previous measurements since it would be possible to store the
measurements from each patient on “their own” homepage. The device is built around
a Mitsubishi processor, M16C/62, and it communicates with Internet via Ethernet and
Bluetooth. The report describes how the problems were solved and what was
produced by the groups in the different areas such as the processor,
electromechanics, user interface and Bluetooth.
Antenna AB was our partner in working with this project.
Luleå University of Technology
Industrial Electronics
EIS-project 2000
1999-05-20
2
FOREWORD
The aim of the project course is to develop better ability to formulate and solve
technical problems, both independently and as a group. Together with knowledge
from earlier courses a deeper knowledge in basic principles and an overview of the
area of computer science and electrical engineering, is striven for. The course should
also develop and improve the technique of presentation.
We were seventeen students taking the project course this year and the idea was to
do something with Embedded Internet Systems (EIS). We wanted to do the project
working towards a company since we figured it would add more inspiration to the
work and therefore we begun searching for an interesting partner on the fall of 1999.
The project started in January 2000 in co-operation with Antenna AB. The objective
was to build a blood pressure measurement device that could communicate with
Internet. Magnus Ek at Antenna came up with a specification and after some changes
to make it fit us better we had the specification to use in our project.
We would like to thank all persons involved, especially Magnus Ek at Antenna AB and
the following persons:
Anders Pettersson, Master thesis student at Luleå University of Technology
Jan Johansson, Antenna AB
Jonas Andersson, Antenna AB
Jerker Delsing, Luleå University of Technology
Sven Molin, Luleå University of Technology
Lewi Lindqvist, Luleå University of Technology
Kenneth Hartvik, Luleå University of Technology
Kalevi Hyyppä, Luleå University of Technology
Peter Widetun, Abelko Innovation AB
Thord Isaksson, Abelko Innovation AB
Magnus grandmother, for helping us out as a model
Luleå University of Technology
Industrial Electronics
EIS-project 2000
1999-05-20
INTRODUCTION
Antenna AB, is a Swedish electronics firm situated in Kalix with 15 years of
experience in designing radio and telecommunications products and systems. The
Antenna Group has two business areas, Antenna Care and Antenna Research &
Development. Antenna Care develops, produces and markets Care Systems and
Carephones for elderly and handicapped people. Antenna Development is a
consulting company within radio applications and telecommunication. Activities
include contract assignments for the electronic industry in the area of
telecommunications as well as development of our own products within the Antenna
group, mainly personal safety systems.
Their interest in the concept of Bluetooth and how they could integrate that in their
products, both new and old lead to this project.
3
Luleå University of Technology
Industrial Electronics
EIS-project 2000
1999-05-20
4
GENERAL DESCRIPTION
With Internet in almost every home now, a lot of interesting new concepts opens in
the area of medical treatment. There are a lot of small things that elderly people might
find annoying and we thought one of them is the trips they have to take to the doctor
just to check their blood pressure. It takes them almost a whole day to get there and
back sometimes just to make such a simple medical examination. There ought to be a
way of doing these tests without having to go to the hospital and a doctor. With the
new Bluetooth technology there is also a tool to avoid annoying cables and to have to
be on the same place for each measurement.
The device makes it possible to stay at home and perform your everyday chores if
you want to and then at a certain hour you sit down in your own comfortable chair and
relax while the doctor performs the measurement from his office. There are two
different types of measurements that can be performed, either a single measurement
at any hour or a continuous measurement with a number of measurements during the
whole day. The pulse often changes during different hours of the day since you are
more active on certain times than others hence making a number of measurements is
the preferred method since it gives a more accurate material for comparing the pulse
with previous measurements.
Two examples of when this device could be of good use is:
♦
When a patient is being released from hospital he/she has been there a few days
just so that the pulse and blood pressure can be monitored and made sure to be
all right. With this device it would be possible to send them home earlier, a relief
both for the patient and the hospital economy. It assumes that the patient have
got Internet access at home.
♦
It could also be very useful in homes for the elderly. The doctor could instruct a
nurse on location on which patient he wants to make the measurement on a
particular day, for example by phone or e-mail, and the nurse could assist the
patient in getting the device ready.
Moreover the use of Internet technology can be of interest because of
♦
Well known and spread technology; no need to reinvent the wheel.
Luleå University of Technology
Industrial Electronics
EIS-project 2000
1999-05-20
5
♦
Ability to use available infrastructure, such as Ethernet networks in buildings. No
need for new wires.
♦
With WWW- or FTP-technology you do not have to write client software, and
become platform independent.
♦
Enables long distance access or surveillance.
♦
Enables easy software updates. (If using flash memory.)
The block diagram below describes the system built
The measurement system
Bloodpressurecuff
Measurement
device
Bluetooth
Air
Ethernetbridge
Bluetooth
Ethernet
ethernetcable Computer
WWW
The device is based on a micro controller from Mitsubishis M16C62 series. For
measuring the pulse and blood pressure Motorola has a device, MPX50500P, that is
used. A pump from Aldax constructed for these applications complemented with a
valve from Pneutronics completes our actual measurement device. The Internet
communication uses an Ethernet chip from Cirrus Logic and the Bluetooth module
from Ericsson.
The M16C62 has 256kB flash memory and 20kB RAM built-in.
The hardware design of the Bluetooth-Ethernet bridge is based on a serial-Ethernet
bridge, designed by Anders Petterson LTU. The serial interface on that bridge has
been changed to a Bluetooth interface using the Uart 0 transceiver on the processor
and the Uart transceiver on the Bluetooth module. The hardware is implemented on a
four layer PCB and is powered with 3.3 volts. The radio signal is transmitted via an
inverted F-antenna.
The system is also equipped with a real time clock, a liquid crystal display and serial
communication ports.
Luleå University of Technology
Industrial Electronics
1
2
3
4
5
6
7
EIS-project 2000
1999-05-20
6
Terminology ........................................................................................................................................7
The processor.....................................................................................................................................8
2.1 Usage..............................................................................................................................................9
2.2 Real time clock ................................................................................................................................9
2.3 Memory .........................................................................................................................................10
2.3.1 Serial E2PROM ......................................................................................................................10
2.4 Interfacing the real time clock and the E2PROM using I2C............................................................11
2.5 LCD display ...................................................................................................................................12
2.6 Processor setup ............................................................................................................................12
2.7 Software ........................................................................................................................................12
2.7.1 Device drivers and tasks ........................................................................................................13
2.7.2 RTXC Adaptation ...................................................................................................................14
2.7.3 Priorities .................................................................................................................................15
2.8 RTXC ............................................................................................................................................15
2.8.1 Why did we choose a RTOS? ................................................................................................15
2.8.2 The RTOS – RTXC ................................................................................................................15
Pressure and pulse measurement ....................................................................................................16
3.1 Introduction ...................................................................................................................................16
3.1.1 The oscillometric method .......................................................................................................16
3.2 Measurement procedure ...............................................................................................................16
3.3 Hardware.......................................................................................................................................17
3.3.1 Arm cuff..................................................................................................................................17
3.3.2 Box .........................................................................................................................................18
3.3.3 Pump......................................................................................................................................18
3.3.4 Pressure sensor .....................................................................................................................19
3.3.5 Filter .......................................................................................................................................19
3.3.6 Battery....................................................................................................................................21
3.3.7 Air valve .................................................................................................................................21
3.3.8 Transistors .............................................................................................................................21
3.3.9 Voltage converters .................................................................................................................22
3.3.10 Summer ..............................................................................................................................22
3.3.11 Buttons ...............................................................................................................................22
3.4 Software for the measurement ......................................................................................................22
Ethernet ............................................................................................................................................24
4.1 Ethernet Hardware. .......................................................................................................................24
4.2 Ethernet Software. ........................................................................................................................24
Bluetooth...........................................................................................................................................25
5.1 Bluetooth protocol. ........................................................................................................................25
5.2 Bluetooth device driver..................................................................................................................25
5.2.1 The PBPS-protocol ................................................................................................................26
5.2.2 Functional description ............................................................................................................29
User manual .....................................................................................................................................29
6.1 User interface................................................................................................................................29
6.1.1 Start a manual measurement sequence ................................................................................30
6.1.2 Start a remote-controlled measurement sequence ................................................................31
6.2 The ELTEK health monitoring manual for windows ......................................................................32
6.2.1 Getting started .......................................................................................................................32
6.2.2 Making a single measurement ...............................................................................................33
6.2.3 Multiple measurements ..........................................................................................................33
6.2.4 Battery check and Bluetooth link status .................................................................................34
6.2.5 Disconnection and reset ........................................................................................................35
6.2.6 Remember .............................................................................................................................36
6.2.7 Problems ................................................................................................................................36
Appendix 1 LCD functional description .............................................................................................37
Luleå University of Technology
Industrial Electronics
1
EIS-project 2000
1999-05-20
TERMINOLOGY
ALU
CGI
CMOS
CRC
DBP
DMA
EEPROM
FPGA
HTML
IP
IPX
LAN
LCD
M16C
RAM
RLE
RTC
RTOS
RTXC
SBP
SRAM
SSI
Arithmetic Logic Unit
Common Gateway Interface
Complementary Metal Oxide Semiconductor
Cyclic Redundancy Check
Diastolic Blood Pressure
Direct Memory Access
Electrically Erasable Programmable Read Only Memory
Field Programmable Gate Array
HyperText Markup Language
Internet Protocol
Internet Packet Exchange
Local Area Networking
Liquid Crystal Display
Microcontroller Mitsubishi M16C60/61/62
Random Access Memory
Run Length Encoding
Real Time Clock
Real Time Operating System
The RTOS used
Systolic Blood Pressure
Static Random Access Memory
Server Side Include
7
Luleå University of Technology
Industrial Electronics
2
EIS-project 2000
1999-05-20
8
THE PROCESSOR
The M16C/62 group of single-chip microcomputers from Mitsubishi are built using the
high-performance silicon gate CMOS process using a M16C/60 Series CPU core and
are packaged in a 100-pin plastic moulded QFP. These microcomputers operate
using sophisticated instructions featuring a high level of instruction efficiency. Due to
the 1M bytes of address space, they are capable of executing instructions at high
speed. The built-in multiplier and DMAC make them ideal for controlling office,
communications, industrial equipment, and other high-speed processing applications.
The M16C/62 has a wide range of built-in peripheral devices, such as A-D converter,
D-A converter, timers, UART and CRC calculation circuit. Fig. 2.1 shows the blockdiagram of the M16C/62 group.
Fig. 2.1
Block-diagram of the M16C/62 group.
The M30624FGLFP is the CPU used in this project. Is has 256KB FLASH ROM,
20KB RAM and are using a 3.3V supply voltage. This one is ideal to be used in an
embedded system and the low power consumption is important in this application.
Luleå University of Technology
Industrial Electronics
2.1
EIS-project 2000
1999-05-20
9
USAGE
To set up the microcontroller many things has to be considered. To make the
equipment as small as possible as many built-in devices should be used. This will
also make the equipment as cheep as possible.
2.2
REAL TIME CLOCK
The PCF8563 is a CMOS real-time clock/calendar optimised for low power
consumption. A programmable clock output, interrupt output and voltage-low detector
is also provided. All address and data are transferred serially via a two-line bidirectional I2C-bus. Maximum bus speed is 400 kbits/s. The built-in word address
register is incremented automatically after each written or read data byte. Provides
year, month, day, weekday, hours, minutes and seconds based on 32.768 kHz quartz
crystal.
As is shown in its block-diagram below the PCF8563 contains sixteen 8-bit registers
with an auto-incrementing address register, an on-chip 32.768kHz oscillator with an
integrated capacitor, a frequency divider which provides the source clock for the realtime Clock (RTC), a programmable clock output, a timer, an alarm, a voltage-low
detector and a 400kHz I2C-bus interface.
Fig. 2.2.1
Block-diagram of the PCF8563 group.
All 16 registers are designed as addressable 8-bit parallel registers although not all
bits are implemented:
-
The first two registers (memory addresses 00H and 01H,called in the figure 0 and
1), are used as control and/or status registers.
-
The memory addresses 02H through 08H are used as counters for the clock
function (seconds, minutes, hours, days, weekdays, months/century and years).
Except the weekdays register, the rest are coded in BCD format, for example the
month assignment for January is 00001 and for May is 00101.
Luleå University of Technology
Industrial Electronics
2.3
EIS-project 2000
1999-05-20
-
Address locations 09H through 0CH contain alarm registers, which define the
conditions for an alarm.
-
Address 0DH controls the CLKOUT output frequency.
-
0EH and 0FH are the timer control and timer registers, respectively.
10
MEMORY
If there is no Bluetooth connection we have to be able to store the measurements
done during that time. Therefore we added an E2PROM. If the measurements had
been stored in RAM, the data would have been lost in the case of a power failure, this
is not true for the E2PROM which retains data during a power down.
The E2PROM should be able to store at least 48 measurements (one measurement
each hour during 48 hours), but we have a large margin in this case.
2.3.1
Serial E2PROM
In this project we have used an E2PROM called X24C16, which is a CMOS 16.384
bit serial E2PROM, internally organised 2048 x 8. The X24C16 features a serial
interface and software protocol allowing operation on a simple two-wire bus. One of
this E2PROM's features is that it has a low power consumption and that is of high
priority in our case.
The X24C16 is fabricated with Xicor's advanced CMOS Textured Poly Floating Gate
Technology. The X24C16 utilises Xicor's proprietary Direct Write TM cell providing a
minimum endurance of 100 000 cycles and a minimum data retention of 100 years.
Fig. 2.2.2
Functional-diagram of the X24C16.
Luleå University of Technology
Industrial Electronics
2.4
EIS-project 2000
1999-05-20
11
INTERFACING THE REAL TIME CLOCK AND THE E2PROM USING I2C
The I2C bus is a multi-master bus communications inter-IC control protocol developed
by Phillips that is now used by many IC’s. An I2C bus mode provides efficient control
between IC’s. It is a two-way bus line with a simple two-wire structure consisting of a
serial data line (SDA) and a serial clock line (SCL).
In our case the Processor is configured to be the only master and the RTC and
EEPROM works as slaves. Fig. 2.4.1 shows the interface for the RTC and E2PROM
using I2C.
EEPROM
RTC
SCL
M16C
SDA
Fig. 2.4.1
The interface over the RTC and E2PROM using I2C
The bitstream on the SDA line during a write cycle to the RTC and E2PROM is shown
in the figure bellow
Fig. 2.4.2
Master Transmits to slave receiver
Where:
-S is the Start condition, which is a high to low transition of SDA when SCL is high.
-SLAVE ADDRESS is the seven bits, which correspond to the RTC or E2PROM
address
(depending on the device that is working as slave).
- R / W is bit of the salve address which set the write or read mode.
-WORD ADDRESS is the byte that defines which register is to be accessed.
-A is the acknowledge bit that is used to indicate successful data transfer.
-DATA is the output data byte.
-P is the Stop condition, which is a low to high transition of SDA when SCL is high.
Luleå University of Technology
Industrial Electronics
2.5
EIS-project 2000
1999-05-20
12
LCD DISPLAY
The LCD display is capable of 8x2 characters and has a fontsize of 5*7 dots. The first
display we ordered was a Optrex DMC 50448. It worked on the starterkit (Mitsubishi
MSA0654-G01) but unfortunately it broke and we tried to order a new one from Elfa,
but they did not have any in stock. Instead they recommended a LSS3H202XA from
ALPS which was supposed to be equivalent with the Optrex model. The ALPS display
did not come with any manual, but we figured out that it would work with the device
driver written for the Optrex. We have however not been able to get it to work, even
though the device driver has been checked with a logic analyser, and it is correct if
compared with instructions in the Optrex manual.
A functional description of the display is available in appendix 1.
2.6
PROCESSOR SETUP
These are the pins that must be set up the right way to get the processor to work in
the correct mode in our application: Single chip mode, because we do not have any
external memory using the external data and address bus.
CNVss
Pull down
BYTE
Pull down.
AVcc
AVss
/RDY
+ 3.3 V
Ground
Pull up
/NMI
Pull up
/Hold
Reset
Pull up
Pull up
Table 2.5.1
2.7
Selects processor mode, connected to Vss to set up
processor in Single chip mode.
Selects the width of the external data bus. Should be
connected to Vss when operating in single chip mode.
Analog power supply input
Analog power supply input
Not used in single chip mode
Non-Maskable Interrupt, an interrupt is generated when
this pin is set to low.
Not used in single chip mode
A low on this input resets the processor.
Set-up pins for the M16C
SOFTWARE
All software have been written by us, but we could use some parts of last years
project, the code that came with the evaluation board and some examples for the
devices used.
All code is written in C and is run on top of RTXC, which is a real time operating
system. The software is divided into different tasks and these are given different
priorities.
Luleå University of Technology
Industrial Electronics
2.7.1
EIS-project 2000
1999-05-20
13
Device drivers and tasks
The buttons, who are interrupt driven, signals on a semaphore that is read by the
button task. The task then takes suitable action depending on the state of the
measuring device.
The measurement task controls the pump and the valve by turning pins on or off, 3 V
or 0 V. These pins are connected to the gate of a FET transistor.
The two pressure signals are read by 8 bit AD converters.
The algorithms are described in 5.4 on page 23 and a brief in 5.2 on page 16.
The Bluetooth task is managing all communication with the Bluetooth module. The
other tasks will send their data frames to the bluetooth task when needed.
When a set time command is received from Bluetooth that frame is passed on to the
RTC task which can set time of day and date in the RTC. The RTC task is also
responsible of providing the measurement task with time stamps for each
measurement.
Whenever something should be written to the display that data is sent to the display
task. This task then controls the display hardware and makes sure that the messages
are shown long enough and not get mixed up. More information about the display is
available in section 2.5.
Luleå University of Technology
Industrial Electronics
EIS-project 2000
1999-05-20
Bluetooth
module
14
Intertaskcommunication
Device driver for
hardware
Bluetooth
task
Real time
clock
Display
task
Display
Button
task
Buttons
RTC
task
Measuring task
Pressure
sensor
Fig. 3.1.1
2.7.2
Valve
Pump
Block-scheme for the device drivers and tasks.
RTXC Adaptation
The code for the device drivers has been written in three stages. The first stage was
to write them in pseudo-code, the next stage was to make them work on the naked
processor and the last stage was to make the code run ontop of the RTXC.
Step 1:
Pseudo code
Step 2:
Convert pseudo-code to low level C-routines
Step 3:
Modify the low-level C-routines allowing them to run
ontop of RTXC
Luleå University of Technology
Industrial Electronics
2.7.3
EIS-project 2000
1999-05-20
15
Priorities
All the tasks need an assigned priority to work in RTXC. The priorities depend on how
the tasks are supposed to work. Some tasks have to run in regular time interval,
some must not be interrupted and then some can be executed when nothing else
happens.
Assigning priorities is a difficult thing to do. The best way to decide which priority a
task must have is often to test it by running the tasks.
2.8
RTXC
2.8.1
Why did we choose a RTOS ?
The system requires the following criterions:
The system is under pressure of time critical events e.g. it has to be able to respond
to sudden events caused by peripheral devices.
Events should be able to have different priorities
Resource-sharing, semaphores and time-slicing is needed
Although the above requirements could be implemented separately, it is a lot easier
to use a RTOS since the RTOS does include all of the above requirements.
2.8.2
The RTOS – RTXC
There was no thoughts spent on which RTOS to choose since we already had a
RTOS to use from last years project. The name of the RTOS is RTXC and is provided
by Embedded Power. Below in table 3.1 some data about RTXC are shown.
PART
RTXC
Kernel
About 10kb
Max interrupt latency
Min context switch
Dynamic processes
Nested interrupts
Multi tasking
9 cycles
91 cycles
Yes
Yes
Pre-emptive, Round Robin,
Time slicing
90 days
Support
Table 4.2.1
Data describing RTXC.
Luleå University of Technology
Industrial Electronics
EIS-project 2000
1999-05-20
16
Although it is difficult to calculate the total OS overhead (processor power needed by
the RTOS), we can see that the OS overhead caused by the interrupt latency and the
context switch is pretty low. This is important since the OS overhead has to be as low
as possible in an application where speed and time are critical. In our application we
have such a situation and decided to use RTXC since it is a good RTOS for these
circumstances.
3
PRESSURE AND PULSE MEASUREMENT
3.1
INTRODUCTION
3.1.1
The oscillometric method
The oscillometric method for measuring the blood pressure is used by the majority of
the automatic devices on the market today. The main concept of the oscillometric
method is to use an inflatable cuff that surrounds the upper arm. First you inflate the
cuff to a pressure above the systolic blood pressure. Then start to reduce the air
pressure until the amplitude of the pressure in the cuff suddenly grows larger. This
pressure is very close to the systolic blood pressure. Then continue to reduce the air
pressure and the blood pressure amplitude will continue to increase until maximum
amplitude is reached. After that the blood pressure amplitude will decrease rapidly.
The diastolic blood pressure is taken at the end of that rapid decrease.
3.2
MEASUREMENT PROCEDURE
A measurement starts with closing of the valve. Then the pump starts to inflate the
cuff. When a pressure of about 200 mmHg is reached, the pump is turned off. At this
time we will not be able to detect any pulse beats because the pressure in the cuff is
to high to let the blood pass. The next step is to slowly let the air out by opening the
valve. During the deflation we continuously measure the filtered part of the pressure
signal (figure 5.2.1.) and the pressure signal directly from the pressure sensor
(Figure 5.2.2.). For the signal measurement we use two AD converters on the
microprocessor. Every time the filtered pressure signal exceeds a certain threshold
value, we save the absolute pressure signal and the time when it occurred. After a
while the pulse signal is too small to exceed the threshold value because of too low
air pressure in the cuff. At this time the measurement is over. The first pressure value
that was stored is the SBP and the last one is the DBP. To calculate the pulse we use
the number of pulse beats and the time information for every pulse beat. We calculate
the pulse by taking the number of pulses registered and divide it with the time during
these pulses.
Luleå University of Technology
Industrial Electronics
EIS-project 2000
1999-05-20
17
Figure 5.2.1 The filtered pressure signal.
Figure 5.2.2 The unfiltered pressure signal
3.3
HARDWARE
3.3.1
Arm cuff
The arm cuff is manufactured by Riester and consists of two parts. One outer part is
made of fabrics and the inner part is a vessel made of rubber.
Luleå University of Technology
Industrial Electronics
EIS-project 2000
1999-05-20
18
Figure 5.3.1.1 The cuff
3.3.2
Box
The box was chosen to be large enough to fit all our devices and at the same time
small enough to fit on the cuff. The choice became a standard plastic box from ELFA.
The box was then modified for the display and the tubes from the cuff.
Figure 5.3.2.1 The Box. A=94mm, B=137mm and C=26mm
3.3.3
Pump
The pump is a Miniature Diaphragm pump made by ASF Thomas, type 3004.
The supply voltage is 6V but in our case it is directly connected to a 9V battery which
will not cause any problems for us. It consumes up to 360mA when in use.
Luleå University of Technology
Industrial Electronics
EIS-project 2000
1999-05-20
19
Figure 5.3.3.1 The miniature diaphragm pump.
3.3.4
Pressure sensor
The pressure sensor that we use is a Motorola MPX5050. It measures the difference
in pressure between the two connections. The supply voltage is 5V and it consumes
500mA out of the battery when in use. Our cuff is connected to one of the two
connections. The sensor is shown in figure 5.3.4.1.
Figure 5.3.4.1 The pressure sensor.
3.3.5
Filter
The output from the pressure sensor is sent through a highpass filter to one AD
converter. It is also sent directly to another AD converter. The filter is used to extract
the pulse signal from the cuff pressure. The filter consists of two RC networks, which
determine two cut-off frequencies. Motorola recommended the filter for applications
like ours in one of their application notes. The filter is shown in figure 5.3.5.1 and the
corresponding frequency plot in figure 5.3.5.2.
The oscillation signal from the sensor varies between 12mV and 36mV depending on
the pulse strength. The amplification factor of the amplifier is around 150 depending
on the frequency. That will give an output signal between 5mV and 3.5V from the
filter.
Luleå University of Technology
Industrial Electronics
EIS-project 2000
1999-05-20
Figure 5.3.5.1 The filter.
Figure 5.3.5.2 Frequency plot of the filter.
20
Luleå University of Technology
Industrial Electronics
3.3.6
EIS-project 2000
1999-05-20
21
Battery
The goal for the powersupply was to be able to run one measurement every hour
during two days. The pump needs 6V to carry out the task of inflating the cuff. The
pump will use a lot of power for a short time and that will cause a temporary voltage
drop. Due to this we had to use a higher voltage for our application. Our choice
became a rechargeable 9V Nickel Metal Hydride because it can handle momentarily
voltage drops quite well. The 6LR61 type of batteries does also have a square shape
that really uses the space efficiently and it has connectors that are easy to place.
3.3.7
Air valve
The valve is a Pneutronics Series 25. The supply voltage is 5V and it consumes 0.5W
when in use. The valve is a normally open type, due to safety aspects. If for example
the battery will run out of power the valve will automatically open and the cuff deflate.
If needed there is nothing stopping us from switching the valve. We have not tested
that enough to tell if it is better to switch it or just limit the outflow by decreasing the
output area. Generally, switching can be hazardous and cause disturbances.
Figure 5.3.7.1 The valve.
3.3.8
Transistors
Efficient controlling of devices can be carried out using MOSFET transistors. They
use almost no current and are controlled by the microprocessors digital outports. To
secure current to the pump we used a similar transistor that could handle larger
currents since the first kind kept burning up. To make sure that the transistors will not
burn we’ve put a diode on both the pump and the valve. Without the diodes high
voltages might build up and destroy the transistor. The high voltages are produced
when turning off inductive loads.
The transistor that we use to control the light emitting diodes, the summer and the
valve is the FDV303N from Fairchild. After a short time of trial and error we concluded
that this transistor was not able to control the pump. Therefore we use the NDT3055L
by the same manufacturer.
Luleå University of Technology
Industrial Electronics
3.3.9
EIS-project 2000
1999-05-20
22
Voltage converters
The best solution would have been to use components that all use the same voltage.
In a device of this complexity it proved to be impossible to meet that demand so we
had to use voltage converters. The different voltage levels are 3.3V, 5V and battery
voltage for the pump. The voltage converters used were already used in Antenna’s
products. Therefor they were suitable for our application.
3.3.10
Summer
The summer was meant to be used to forewarn the person that a measurement will
be carried out. Due to lack of time it is not implemented in the program but everything
else is prepared.
3.3.11
Buttons
To keep things as simple and “user friendly” as possible the number of buttons was
limited to two. We chose two rather big and “user friendly” buttons so that they would
feel easy and reliable to use. The two buttons are to function as a stop and start
button and as a yes and no confirmation. To make things extra legible we used
buttons of different colour.
3.4
SOFTWARE FOR THE MEASUREMENT
The software for the measurement is all written in C. During a measurement, several
devices in the hardware have to be controlled. For example turning the pump,
summer and LED’s on and off and closing and opening the valve. The processor’s
AD-converters and the timers in RTXC also have to be used. The software is
described with a flowchart in figure 5.4.1.
Luleå University of Technology
Industrial Electronics
EIS-project 2000
1999-05-20
23
Figure 5.4.1 The description of the software.
In the measurement task we begin to allocate and start the timer that we use as a
clock during the measurement. Then the valve closes and the AD-converters are
initiated. Two AD-converters are used, one for the filtered pulse signal and one for the
unfiltered signal.
The drivers for all the different devices used are described in the processor chapter.
The pump is then turned on and the polling of the unfiltered pulse signal begins. The
pumping will continue until a pressure of approximately 200mmHg is reached. When
the 200mmHg threshold is reached the pump is turned off and the valve is opened.
The pressure in the cuff will now decrease and polling of the other AD-converter will
begin. Every time the filtered pressure exceeds the threshold value the AD-converted
value is stored in an array of pairs as one of the two values. The other value in the
pair that has to be saved is the time information when the AD-converted value was
saved.
Pressure 1
Pressure 2
Pressure 3
Pressure
Pressure n
Time 1
Time 2
Time 3
Time 4
Time n
Figure 5.4.2 Data structure that is used to store the measured data in.
Luleå University of Technology
Industrial Electronics
EIS-project 2000
1999-05-20
24
When a pulse has been detected the program uses a delay function for approximately
450ms to avoid detecting disturbances between pulses. Then the polling of the
filtered pulse signal will continue. When polling, the timer in RTXC is used for timer
information. If no pulses are found the polling will continue for approximately 15
seconds, then the polling will stop and an ERROR will be returned. If pulses are found
but no further pulses are coming the polling will continue for approximately 2 seconds
and then stop. If pulses are found the pulse will be calculated and then the
measurement result is ready. The measurement result contains the high blood
pressure (SBP, Systolic Blood Pressure), the low blood pressure (DBP, Diastolic
Blood Pressure) and the pulse. The SBP is the pressure value in the first pair in the
data array. The DBP is the pressure value in the last pair.
4
ETHERNET
4.1
ETHERNET HARDWARE.
The hardware design of the Ethernet-Bluetooth bridge is based on a serial Ethernet
bridge, designed by Anders Petterson at LTU. The serial interface on the bridge has
been changed to a Bluetooth interface using the Uart 0 transceiver on the processor
and the Uart transceiver on the Bluetooth module. The Bluetooth module is a
ROK-101 by Ericsson that has a range of approximately 10 meters. A Mitsubishi
M16C/62 processor is used and the Ethernet controller and the transformer pass the
information on to the Ethernet. On the board is also a timekeeping ram. The hardware
is implemented on a four layer PCB and is powered with 3.3 volts. The layout
changes were made in Orcad layout plus. The radio signal is transmitted via an
inverted F-antenna. A component list for the Ethernet-Bluetooth bridge can be found
in appendix 2.
4.2
ETHERNET SOFTWARE.
The web server has the same interface as the windows program. It was compiled
together with pictures by using HTMLcomp. Via the webpage, the user can control the
pulse and blood pressure device using CGI scripts. When for example a
measurement or battery status returns from the device to the webserver, the
webpage is updated with new values using SSI functions and server push.
Instructions how to use the webpage is shown in the Eltek health manual. Other
software on the Bluetooth-Ethernet bridge is the IP stack and Ethernet driver.
Luleå University of Technology
Industrial Electronics
5
BLUETOOTH
5.1
BLUETOOTH PROTOCOL.
EIS-project 2000
1999-05-20
25
Our Bluetooth protocol stack consists of five layers, illustrated in the figure below. The
Radio and Baseband are low-level protocols with internal functions for the module.
Link Manager is the protocol layer that communicates with the electronic
environment, in this case a processor. HCI is the software link between the Bluetooth
module and the electronic environment. L2CAP, the highest layer, is not in use in this
application. Default L2CAP headers are just attached to the packages to make the
Link Manager understand the information.
Fig 5.1.1. The Bluetooth protocol stack.
5.2
BLUETOOTH DEVICE DRIVER.
The drivers run on RTXC on the processors. One device driver handles both
incoming and outgoing data. The driver is developed according to the PBPS protocol,
which is explained in the PBPS Protocol section 5.2.1. There are only small
differences between the driver on the Bluetooth-Ethernet bridge and the driver on the
measuring unit. A set up sequence runs when the driver starts up. This sequence
consists of commands that resets the module and makes it try to connect to the
corresponding Bluetooth module. If it is not possible to create a connection the
module enters into a mode where it is available for the other module to connect to.
When a request of any kind is made, a PBPS frame is sent to the Bluetooth driver.
The driver embeds the data in a HCI packet and sends it to the Bluetooth module.
The module on the receiving unit sends the HCI packet to the device driver. The first
function in the device driver, called PacketDemux, sends the data that arrives to
different functions depending on the packet type. The two possible packet types are
data or events. Data is information sent from the corresponding Bluetooth module and
events are responses to commands and/or information about the current status in the
module.
A data packet is sent forward to the function IncomingPBPSdata which picks out the
relevant information. Depending on the kind of information different tasks are called,
for example the measuring task.
If an event packet arrives, the EventHandler function finds out what kind of event it is
and if there are any errors.
Luleå University of Technology
Industrial Electronics
EIS-project 2000
1999-05-20
26
Bluetooth
Incomming
PBPSdata
Measuring
Task
PacketDemux
EventHandler
Error Handling and
confirmation.
IP Task
SendPBPSframe
Common
Arm unit
Ethernet Bridge
Bluetooth
Fig 5.2.1. Flow scheme of the Bluetooth device driver.
5.2.1
The PBPS-protocol
The PBPS-protocol (Pulse and Blood-Pressure Sensor) uses a frame with 6 fields
that is sent to the Bluetooth-driver layer.
Each field contains 1 byte of data.
PBPS-frame
Command
Param 1
1 byte
1 byte
Param 2
1 byte
Param 3
1 byte
Param 4
1 byte
Param 5
1 byte
Luleå University of Technology
Industrial Electronics
5.2.1.1
EIS-project 2000
1999-05-20
27
Command field
The command field is used to identify an instruction and the parameter fields are used
to transport command-specific data.
Command
Description
Nr of params
0
Make a measurement
1
1
Check Bluetooth-link status
0
2
Measurment completed
5
3
Check Battery-status
0
4
Bluetooth-link status checked
0
5
Battery-status checked
1
The blood-pressure device as well as the webserver will have this protocol
implemented but in practise both will not use all commands.
There is lots of space for future functions.
5.2.1.2
Make a measurement
Command:
0
Param 1:
Patient -id
Param 2-5:
0
(unique nr of patient 0-255)
Is sent from the webserver when a distance measuring will be performed.
Expects Command 2 in return.
5.2.1.3
Check Bluetooth-link status
Command:
1
Param 1-5:
0
Luleå University of Technology
Industrial Electronics
EIS-project 2000
1999-05-20
Can be sent by both devices.
Expects Command 4 in return.
5.2.1.4
Measurement completed
Command:
2
Param 1:
Patient -id
Param 2:
Systolic Blood Pressure (high bloodpressure)
Param 3:
Diastolic Blood Pressure (low blood pressure)
Param 4:
Pulse
Param 5:
Time
(unique nr of patient)
Expected as return command when command 0 is sent or if a local measurement
has been performed.
5.2.1.5
Check battery-status
Command:
3
Param 1-5:
0
Used to check the battery-status of the blood-pressure device. Can only be sent by
the webserver.
Expects command 5 in return.
5.2.1.6
Bluetooth-link status checked
Command:
4
Param 1-5:
0
28
Luleå University of Technology
Industrial Electronics
EIS-project 2000
1999-05-20
29
Expected as return when command 1 is sent.
5.2.1.7
Battery-status checked
Command:
5
Param 1:
battery-status (Scale of 1-10)
Expected as return when command 3 is sent or automatically when the bloodpressure device has low battery-status.
Commands 6-255 are reserved for future use.
5.2.2
Functional description
The PBPS protocol is implemented to keep the same framesize at all times but can
easily be changed by the FRAMESIZE parameter. When an ACL data packet is
received the function incomingPBPSdata() and here the HCI and L2CAP head will
be removed and the remaining PBPSframe will be returned. When sending a PBPS
frame the function Send PBPSframe() will be called. This function adds the correct
HCI and L2CAP heads to the PBPSframe and sends it to the serialport.
6
USER MANUAL
6.1
USER INTERFACE
A measurement can be done in two different ways. You can either choose to start a
measurement manually by pushing the “Start/Yes”-button on the measuring device or
to do it by remote control via a terminal connected to a computer network (LAN and/or
Internet). This way the nurse for example does not need to be physically present
during the measurement.
You only need to have a web-browser installed on your computer to be able to log on
to the Internet and establish connection to the measuring device. After a
measurement has finished the data is sent over to the web-browser and will be
presented on the screen immediately. It is also possible to store the collected data in
the web-browser in some appropriate format to be able to view it later and compare.
Luleå University of Technology
Industrial Electronics
EIS-project 2000
1999-05-20
30
If you get a green light on the net status indicator this means that it has successfully
established a communication link to the LAN (Local Area Network). If you do not get a
green light this means that the measuring device for some reason could not connect
to the LAN. The data from the measurements will now instead be saved in a memory
inside the device until connection is established in the future.
If you get a red light on the battery status indicator it means that the battery needs to
be charged or possibly exchanged.
The display on the device will show both the blood pressure (SBP and DBP) and
pulse of the patient. It also shows the patient-ID directly after start up.
Pushing the “No/Stop” -button at any time during a measurement sequence can
always interrupt a measurement.
Figure 8.1.1.1 Measurement device
6.1.1
Start a manual measurement sequence
It is important that the patient lies or sits down during the measuring phase. This is for
being able to make good measurements.
Start by pushing the “Yes/Start”-button to make the measuring device ready to make
a measurement. The device will automatically create a communication link to the local
computer network (LAN) and the status of the link will be notified. The patient-ID will
then show up on the display. If it is correct, push the “Yes/Start”-button to
acknowledge.
Luleå University of Technology
Industrial Electronics
EIS-project 2000
1999-05-20
31
A measurement will be performed. The blood pressure and pulse will be presented on
the display in real-time during the measurement, but this information is not interesting
for the patient.
The resulting blood pressure and pulse will be presented on the display for a while.
The data will be sent over to the web-browser or stored in memory if there is no
connection. The cuff will now be emptied.
6.1.2
Start a remote-controlled measurement sequence
Start a measurement via the web-browser user interface at a computer connected to
the Internet. The browser then establishes a connection to the measurement device.
An inquiry for a measurement will appear on the display and a tone will sound for a
short while to make the patient aware of the measurement. The patient has to lie or
sit down, for good measurement results. Confirm the patient-ID by pushing the
“Yes/Start”-button.
A measurement will be performed. The blood pressure and pulse will be presented on
the display in real-time during the measurement, but this information is not interesting
for the patient.
The resulting blood pressure and pulse will be presented on the display for a while.
The data will be sent over to the web-browser or stored in memory if no connection.
The cuff will now be emptied.
Luleå University of Technology
Industrial Electronics
6.2
EIS-project 2000
1999-05-20
32
THE ELTEK HEALTH MONITORING MANUAL FOR WINDOWS
The ELTEK health monitoring system is a windows based program used for
controlling the wireless pulse and blood pressure device. It has an easy interface for
making measurements on a patient. The program has functions for making single or
multiple measurements, Bluetooth link status and battery control. When making
measurements, a unique identification number of the patient can be chosen so that
the measuring results can be easily identified. The user can also make a schedule for
multiple measurements and the program itself will at certain times perform
measurements. For example once every hour between 06:00 and 11:00. (Not
implemented) The sensor device can also order a Bluetooth link status check and
when the program finds such a command in the PBPS frame it will automatically send
a response back. The program has a status window which displays how the latest
command succeeded.
6.2.1
Getting started
The first thing to do when we want to control the pulse and blood pressure sensor is
to make sure that the sensor device is running. Thereafter we can connect to the
device via the Bluetooth link. This is simply done by pressing the connect button.
This procedure will take about 10 seconds. When the computer is successfully
connected to the device the status window will display Connection complete. The
device is now ready to control.
Connect
Status
Window
Figure 6.2.1.1
Luleå University of Technology
Industrial Electronics
6.2.2
EIS-project 2000
1999-05-20
33
Making a single measurement
When making a single measurement, all you have to do is to press the button single
measurement. If the patient accept to do a measurement, the result will be displayed
after a few moments. The status window will tell you when a new measurement is
completed.
There is also a possibility to add a unique number of the patient in the Patient ID
window. This makes it easier to control multiple patients. The patient number needs
to be a number between 0 and 255.
Patient ID
Measurement
result
Single
measurement
Figure 6.2.2.1
6.2.3
Multiple measurements
It is possible to order a measurement to be performed at a certain time. This can be
done using the advanced measurement section. Just add the patients ID, the start
time and press the add button. The measurement will be placed in a queue and
displayed in the measurement timetable. When the measurement has taken place,
the result will be displayed in the result table window.
Luleå University of Technology
Industrial Electronics
EIS-project 2000
1999-05-20
34
Sometimes one may like to make several measurements in time intervals. This is
done the same way by adding the patients ID, the start time and the interval between
measurements and press the add button. The scheduled measurements are listed in
the measurement timetable window. Each result will be displayed in the result
window.
Patient ID
Add start
time here.
Number of
multiple
measurements.
Figure 6.2.3.1.
Here multiple measurements
will be listed.
6.2.4
Here the result from the
measurements will be listed
Battery check and Bluetooth link status
When the sensor device has low battery power it will alert the user of this program by
itself. But there is also a possibility to make a battery control. Simply press the button
battery check. In the window next to the button the battery status will be displayed in
a scale of 0-10.
Luleå University of Technology
Industrial Electronics
EIS-project 2000
1999-05-20
35
There is also a good thing to know if the Bluetooth link is still working. Pressing the
button Net control does this. The result will be displayed in the window next to the
button.
Net control
Battery
6.2.5
Disconnection and reset
When no measurements are expected, the Bluetooth link can be turned off.
This is done by pressing the disconnect button. The status window will display
disconnected after a few moments. There is also a possibility that the status window
shows disconnection failed. That means that the link is already down by some
reason.
Luleå University of Technology
Industrial Electronics
EIS-project 2000
1999-05-20
36
Disconnect
6.2.6
Remember
There is always a possibility for the patient to make a manual measurement. When
that measurement is completed the result will automatically be shown in the single
measurement section and the status window will alert that a measurement has taken
place.
6.2.7
Problems
If the status window displays unexpected commands and the Bluetooth link does not
work, you can always try to reset the modules by pressing the reset button and then
try to reconnect. This will normally fix the problem but if it does not, a hardware reset
can be done on the modules.
During long measuring times the program will receive some commands that the user
do not need to care about. The program indicates this by displaying command
complete in the status window.
Luleå University of Technology
Industrial Electronics
7
EIS-project 2000
1999-05-20
37
APPENDIX 1 LCD FUNCTIONAL DESCRIPTION
LCD functional description
Software Initialisation of the display
Before any data can be presented on the display it has to be initialised, this is
done by sending the following sequence of commands.
Wait more than 15ms after Power on (Vcc = 4.5V)
RS R/W DB7 DB6 DB5 DB4 DB3 DB2 DB1 DB0
0 0
0 0
1
1 x
x x
x
No data should be transferred to or from
the display during this time.
Function Set Command: (8-Bit interface)
BF cannot be checked before this command.
No data should be transferred to or from
the display during this time.
Wait more than 4.1ms
RS R/W DB7 DB6 DB5 DB4 DB3 DB2 DB1 DB0
0 0
0 0
1
1 x
x x
x
Function Set Command: (8-Bit interface)
BF cannot be checked before this command.
No data should be transferred to or from
the display during this time.
Wait more than 100μs
RS R/W DB7 DB6 DB5 DB4 DB3 DB2 DB1 DB0
0 0
0 0
1
1 x
x x
x
RS R/W DB7 DB6 DB5 DB4 DB3 DB2 DB1 DB0
0 0
0 0
1
1 N
F x x
Function Set Command: (8-Bit interface)
After this command is written, BF can be checked.
Function Set
0
0
0
0
0
0
1
0
0
0
Display OFF
0
0
0
0
0
0
0
0
0
1
Clear Display
0
0
0
0
0
0
0
1
I/D S
Entry Mode Set:
0
0
0
0
0
0
1
1
C
Display ON
Initialisation Complete,
Display Ready.
B
(Interface = 8 bits, Set No. of
lines and display font)
(Set C and B for cursor/Blink
options.)
Luleå University of Technology
Industrial Electronics
EIS-project 2000
1999-05-20
38
Writing data to the display
The procedure to write data to the display is to first select if the data is to be
written to the instructionregister (IR) or the Dataregister (DR), this is done by
setting the RS pin either high (DR) or low (IR). In a write command the R/W
should be low. The enable pin (E) is set high and the data is written to the
data pins (DB0 –DB7) and when the enable pin is set to low the data is
“clocked” into the display.
RS
2.0V
2.0V
0.8V
0.8V
tAS
tAH
R/W
0.8V
0.8V
tAH
PWE
tEr
E
2.0V
2.0V
0.8V
0.8V
tDS
tEr
2.0V
DB0 ~ DB7
0.8V
t
effective data
0.8V
2.0V
0.8V
tcycl