1
Appendix / ANALYSIS SCRIPTING
135
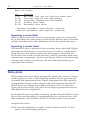
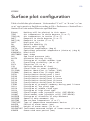
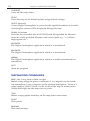
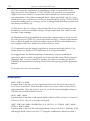
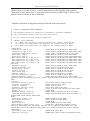
SMTP=[number] Allow this number of smoothing passes
(default 1)
SMTC=[number] Set smoothing coefficient (0 to 1 only)
(default 0.5)
SSUM=[f1,f2] Calculates sum of fields f1 and f2
SDIF=[f1,f2] Calculates difference of fields f1 and f2
SAVG=[f1,f2] Calculates average of fields f1 and f2
SMLT=[f1,f2] Calculates product of fields f1 and f2
SDVD=[f1,f2] Calculates quotient of fields f1 and f2
SADC=[f1,#] Calculates sum of field f1 and any number #
SSBC=[f1,#] Calculates difference of field f1 and any
number #
SMLC=[f1,#] Calculates product of field f1 and any
number #
SDVC=[f1,#] Calculates quotient of field f1 and any
number #
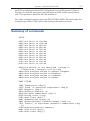
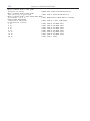
OUTPUT
* UNIVERSAL OUTPUT COMMANDS
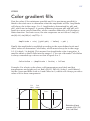
COLOR=r,g,bSetdrawcolortocolorr=red,g=green,b=blue (each
is 0-255)
STOR= nStorefieldin slot n (1-9)
* SCALAR OUTPUT COMMANDS
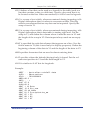
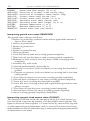
DATA Data grid values
CONT Contour (defaults to contour interval of 1)
VAON Allow plotting of numeric values below minimum/
maximum (default)
VAOF Prohibit plotting of numeric values below minimum/
maximum
NMCY Plot highs and lows in special NMC font (default is
according to Preferences > Analysis)
NMCN Plot highs and lows in standard font (default is
according to Preferences > Analysis)
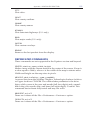
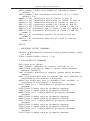
HILO Plots H or L above data at gridpoint maximum/
minimum
HIID Plots H above data at gridpoint maximum
LOWD Plots L above data at gridpoint minimum
MXMN Plots H or L above data at gridpoint maximum/
minimum
MAXD Plots H above data at gridpoint maximum
MIND Plots L above data at gridpoint minimum
DVCV Plots H or L above data at gridpoint maximum/
minimum
DVVD Plots H above data at gridpoint maximum
CVVD Plots L above data at gridpoint minimum
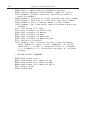
PLMN Plots H or L above data at gridpoint maximum/
minimum
PLLD Plots H above data at gridpoint maximum