1
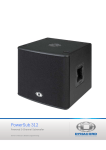
Shimadzu IRAffinity-1
User Guide and Tutorial for Taking IR Measurements
in the Reynolds Research Group
2nd Edition: April 2012
Georgia Institute of Technology
School of Chemistry & Biochemistry
School of Materials Science and Engineering
Written by: Natasha B. Teran
1
Table of Contents
1.
Introduction................................................................................................................................................... 3
1.1. Basic Principles of Infrared Spectroscopy................................................................................ 3
1.2. .......................................................................................................................................................................... 3
2. The Shimadzu IRAffinity-1 Spectrometer .......................................................................................... 3
2.1. Diagram of the sampling accessories and their specific applications ..............................
3. How to Use the IRAffinity-1 FTIR system and the IRSolution software................................. 4
3.1. Sampling Accessory Selection and Installation ...................................................................... 4
3.1.1.
MIRacle Single Reflection Horizontal ATR Accessory ................................................ 4
3.1.2.
30Spec 30 Degree Specular Reflectance Accessory .................................................... 5
3.1.3.
EasiDiff Diffuse Reflectance Accessory ............................................................................ 5
3.2. Starting up the FTIR system .......................................................................................................... 5
3.2.1.
Trouble shooting initialization errors .............................................................................. 8
3.3. Data acquisition .................................................................................................................................. 8
3.3.1.
Setting the Scanning Parameters ....................................................................................... 8
3.3.2.
Obtaining a Background Spectrum ................................................................................. 12
3.3.3.
Sample Preparation and Sampling Procedure ........................................................... 13
3.4. Data collection .................................................................................................................................. 13
3.5. Spectral Manipulation ................................................................................................................... 14
3.6. Data processing ............................................................................................................................... 14
3.7. Data templates and printing ....................................................................................................... 14
3.8. Library searching ............................................................................................................................ 14
3.9. Cleaning the Sampling Accessory ............................................................................................. 14
4. Common applications for Reynolds Group..................................................................................... 15
4.1. ....................................................................................................................................................................... 15
5. Special applications ................................................................................................................................. 15
5.1. Attenuated Total Reflectance ..................................................................................................... 15
5.2. Specular reflectance ....................................................................................................................... 15
5.3. Diffuse reflectance .......................................................................................................................... 15
5.4. ....................................................................................................................................................................... 15
6. Transferring data and preparation of spectra using other graphing software ................ 15
7. Care and maintenance of the instrument ........................................................................................ 15
7.1. Protection against humidity ....................................................................................................... 15
7.2. Protection against vibrations ..................................................................................................... 15
8. General Trouble shooting ...................................................................................................................... 23
2
Shimadzu IRAffinity-1 User’s Manual
1. Introduction
1.1.
Basic Principles of Infrared Spectroscopy
Infrared (IR) spectroscopy is one of the most common techniques used in organic
chemistry for the identification of structural characteristics of various substances or
mixtures thereof. When an organic compound is subjected to electromagnetic radiation in
the infrared frequency range (780 nm to 1000 µm, or 13,000 to 10 cm-1), the absorbed
resonant frequencies give the molecules enough energy to allow their bonds to stretch,
bend or rotate more actively. The resonant frequency depends on the strength of the bond,
which in turn depends on the atoms connected by the bond, the type of bond involved, and
to a certain extent, the environment around each bond.
Specifically, the mid-infrared range (4000 to 400 cm-1) of frequencies is the most useful in
organic chemistry. Most functional groups have characteristic absorptions in this frequency
range, and these characteristic absorptions are used to identify what functional groups are
present in a sample. The characteristic absorptions of some common functional groups can
be found in section ______________.
1.2.
2. The Shimadzu IRAffinity-1 Spectrometer
The Shimadzu IRAffinity-1 Spectrometer, like most FTIR spectrometers, makes use of a
Michelson interferometer with a movable mirror. A schematic diagram of this instrument is
shown in Figure 1.
The IRAffinity-1 uses a high-energy long life ceramic light source (1), which sends light to a
spherical mirror (2). The beam is then converged at the aperture (3), and is sent to the
collimator (4) to make parallel beams that are sent to the interferometer.
The beam splitter (6,7) divides the light beam to the fixed mirror (8) and the moving
mirror (9). When the distance between the beam splitter and the fixed mirror equals the
distance between the moving mirror and the beam splitter, the beams are in phase, and
interfere constructively. When the moving mirror is displaced by ¼ of the wavelength of
3
Comment [BR1]: I’ve moved this to the
appendix
the beam from the source, the two beams will be out of phase and will interfere
destructively. This optical path difference is measured very accurately via a He-Ne laser.
In the IRAffinity-1, the beam splitter is made of a potassium bromide substrate on which
germanium is evaporated. This beam splitter is very easily damaged by moisture, and as
such, it is protected with a moisture resistant coating. Furthermore, the instrument is
equipped with a dehumidifier. Nevertheless, care must be taken to avoid moisture building
up in the instrument.
These two beams are then reflected by two flat mirrors (10, and 11), and are converged at
another mirror (13). The resulting parallel interfered beam then goes through the sample
compartment. Thereafter, the beam goes through another converging mirror (14) and then
to the detector (15). For this instrument, the detector is a DLATGS (deuterated L-alanine
triglycene sulfate) pyroelectric detector, which has a high sensitivity and does not require
cooling.
Figure 1.
As explained above, the instrument is sensitive to humidity, and, therefore, it has been
equipped with a ROSAHL dehumidifier, which keeps the instrument at low humidity.
However, this unit must constantly be connected to a power supply to keep the
dehumidifier running.
3. How to Use the IRAffinity-1 FTIR system and the IRSolution software
3.1.
Sampling Accessory Selection and Installation
Comment [BR2]: I’ve moved the table to the
appendix as well
3.1.1. MIRacle Single Reflection Horizontal ATR Accessory
For most types of samples, such as oils, powders, crystals, free-standing polymer films,
pastes, and intractable materials, the PIKE Technologies MIRacle sampling accessory is
suitable. This accessory allows for single- or multi-reflection attenuated total reflectance
(ATR) and specular reflectance measurements. In the common configuration, the MIRacle
accessory is a single-reflection ATR sampling accessory. This is used for most samples, as it
allows characterization of thick or strongly absorbing samples without any need for sample
preparation.
To install this accessory, place the entire accessory into the sample compartment of the
spectrometer, with the PIKE label facing outward. Align the base plate of the accessory on
the spectrometer with the use of the pins on the accessory, and the corresponding holes on
the spectrometer. Fasten the accessory using the captive screw located on the left side of
the accessory base plate, and tighten by hand.
4
Generally, the accessory will not require any alignment once installed. If, however, there is
a need to realign or fine-tune the accessory, inform the person-in-charge. The IRSolution
software, may, however, run an autoadjustment, which will be discussed later.
3.1.2. 30Spec 30 Degree Specular Reflectance Accessory
The Specular Reflectance accessory is most commonly used for thin films of samples that
do not transmit infrared light. (to be continued)
3.1.3. EasiDiff Diffuse Reflectance Accessory
(to be continued)
3.2.
Starting up the FTIR system
Turn on the spectrometer by pressing the power switch (remember: the instrument should
always be connected to a power source). Turn on the computer and monitor attached and
log into your GT account. Once Windows has completed the PC start-up process, doubleclick on the [IRSolution] icon on the desktop to start the FTIR software.
When available, the instrument stores the background spectrum obtained from the latest
use. Thus, usually, you will see the following message upon opening the IRSolution
software:
5
Since it is best to obtain a background spectrum just before obtaining your sample
spectrum, it is advisable to click [No] on the above message window.
The instrument has been preconfigured to initialize as soon as the IRSolution software
starts. Initialization may be verified on the Status window displayed on the bottom left
corner of the IRSolution window. Upon successful initialization, the Status window should
reflect this, as shown below.
However, should this not occur, you can manually initialize the instrument by clicking the
Measurement menu and then choosing ReInitialize.
6
Again, the Status window should display the INIT success message upon a successful
initialization.
If a sampling accessory is in place, the spectrometer may need to perform an automatic
adjustment, which resets certain parameters to accommodate the change in the optical
path. The following dialog box will appear:
7
Click [OK]. The instrument will take a few minutes to perform the auto-adjustment, and a
progress bar will be displayed.
Check to make sure that all messages shown for a successful initialization are present (see
above).
3.2.1. Trouble shooting initialization errors
3.3.
Data acquisition
3.3.1. Setting the Scanning Parameters
Normally, the Scan Parameters need not be changed, but if necessary, it can be found while
on the Measure tab, on the bottom right corner of the screen. It consists of five tabs,
namely: Data, Instrument, More, Files, and Advanced.
8
3.3.1.1.
Data Tab
The Data tab gives five parameters to set:
9
3.3.1.1.1.
Measurement Mode
In measurement mode, select whether the measured spectra are to be displayed in
absorbance or transmittance modes. Usually, IR spectra are displayed in transmittance
mode. However, for purposes of quantitation, it is more appropriate to display the spectra
in absorbance mode.
This mode also gives the option of obtaining a Power spectrum. (WHY??? WHAT FOR???)
3.3.1.1.2.
Apodization
The Apodization function selected is a tapering function that smoothes the interferogram
obtained by the instrument to zero at the ends of the sampled region. It affects the
resolution and the signal-to-noise ratio (S/N ratio) of the spectra, so proper selection is
necessary. Under most common measurements, the Happ-Genzel is selected. For
measurements of high resolution, Box-Car may be selected. For small samples requiring
high S/N ratio, SqrTriangle may be selected.
3.3.1.1.3.
No. of Scans
The number of scans (1 to 4000) affects the S/N ratio of the obtained spectra. For a better
S/N ratio, a larger number of scans can be selected at the expense of a longer measurement
time. Normally, the parameter is set to collect 20 scans.
3.3.1.1.4.
Resolution
For solids and liquids, a resolution of 4 or 8 cm-1 is sufficient. For gas samples, some minute
absorption peaks may be neglected at these resolutions. Therefore, a resolution of 0.5 cm -1
is usually desired. Higher resolutions lead to longer measurement times and poorer S/N
ratios, and therefore, setting to higher resolutions than necessary is not recommended.
3.3.1.1.5.
Range
The Range set depends on the desired measurement and the detector. Most commonly for
this instrument, a minimum of 400 and a maximum of 4000 cm-1 are set.
3.3.1.2.
Instrument Tab
The Instrument tab parameters are only changed when the instrument is coupled with an
external IR microscope or a different sampling kit from the standard sample compartment
and the MIRacle sampling accessory. Changing these parameters will be discussed under
the section for Sampling Accessories.
The normal settings are:
Beam: Tab
10
Comment [E3]: You mean “quantification”?
Detector: Standard
Mirror Speed: 2.8
3.3.1.3.
More Tab
3.3.1.4.
Files Tab
The Files tab is used to set the saving parameters, such as the destination directory and the
file name. To set, click the [Save As…] button. To load saved parameters, click the […]
button.
11
3.3.1.5.
Advanced Tab
3.3.2. Obtaining a Background Spectrum
Make sure that the particular sampling accessory to be used with your sample is in place in
the sample compartment. Without any sample loaded onto the accessory, take a
background measurement. While on the Measure tab of the main window, click the [BKG]
button. A dialog box will appear requiring you to verify that no sample is in the path of the
beam:
(screen shot)
Confirm that this is so, and click the [OK] button. Background measurement will commence
and the spectra scanned will be displayed under the View tab while it is being updated in
real-time, while the progress of background measurement will be displayed on the status
bar on the lower left corner of the screen.
(screen shot)
12
A normal background spectrum will look like the one shown above for
measurements taken in air. If the background spectrum you obtain differs from this, check
to make sure there is no sample on the sample holder, or that the crystal plate for the
MIRacle accessory is thoroughly cleaned (refer to the cleaning section if necessary).
3.3.3. Sample Preparation and Sampling Procedure
3.3.3.1.
MIRacle Single Reflection Horizontal ATR Accessory
As noted above, no sample preparation is required for the MIRacle accessory, but make
sure that the sample is at room temperature. Begin by making sure that the swiveling arm
of the pressure clamp is detached or directed away from the sample plate, and raised at a
sufficient height so that it is elevated a good distance from the sample plate surface.
(figure)
Once a background spectrum has been obtained (see above for instructions), load enough
sample to fully cover the 1.8mm sampling area in the center of the crystal plate. For oils,
data collection can be done without using the pressure clamp. For solids and soft pliable
films for which an intimate contact between the sample and the crystal surface is not
readily ensured, use the pressure clamp. If the pressure clamp is not already mounted on
the accessory, mount it to the backside of the accessory using the two alignment dowel pins
on top of the MIRacle accessory base and using a flathead screwdriver, fasten the two
captive screws on the clamp frame.
Swivel the arm of the pressure clamp so that the tip is directly above the crystal plate (a
locking mechanism with an audible click prevents swinging the arm farther than
necessary). Lower the pressure tip so that it is in contact with the sample by rotating the
large black control knob on the clamp column until an audible click is heard. This control
knob features a ratchet-type clutch mechanism that protects the crystal from damage from
over-pressuring by controlling the maximum allowable pressure applied on the crystal.
Proceed with data collection.
3.3.3.2.
30Spec 30 Degree Specular Reflectance Accessory
The Specular Reflectance accessory is most commonly used for thin films of samples that
do not transmit infrared light. (to be continued)
3.3.3.3.
EasiDiff Diffuse Reflectance Accessory
(to be continued)
3.4.
Data collection
Once the sample has been loaded onto the proper sample holder, click the Measure tab and
then click the [Sample] button. Sample spectra will be collected and once again the
progress in measurement will be displayed in the status bar, while the real-time window
will display the sample spectrum in transmittance mode.
13
While spectra is being collected, the measurement can be paused and restarted. Click the
[Stop] button to pause. The following dialog box will appear:
(screen shot)
To stop the measurement and display the spectrum (up to the number of scans obtained),
click the [Stop] button on the dialog box. To stop measurement and abandon the data
acquired, click the [Abort] button. To resume measurement, click the [Cancel] button.
Once the measurement is completed, the main window will switch to the View tab. The
spectra will be displayed in two windows, with the upper window being the full view of the
spectra, called the “Overview” window, while the lower window being the Zooming
window.
3.5.
Spectral Manipulation
3.6.
Data processing
3.7.
Data templates and printing
3.8.
Library searching
3.9.
Cleaning the Sampling Accessory
14
4. Common applications for Reynolds Group
4.1.
5. Special applications
5.1.
Attenuated Total Reflectance
5.2.
Specular reflectance
5.3.
Diffuse reflectance
5.4.
6. Transferring data and preparation of spectra using other graphing
software
7. Care and maintenance of the instrument
7.1.
Protection against humidity
7.2.
Protection against vibrations
8. General Trouble shooting
9. Appendix
9.1.
Formatted: Heading 1, Indent: First line: 0"
Diagram of the sampling accessories and their specific applications
Sample
Analytical form and analytical
Accessory
condition
Solids
Rubbers
Total reflectance method
ATR-8000A, etc.
MIRacle
Dura sampler
Powders
Liquid film method
Demountable cell
Total reflectance method
ATR-8000A, etc.
KBr pellet method
KBr die + hydraulic press +
vacuum pump
Nujol method
Demountable cell
15
Diffuse reflectance method
DRS-8000A(mix with KBr
powder)
Paper, cloth,
Total reflectance method
yarns
ATR-8000A, etc
MIRacle
Dura sampler
Transmission method
Film holder(Use a grid polarizer
for study of molecular
orientation)
Film, plastics
Total reflectance method
ATR-8000A, etc
MIRacle
Dura sampler
Transmission method
Film holder(Use a grid polarizer
for study of molecular
orientation)
Demountable cell(Evaporate the
Film method
solvent to obtain the film)
Grind
SiC sampler
Coating films on
Thicker than
Total
ATR-8000A(Measurement to a
metals
1µm
reflectance
depth of 1/5 of the wavelength
method
with a KRS-5 prism and to 1/10
with a Ge prism)
Specular
SRM-8000A
reflectance
method
Thinner than
Reflection
RAS-8000A(Use of a grid
1µm
absorption
polarizer enhances sensitivity
spectrometry
about two times)
Mix with KBr
KBr pellet
KBr die + hydraulic press +
powder
method
vacuum pump
16
Coating films on
Diffuse reflectance method
DRS-8000A
Total reflectance method
ATR-8000A(Measurement to a
resins
depth of 1/5 of the wavelength
with a KRS-5 prism and to 1/10
with a Ge prism)
Specular reflectance method
SRM-8000A(Convert a reflection
spectrum into an absorption
spectrum by the Kramers-Kronig
method)
Liquids
Semiconductors
Direct measurement
Film holder
Oil content
Measures mineral oils only
Quartz cell
Also measures animal/plant oils
CaF2 cell
Liquid film method
Demountable cell
Solution method
Fixed thickness cell, sealed liquid
measurement
Nonvolatile
organic solvents
Volatile organic
solvents
cell
Rapid
Liquid film
measurement
method
Aqueous
Above 10% in
Liquid film
solutions
concentration
method
Below 10% in
ATR method
concentration
Demountable cell
Demountable cell with KRS-5
Horizontal type or cylinder
internal reflection type ATR
attachment
Extract solutions
Difference
Solution
Fixed thickness cell
spectrometry
method
Evaporate
Diffuse
DRS-8000A(The sample solution
solvent
reflectance
is supplied dropwise on KBr
method
powder and measured after
evaporating the solvent)
17
Gases
% level
5cm/10cm gas cell
ppm level
Long-path gas cell(Detection
limit is 0.1~1ppm with 10m
optical path)
Micro/trace samples
Liquids(µL level)
Micro cell
Solids(µ level)
AIM-8800(Applicable to
transmission, reflection, and ATR
methods
Source: http://www.shimadzu.com/an/spectro/ftir/accessory/guide.html
9.2.
Bond
Table 1. Characteristic Infrared Absorptions of Common Functional Groups
Type of bond
Specific type of bond
Absorption
Formatted: Heading 2, Indent: First line: 0",
Line spacing: single
Appearance
peak
C─H
alkyl
methyl
1260 cm−1
strong
−1
1380 cm
weak
−1
2870 cm
medium to strong
−1
2960 cm
methylene
medium to strong
−1
1470 cm
strong
−1
2850 cm
medium to strong
−1
2925 cm
vinyl
medium to strong
−1
methine
2890 cm
C═CH2
−1
weak
900 cm
strong
−1
2975 cm
medium
−1
3080 cm
medium
C═CH
3020 cm−1
medium
monosubstituted alkenes
900 cm−1
strong
990 cm−1
cis-disubstituted alkenes
trans-disubstituted alkenes
strong
−1
670–700 cm
−1
965 cm
strong
strong
18
aromatic
trisubstituted alkenes
800–840 cm−1
strong to medium
benzene/sub. benzene
3070 cm−1
weak
monosubstituted benzene
−1
700–750 cm
−1
690–710 cm
ortho-disub. benzene
meta-disub. benzene
−1
750 cm
750–800 cm
860–900 cm
alkynes
aldehydes
any
any
−1
800–860 cm
−1
3300 cm
−1
2720 cm
strong
strong
−1
−1
para-disub. benzene
strong
strong
strong
strong
medium
medium
−1
2820 cm
C─C
acyclic C─C
monosub. alkenes
1,1-disub. alkenes
cis-1,2-disub. alkenes
trans-1,2-disub. alkenes
trisub., tetrasub. alkenes
conjugated C─C
dienes
1645 cm−1
−1
1655 cm
−1
1660 cm
−1
1675 cm
−1
1670 cm
−1
1600 cm
−1
1650 cm
−1
medium
medium
medium
medium
weak
strong
strong
with benzene ring
1625 cm
strong
with C═O
1600 cm−1
strong
1640–
medium
C═C (both sp2)
any
1680 cm−1
aromatic C═C
any
1450 cm−1
weak to strong (usually 3 or 4)
1500 cm−1
1580 cm−1
1600 cm−1
C≡C
terminal alkynes
2100–
weak
2140 cm−1
disubst. alkynes
2190–
very weak (often indisinguishable)
−1
2260 cm
C═O
aldehyde/ketone
saturated aliph./cyclic 6-
1720 cm−1
membered
19
α,β-unsaturated
1685 cm−1
aromatic ketones
1685 cm−1
cyclic 5-membered
1750 cm−1
cyclic 4-membered
1775 cm−1
aldehydes
1725 cm−1
influence of conjugation (as with ketones)
−1
carboxylic
saturated carboxylic acids
1710 cm
acids/derivates
unsat./aromatic carb. acids
1680–
1690 cm−1
esters and lactones
1735 cm−1
influenced by conjugation and ring size (as
with ketones)
anhydrides
−1
1760 cm
1820 cm−1
acyl halides
1800 cm−1
amides
1650 cm−1
carboxylates (salts)
1550–
associated amides
1610 cm−1
amino acid zwitterions
1550–
1610 cm−1
O─H
alcohols, phenols
low concentration
3610–
3670 cm−1
high concentration
3200–
broad
−1
3400 cm
carboxylic acids
low concentration
3500–
3560 cm−1
N─H
primary amines
high concentration
3000 cm−1
broad
any
3400–
strong
−1
3500 cm
1560–
strong
−1
1640 cm
secondary amines
any
>3000 cm−1
weak to medium
ammonium ions
any
2400–
multiple broad peaks
−1
3200 cm
20
C─O
alcohols
primary
1040–
strong, broad
−1
1060 cm
secondary
~1100 cm−1
strong
tertiary
1150–
medium
−1
1200 cm
phenols
any
1200 cm−1
ethers
aliphatic
1120 cm−1
aromatic
1220–
1260 cm−1
carboxylic acids
any
1250–
1300 cm−1
esters
any
1100–
two bands (distinct from ketones, which do
−1
C─N
aliphatic amines
any
1300 cm
not possess a C─O bond)
1020–
often overlapped
−1
1220 cm
C═N
any
similar conjugation effects to C═O
1615–
−1
1700 cm
C≡N (nitriles)
R─N─C
unconjugated
medium
−1
conjugated
2230 cm
any
2165–
medium
2110 cm−1
(isocyanides)
R─N═C═S
2250 cm−1
any
2140–
1990 cm−1
C─X
fluoroalkanes
ordinary
1000–
1100 cm−1
trifluromethyl
1100–
two strong, broad bands
−1
1200 cm
chloroalkanes
bromoalkanes
iodoalkanes
N─O
nitro compounds
any
any
any
aliphatic
540–760 cm−1
−1
500–600 cm
−1
500 cm
−1
1540 cm
−1
1380 cm
weak to medium
medium to strong
medium to strong
stronger
weaker
21
aromatic
1520,
lower if conjugated
−1
1350 cm
Source: http://en.wikipedia.org/wiki/Infrared_spectroscopy_correlation_table
(update with information from other reliable sources)
Bond Type
C–H
alkyl
vinyl
Functional Group
Absorption Range (cm-1)
Assignment
Intensity
methyl
1260
1380
2870
2960
strong
weak
medium to strong
medium to strong
methylene
1470
2850
2925
strong
medium to strong
medium to strong
methine
2890
weak
C=CH2
900
2975
3080
C=CH
3020
monosubstituted
alkenes
900
990
670-700
cis-disubstituted
alkenes
aromatic
alkyne
aldehyde
trans-disubstituted
alkenes
trisubstituted
alkenes
965
800-840
benzene/substituted
benzene
monosubstituted
benzene
ortho-disubstituted
22
benzene
meta-disubstituted
benzene
C–C
acyclic
Alkenes
conjugated
C-C
C=C
benzene
C=C
Alkynes
Alkyl Halides
Alcohols
Arenes
Amines
Aldehydes and
Ketones
Carboxylic Acids
and Derivatives
Disulfides
Esters
Nitriles
Isocyanates,
Isothiocyanates,
Diimides, Azides,
Ketenes
8. General Trouble shooting
23