1
Graphical Output for the Verilog Product
Family
Product Version 1.2c
February 1993
1990-1998 Cadence Design Systems, Inc. All rights reserved.
Printed in the United States of America.
Cadence Design Systems, Inc., 555 River Oaks Parkway, San Jose, CA 95134, USA
Trademarks: Trademarks and service marks of Cadence Design Systems, Inc. (Cadence) contained in this
document are attributed to Cadence with the appropriate symbol. For queries regarding Cadence’s trademarks,
contact the corporate legal department at the address shown above or call 1-800-862-4522.
All other trademarks are the property of their respective holders.
Restricted Print Permission: This publication is protected by copyright and any unauthorized use of this
publication may violate copyright, trademark, and other laws. Except as specified in this permission statement,
this publication may not be copied, reproduced, modified, published, uploaded, posted, transmitted, or
distributed in any way, without prior written permission from Cadence. This statement grants you permission to
print one (1) hard copy of this publication subject to the following conditions:
1. The publication may be used solely for personal, informational, and noncommercial purposes;
2. The publication may not be modified in any way;
3. Any copy of the publication or portion thereof must include all original copyright, trademark, and other
proprietary notices and this permission statement; and
4. Cadence reserves the right to revoke this authorization at any time, and any such use shall be
discontinued immediately upon written notice from Cadence.
Disclaimer: Information in this publication is subject to change without notice and does not represent a
commitment on the part of Cadence. The information contained herein is the proprietary and confidential
information of Cadence or its licensors, and is supplied subject to, and may be used only by Cadence’s customer
in accordance with, a written agreement between Cadence and its customer. Except as may be explicitly set
forth in such agreement, Cadence does not make, and expressly disclaims, any representations or warranties
as to the completeness, accuracy or usefulness of the information contained in this document. Cadence does
not warrant that use of such information will not infringe any third party rights, nor does Cadence assume any
liability for damages or costs of any kind that may result from use of such information.
Restricted Rights: Use, duplication, or disclosure by the Government is subject to restrictions as set forth in
FAR52.227-14 and DFAR252.227-7013 et seq. or its successor.
Graphical Output for the Verilog Product Family
Contents
1
Introduction . . . . . . . . . . . . . . . . . . . . . . . . . . . . . . . . . . . . . . . . . . . . . . . . . . . . . . . . . 9
Who Should Read This Manual? . . . . . . . . . . . . . . . . . . . . . . . . . . . . . . . . . . . . . . . . . . . . 9
What This Manual Contains . . . . . . . . . . . . . . . . . . . . . . . . . . . . . . . . . . . . . . . . . . . . . . . . 9
New Features and Enhancements . . . . . . . . . . . . . . . . . . . . . . . . . . . . . . . . . . . . . . . . . . 10
Real Numbers and Timescales . . . . . . . . . . . . . . . . . . . . . . . . . . . . . . . . . . . . . . . . . 10
64-bit Times . . . . . . . . . . . . . . . . . . . . . . . . . . . . . . . . . . . . . . . . . . . . . . . . . . . . . . . . 11
Support for New Windows Behavior . . . . . . . . . . . . . . . . . . . . . . . . . . . . . . . . . . . . . . 11
X-Windows Performance Enhancements . . . . . . . . . . . . . . . . . . . . . . . . . . . . . . . . . . 11
Overlap in Multi-Page Plots . . . . . . . . . . . . . . . . . . . . . . . . . . . . . . . . . . . . . . . . . . . . 11
Faster Refresh of the WAVES Window . . . . . . . . . . . . . . . . . . . . . . . . . . . . . . . . . . . . 11
Change in Definition of $gr_waves_memsize . . . . . . . . . . . . . . . . . . . . . . . . . . . . . . . 12
Change in Initial WAVES Window Scale Factor . . . . . . . . . . . . . . . . . . . . . . . . . . . . . 12
Improved Scroll Buttons in WAVES and REGS Windows . . . . . . . . . . . . . . . . . . . . . 12
Groups can support more signals . . . . . . . . . . . . . . . . . . . . . . . . . . . . . . . . . . . . . . . 13
Default-size WAVES window displays 21 signals . . . . . . . . . . . . . . . . . . . . . . . . . . . . 13
Limited support for $save and $restart . . . . . . . . . . . . . . . . . . . . . . . . . . . . . . . . . . . . 13
2
Waveform Output . . . . . . . . . . . . . . . . . . . . . . . . . . . . . . . . . . . . . . . . . . . . . . . . . 15
Setting Up the Display . . . . . . . . . . . . . . . . . . . . . . . . . . . . . . . . . . . . . . . . . . . . . . . . . . .
Resizing the WAVES Window . . . . . . . . . . . . . . . . . . . . . . . . . . . . . . . . . . . . . . . . . .
Interrupting WAVES Window Drawing . . . . . . . . . . . . . . . . . . . . . . . . . . . . . . . . . . . .
Positioning and Sizing Windows with a System Task . . . . . . . . . . . . . . . . . . . . . . . . .
Customizing Colors with a System Task . . . . . . . . . . . . . . . . . . . . . . . . . . . . . . . . . .
Understanding the Default Colors . . . . . . . . . . . . . . . . . . . . . . . . . . . . . . . . . . . . . . .
X-Window Colormap Allocation Problems . . . . . . . . . . . . . . . . . . . . . . . . . . . . . . . . .
Selecting Fonts . . . . . . . . . . . . . . . . . . . . . . . . . . . . . . . . . . . . . . . . . . . . . . . . . . . . . .
Scaling Due to Fonts . . . . . . . . . . . . . . . . . . . . . . . . . . . . . . . . . . . . . . . . . . . . . . . . .
February 1993
3
16
17
19
19
20
22
22
23
23
Product Version 1.2c
Graphical Output for the Verilog Product Family
Learning a New Mouse Behavior . . . . . . . . . . . . . . . . . . . . . . . . . . . . . . . . . . . . . . . . . . .
Using 64-Bit Times . . . . . . . . . . . . . . . . . . . . . . . . . . . . . . . . . . . . . . . . . . . . . . . . . . . . .
Defining Groups . . . . . . . . . . . . . . . . . . . . . . . . . . . . . . . . . . . . . . . . . . . . . . . . . . . . . . . .
Freezing the Display . . . . . . . . . . . . . . . . . . . . . . . . . . . . . . . . . . . . . . . . . . . . . . . . . . . .
Setting the Storage Space . . . . . . . . . . . . . . . . . . . . . . . . . . . . . . . . . . . . . . . . . . . . . . .
Improving Simulator and Graphical Output Performance . . . . . . . . . . . . . . . . . . . . . . . .
Adding Signals . . . . . . . . . . . . . . . . . . . . . . . . . . . . . . . . . . . . . . . . . . . . . . . . . . . . . . . . .
Jumping to a Specified Time . . . . . . . . . . . . . . . . . . . . . . . . . . . . . . . . . . . . . . . . . . . . . .
Using the $timeformat System Task . . . . . . . . . . . . . . . . . . . . . . . . . . . . . . . . . . . . . . . .
Interacting with the Waveform Display . . . . . . . . . . . . . . . . . . . . . . . . . . . . . . . . . . . . . . .
WAVES_SCREEN . . . . . . . . . . . . . . . . . . . . . . . . . . . . . . . . . . . . . . . . . . . . . . . . . . . . . .
Time Bar . . . . . . . . . . . . . . . . . . . . . . . . . . . . . . . . . . . . . . . . . . . . . . . . . . . . . . . . . . .
Cursor and Marker Lines . . . . . . . . . . . . . . . . . . . . . . . . . . . . . . . . . . . . . . . . . . . . . .
Cursor Time, Marker Time and D Time . . . . . . . . . . . . . . . . . . . . . . . . . . . . . . . . . . .
Current List . . . . . . . . . . . . . . . . . . . . . . . . . . . . . . . . . . . . . . . . . . . . . . . . . . . . . . . . .
Interactive Display Buttons . . . . . . . . . . . . . . . . . . . . . . . . . . . . . . . . . . . . . . . . . . . . .
SELECT_SCREEN . . . . . . . . . . . . . . . . . . . . . . . . . . . . . . . . . . . . . . . . . . . . . . . . . . . . .
Fix/Unfix Signal . . . . . . . . . . . . . . . . . . . . . . . . . . . . . . . . . . . . . . . . . . . . . . . . . . . . .
Select Signal . . . . . . . . . . . . . . . . . . . . . . . . . . . . . . . . . . . . . . . . . . . . . . . . . . . . . . .
Select Blank . . . . . . . . . . . . . . . . . . . . . . . . . . . . . . . . . . . . . . . . . . . . . . . . . . . . . . . .
Interactive Display Buttons . . . . . . . . . . . . . . . . . . . . . . . . . . . . . . . . . . . . . . . . . . . . .
Using Real Numbers . . . . . . . . . . . . . . . . . . . . . . . . . . . . . . . . . . . . . . . . . . . . . . . . . . . .
WAVES Output Formats . . . . . . . . . . . . . . . . . . . . . . . . . . . . . . . . . . . . . . . . . . . . . . . . .
Displaying Partial Unknown and High-impedance Vectors . . . . . . . . . . . . . . . . . . . . .
Displaying Signal Names . . . . . . . . . . . . . . . . . . . . . . . . . . . . . . . . . . . . . . . . . . . . . .
February 1993
4
24
24
24
25
26
26
26
27
28
29
29
29
29
30
30
30
31
32
33
33
33
34
34
35
36
Product Version 1.2c
Graphical Output for the Verilog Product Family
WAVES Window Beeps When Using Cursor . . . . . . . . . . . . . . . . . . . . . . . . . . . . . . . . . . 36
Graphical Output Windows with Verilog-XL in the Background . . . . . . . . . . . . . . . . . . . . 37
Waveform Output Quick Reference . . . . . . . . . . . . . . . . . . . . . . . . . . . . . . . . . . . . . . . . . 37
3
REGS Window Output . . . . . . . . . . . . . . . . . . . . . . . . . . . . . . . . . . . . . . . . . . . 39
Setting Up the REGS Window . . . . . . . . . . . . . . . . . . . . . . . . . . . . . . . . . . . . . . . . . . . . .
Resizing the REGS Window . . . . . . . . . . . . . . . . . . . . . . . . . . . . . . . . . . . . . . . . . . . . . .
Setting the Storage Space . . . . . . . . . . . . . . . . . . . . . . . . . . . . . . . . . . . . . . . . . . . . . . . .
Jumping to a Specified Time . . . . . . . . . . . . . . . . . . . . . . . . . . . . . . . . . . . . . . . . . . . . . .
Using the $timeformat System Task . . . . . . . . . . . . . . . . . . . . . . . . . . . . . . . . . . . . . . . .
Interacting with the REGS Window . . . . . . . . . . . . . . . . . . . . . . . . . . . . . . . . . . . . . . . . .
Time Bar . . . . . . . . . . . . . . . . . . . . . . . . . . . . . . . . . . . . . . . . . . . . . . . . . . . . . . . . . . .
Interactive Display Buttons . . . . . . . . . . . . . . . . . . . . . . . . . . . . . . . . . . . . . . . . . . . . .
Using 64-Bit Time Values . . . . . . . . . . . . . . . . . . . . . . . . . . . . . . . . . . . . . . . . . . . . . . . .
Accepting Real Numbers . . . . . . . . . . . . . . . . . . . . . . . . . . . . . . . . . . . . . . . . . . . . . . . . .
REGS Output Format . . . . . . . . . . . . . . . . . . . . . . . . . . . . . . . . . . . . . . . . . . . . . . . . .
REG Window Output Quick Reference . . . . . . . . . . . . . . . . . . . . . . . . . . . . . . . . . . . . . .
39
42
43
44
44
44
44
44
45
45
46
46
4
Bar Graph Output . . . . . . . . . . . . . . . . . . . . . . . . . . . . . . . . . . . . . . . . . . . . . . . . . 47
Setting up a BARS Window . . . . . . . . . . . . . . . . . . . . . . . . . . . . . . . . . . . . . . . . . . . . . . . 47
BARS Output Formats . . . . . . . . . . . . . . . . . . . . . . . . . . . . . . . . . . . . . . . . . . . . . . . . 48
Plotting . . . . . . . . . . . . . . . . . . . . . . . . . . . . . . . . . . . . . . . . . . . . . . . . . . . . . . . . . . . . 48
February 1993
5
Product Version 1.2c
Graphical Output for the Verilog Product Family
Understanding Bar Values . . . . . . . . . . . . . . . . . . . . . . . . . . . . . . . . . . . . . . . . . . . . . . . . 48
Example Calls to $gr_bars . . . . . . . . . . . . . . . . . . . . . . . . . . . . . . . . . . . . . . . . . . . . . . . . 49
5
Timescales
. . . . . . . . . . . . . . . . . . . . . . . . . . . . . . . . . . . . . . . . . . . . . . . . . . . . . . . . 51
6
Plotting Waveforms . . . . . . . . . . . . . . . . . . . . . . . . . . . . . . . . . . . . . . . . . . . . . . . 53
Using the $ps_waves System Task . . . . . . . . . . . . . . . . . . . . . . . . . . . . . . . . . . . . . . . . .
Selecting Signals for the Plot . . . . . . . . . . . . . . . . . . . . . . . . . . . . . . . . . . . . . . . . . . . . . .
Scaling the Plot . . . . . . . . . . . . . . . . . . . . . . . . . . . . . . . . . . . . . . . . . . . . . . . . . . . . . . . .
Making Multi-Page Plots . . . . . . . . . . . . . . . . . . . . . . . . . . . . . . . . . . . . . . . . . . . . . . . . .
Performing System Administration for a LaserWriter . . . . . . . . . . . . . . . . . . . . . . . . . . . .
Sun Workstations . . . . . . . . . . . . . . . . . . . . . . . . . . . . . . . . . . . . . . . . . . . . . . . . . . . .
Apollo Workstations . . . . . . . . . . . . . . . . . . . . . . . . . . . . . . . . . . . . . . . . . . . . . . . . . .
53
54
55
55
55
55
55
7
Remote Graphics Support . . . . . . . . . . . . . . . . . . . . . . . . . . . . . . . . . . . . . . . 57
Remote Graphics on the Apollo/Aegis System . . . . . . . . . . . . . . . . . . . . . . . . . . . . . . . .
Graphics Window Scrolling Problem on Apollos . . . . . . . . . . . . . . . . . . . . . . . . . . . . . . .
Graphical Output Features Not Present in Remote Graphics . . . . . . . . . . . . . . . . . . . . .
Clarifications for Use of $save and $restart with Remote Graphics . . . . . . . . . . . . . . . . .
Setting the Graphics Host . . . . . . . . . . . . . . . . . . . . . . . . . . . . . . . . . . . . . . . . . . . . .
Saving Window Size and Position . . . . . . . . . . . . . . . . . . . . . . . . . . . . . . . . . . . . . . .
Bug Fixes . . . . . . . . . . . . . . . . . . . . . . . . . . . . . . . . . . . . . . . . . . . . . . . . . . . . . . . . . . . . .
Remote Graphics crashes after several Verilog-XL runs . . . . . . . . . . . . . . . . . . . . . .
Second Verilog-XL simulation opens closed window . . . . . . . . . . . . . . . . . . . . . . . . .
Remote Graphics does not work with Open Windows . . . . . . . . . . . . . . . . . . . . . . . .
Crash occurs on mouse click on group defined after $gr_waves . . . . . . . . . . . . . . . .
Crash caused by space in group_name . . . . . . . . . . . . . . . . . . . . . . . . . . . . . . . . . . .
February 1993
6
57
58
58
58
59
59
59
59
59
60
60
60
Product Version 1.2c
Graphical Output for the Verilog Product Family
8
Limitations . . . . . . . . . . . . . . . . . . . . . . . . . . . . . . . . . . . . . . . . . . . . . . . . . . . . . . . . . 61
General Limitations . . . . . . . . . . . . . . . . . . . . . . . . . . . . . . . . . . . . . . . . . . . . . . . . . . . . .
Sun-Specific Information . . . . . . . . . . . . . . . . . . . . . . . . . . . . . . . . . . . . . . . . . . . . . . . . .
Sun-Specific Limitations . . . . . . . . . . . . . . . . . . . . . . . . . . . . . . . . . . . . . . . . . . . . . . .
Graphics Under the Bourne Shell on Sun Workstations . . . . . . . . . . . . . . . . . . . . . .
Running Graphics from a UNIX Command File . . . . . . . . . . . . . . . . . . . . . . . . . . . . .
Apollo-Specific Information . . . . . . . . . . . . . . . . . . . . . . . . . . . . . . . . . . . . . . . . . . . . . . .
Apollo-Specific Limitations . . . . . . . . . . . . . . . . . . . . . . . . . . . . . . . . . . . . . . . . . . . . .
61
62
62
63
63
63
63
9
Bugs . . . . . . . . . . . . . . . . . . . . . . . . . . . . . . . . . . . . . . . . . . . . . . . . . . . . . . . . . . . . . . . . 65
Bug Fixes . . . . . . . . . . . . . . . . . . . . . . . . . . . . . . . . . . . . . . . . . . . . . . . . . . . . . . . . . . . . .
Segmentation fault occurs when $gr_addwaves follows a $gr_waves with no signals
Fatal error occurs when simulation time exceeds 31 bits . . . . . . . . . . . . . . . . . . . . . .
Control-c and other windows-related Verilog crashes . . . . . . . . . . . . . . . . . . . . . . . .
Initial delta value is incorrect in successive $ gr_waves calls . . . . . . . . . . . . . . . . . . .
Overlapping display of bus values in WAVES window . . . . . . . . . . . . . . . . . . . . . . . .
Core dump occurs when Graphics memory is increased more than once . . . . . . . . .
Incorrect display when $gr_addwaves follows a $gr_waves not at time 0 . . . . . . . . .
Incorrect data display after Graphics history deleted . . . . . . . . . . . . . . . . . . . . . . . . .
Fatal error in routine gr_deleted_regs_cell . . . . . . . . . . . . . . . . . . . . . . . . . . . . . . . . .
Overlap of WAVES and REGS windows . . . . . . . . . . . . . . . . . . . . . . . . . . . . . . . . . .
BARS graphics drawn in WAVES or REGS window . . . . . . . . . . . . . . . . . . . . . . . . . .
Support for Sunview version in OPENLOOK® . . . . . . . . . . . . . . . . . . . . . . . . . . . . . .
Segmentation fault occurs if $ps_waves is issued without a prior $gr_waves . . . . . .
Compilation terminates when <max_height> is 0 . . . . . . . . . . . . . . . . . . . . . . . . . . . .
Fatal error occurs when defining group name . . . . . . . . . . . . . . . . . . . . . . . . . . . . . .
Outstanding Bugs . . . . . . . . . . . . . . . . . . . . . . . . . . . . . . . . . . . . . . . . . . . . . . . . . . . . . .
Monitoring a signal with a zero-delay loop . . . . . . . . . . . . . . . . . . . . . . . . . . . . . . . . .
Clicking in the Graphics window during simulation (Sunview only) . . . . . . . . . . . . . .
Limit on simulation time-range available for window . . . . . . . . . . . . . . . . . . . . . . . . . .
Blank transition fields on bus values . . . . . . . . . . . . . . . . . . . . . . . . . . . . . . . . . . . . .
Thick lines appear in the window . . . . . . . . . . . . . . . . . . . . . . . . . . . . . . . . . . . . . . . .
February 1993
7
65
65
65
66
66
66
66
67
67
67
67
67
67
67
68
68
68
68
68
68
69
69
Product Version 1.2c
Graphical Output for the Verilog Product Family
Key file values are incorrect
. . . . . . . . . . . . . . . . . . . . . . . . . . . . . . . . . . . . . . . . . . . . 69
Index................................................................................................................................ 71
February 1993
8
Product Version 1.2c
Graphical Output for the Verilog Product Family
1
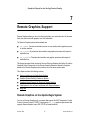
Introduction
This chapter contains the following sections:
■
Who Should Read This Manual?
■
What This Manual Contains
■
New Features and Enhancements
Who Should Read This Manual?
The Graphical Output tool for the Verilog® product family requires that you are an advanced
Verilog user. This manual does not cover any of the Verilog features, nor does it instruct you
in using Verilog. If you are not an advanced and experienced Verilog user, we suggest that
you familiarize yourself with the Verilog products before attempting to use the Graphical
Output tool.
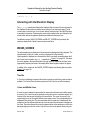
What This Manual Contains
This manual describes the graphical display features of the Verilog product family. These
features are implemented by a set of system tasks which can be called from within a Verilog
description. These system tasks create Graphical Output windows where, as simulation time
progresses, the values of the arguments passed to these tasks are monitored. The three
forms of graphical displays presently available are:
■
Waveform
■
Bar Graph
■
Register (a page-oriented string display)
The waveform output mechanism is implemented by the $gr_waves system task. The
display it produces is useful for viewing data values with respect to time. The formats in which
data is displayed include binary, octal, hexadecimal, decimal, real, and string. Additionally, X
February 1993
9
Product Version 1.2c
Graphical Output for the Verilog Product Family
Introduction
and Z values are represented graphically. The waveform display feature is described in
Chapter 2, “Waveform Output.”
The register output mechanism is implemented by the $gr_regs system task. The display it
produces is useful for viewing the contents of registers in a page-oriented form. String and
data arguments are specified in a manner similar to that used with $display and
$monitor, but the output stays in a stationary position in the Graphical Output window
instead of scrolling. The register display feature is described in Chapter 3, “REGS Window
Output.”
The Bar Graph output mechanism is implemented by the $gr_bars system task. The display
it produces is useful for viewing data when relative magnitude is important. A set of charts is
defined, each consisting of one or more bars. Several charts can be displayed at once. The
bar graph feature is described in Chapter 4, “Bar Graph Output.”
Each of these output mechanisms creates its own Graphical Output window. These windows
can be manipulated (moved, resized, etc.) using the window commands of the host machine.
The idiosyncrasies of each machine are described in Chapter 8, “Limitations.”
All of the product-specific operations performed in the Graphical Output windows are
recorded in the standard Verilog key file, and are performed if the simulation is replayed using
the key file as a command input file. The system window operations (moving, resizing, etc.)
are independent of the application and are not saved in the key file. Thus, they will not be
performed automatically during a replay.
The gr_vlog object module contains the graphical output mechanism that Verilog uses. It is
linked with the Verilog executable file and shipped with platforms that support Verilog graphics
capability.
New Features and Enhancements
This document describes several new features and enhancements to be found in the
Graphical Output for the Verilog product family. Some of these new features are described
below.
Real Numbers and Timescales
Support for real numbers and timescales has been added to this release. This manual has
been updated to reflect these changes.
February 1993
10
Product Version 1.2c
Graphical Output for the Verilog Product Family
Introduction
It is recommended that you become familiar with the real number and timescale features in
Verilog-XL before reading this document—in particular, the $timeformat system task and
the ‘timescale compiler directive.
All three forms of graphical output (WAVES, REGS and BARS) support real numbers.
However, only the Waveform and Reg window displays support timescales. The Bar Graph
output does not support timescales since it is event-driven, not time-driven. Additionally, the
$ps_waves system task supports both real numbers and timescales.
64-bit Times
This release provides graphical support for 64-bit times. Additionally, the waveform graphical
representations of partial unknown and high-impedance buses have been enhanced.
Support for New Windows Behavior
This release provides enhanced support for Graphical Output window resizing and
placement, as well as improved font support, new mouse behavior, and a new system task
for customizing the colors of graphic objects.
X-Windows Performance Enhancements
The X-Windows version of Verilog Graphical Output could use an excessive amount of
network capacity when running on a high performance platform. This has been improved. In
addition, the code no longer issues drawing commands to a window that is an icon or is totally
covered.
Overlap in Multi-Page Plots
Multi-page plots now have a small overlap from one page to the next. Scaling of plots is still
based on the current scale of the display window.
Faster Refresh of the WAVES Window
To increase window refresh speed, Graphical Output now completely draws each wave
before proceeding to the next. Previously, the window was refreshed from right to left.
February 1993
11
Product Version 1.2c
Graphical Output for the Verilog Product Family
Introduction
Change in Definition of $gr_waves_memsize
Previously Graphical Output used the default allocation of 500,000 bytes of memory, or any
amount specified using $gr_waves_memsize, as a maximum amount of memory to be
allocated. Now the default amount or the amount you specify with $gr_waves_memsize is
used as a guideline for Graphical Output memory management.
The Graphical Output memory manager attempts to stay within this guideline by deleting
earlier Graphical Output history up to the last 50 transition times. Occasionally, it will not find
an appropriately sized memory cell in earlier history for new data. When this occurs, the
Graphical Output memory manager allocates memory, in 1 kbyte units, beyond the specified
guideline. Graphical Output issues a message after every 10 allocations (10 kbytes). This
message indicates the current amount of allocated Graphical Output memory. The following
is an example of the allocation message:
> Graphics: No proper size element found at time 100.
> Increasing waves memory allocation to 320480.
If the allocation message appears repeatedly, increase the amount of allocated Graphical
Output memory using $gr_waves_memsize. If, after allocating a large amount of memory,
this message still appears repeatedly, check the circuit activity for oscillating signals.
Change in Initial WAVES Window Scale Factor
When a WAVES window is invoked, Graphical Output sets the initial scale factor at 1000
simulator time units per window. After 50 time units where transitions have occurred on
monitored signals, Graphical Output recalculates the scale factor to fit these 50 transitions on
the window. However, any scale factor you set manually (using ZOOM ) overrides this
recalculation.
Improved Scroll Buttons in WAVES and REGS Windows
A pair of scroll buttons appears at each end of the Time bar on both the WAVES and REGS
displays. You can move the time you want to view forward or backward by clicking on the
appropriate button at either end of the time bar.
A pair of scroll buttons appears at each end of the Group buttons. One pair sits above the
Group buttons, the other below them. You can scroll the WAVES display vertically by clicking
on the appropriate button.
February 1993
12
Product Version 1.2c
Graphical Output for the Verilog Product Family
Introduction
Groups can support more signals
The maximum number of signals that you assign to a group has been increased to 50 (up
from 20). However, the number of useful signals in a group is limited to the size of the Current
List—that is, the number of signals visible in the WAVES window. The size of the Current List
depends on many factors, including the window size and font.
When you define a group using the SELECT window, the number of signals that you assign
to a group is limited to those visible in the Current List—up to 50. When you define a group
using the $define_group_waves system task, the maximum number of signals is limited
to 50.
To view a signal in a selected group that is off the bottom of the WAVES window, resize the
WAVES window so that it is taller. Scrolling the view of the WAVES window down might not
cause the desired signal to move into the window, however.
Default-size WAVES window displays 21 signals
The default-size WAVES window now displays 21 signals (up from 20). The data structure
allows up to 50 signals to display when the window is resized.
Limited support for $save and $restart
On execution of a $save, Graphical Output saves the state of the Graphical Output windows
for restoration on a subsequent $restart. However, the Graphical Output history is not
saved.
For example, any signals being monitored in the WAVES window on execution of a $save is
restored to a WAVES window on execution of a $restart from the saved file. Any modes,
such as $freeze_waves and $gr_waves_memsize, are also restored.
February 1993
13
Product Version 1.2c
Graphical Output for the Verilog Product Family
Introduction
February 1993
14
Product Version 1.2c
Graphical Output for the Verilog Product Family
2
Waveform Output
Verilog provides an interactive graphics interface to display data as waveforms. Using this
interface, you can continuously monitor the waveforms as the simulation progresses. When
in the interactive state of Verilog, you can perform graphics operations using the mouse
device. This chapter decribes the waveform displays and the system tasks that are provided
to create and facilitate those displays. This chapter contains the following sections:
■
Setting Up the Display
■
Learning a New Mouse Behavior
■
Using 64-Bit Times
■
Defining Groups
■
Freezing the Display
■
Setting the Storage Space
■
Improving Simulator and Graphical Output Performance
■
Adding Signals
■
Jumping to a Specified Time
■
Using the $timeformat System Task
■
Interacting with the Waveform Display
■
WAVES_SCREEN
■
SELECT_SCREEN
■
Using Real Numbers
■
WAVES Output Formats
■
WAVES Window Beeps When Using Cursor
■
Graphical Output Windows with Verilog-XL in the Background
February 1993
15
Product Version 1.2c
Graphical Output for the Verilog Product Family
Waveform Output
■
Waveform Output Quick Reference
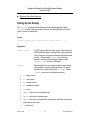
Setting Up the Display
The $gr_waves system task defines the signals to be monitored graphically. When
$gr_waves is called, a graphics window is created in the upper right-hand corner of the
screen, if it does not already exist.
Syntax:
$gr_waves ("<signal_label>", <signal>,"<signal_label>", <signal>, ...);
Arguments:
<signal_label >
An ASCII string, enclosed in double quotes, which consists of a
label followed by an optional format specifier. If a format specifier
is used, there must be a space between the label and the format
specifier. The associated <signal > must be the next
argument. Note that only the first seven characters of the
<signal_label > are used in the display.
<signal >
Specifies the signal to be monitored (usually a scalar variable,
vector variable or a general Verilog expression). The format
specifiers for this signal are of the form %<format >, where
<format > can be one of the following characters:
❑
b — binary numeric
❑
o — octal numeric
❑
d — decimal numeric
❑
h — hexadecimal numeric
❑
s — string
❑
e or E — real numeric in exponential format
❑
f or F — real numeric in decimal format
❑
❑
g or G — real numeric in exponential or decimal format, whichever format results
in the shorter printed output
t — time format
February 1993
16
Product Version 1.2c
Graphical Output for the Verilog Product Family
Waveform Output
These format specifiers follow the same rules for unknowns and high-impedance values as
the specifiers in the $display system task (refer to the Verilog-XL Reference Manual).
To pass format information to $gr_waves, put one specifier after the signal name in each
signal label string argument in the system call. This syntax is described in the example below.
Note that each signal label must be paired with one (and only one) signal. If the signal label
contains no format specifier, the default — %h (hexadecimal) — is assumed.
Example:
If the following signals are declared
reg [15:0] a, b;
wire [31:0] ml_v, dv_v, add_v;
real i, j, ml_r, dv_r, add_r;
reg [23:0] fn_string;
integer loopcnt, func_sel;
time lpstart;
the waveforms of the those signals can be monitored by issuing:
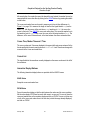
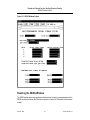
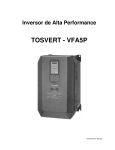
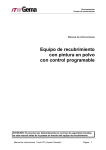
$gr_waves("func %s", fn_string,"areg %h", a, "breg %b", b, "addv %h", add_v, "mulv
%d", ml_v, "divv", dv_v, "i_rl %f", i, "j_rl %e", j, "a_rl %f", add_r, "m_rl %g",
ml_r, "d_rl %g", dv_r, "lpST %t", lpstart, "breg[0]", b[0]);
As simulation continues, these waveforms are updated whenever a signal value changes.
Figure 2-1 on page 18 contains a sample output of this $gr_waves example. Please note that
the figure incorporates subsequent examples from this chapter as well.
Subsequent calls to $gr_waves during a given simulation use the WAVES window currently
in existence. Therefore, the signals listed in the most recent call to $gr_waves replace the
current list of displayed signals.
Resizing the WAVES Window
Horizontal resizing of the WAVES window causes the waves to expand or contract to fill the
width of the window. The width of the Time Bar and the Cursor/Marker and ∆ Time areas
adjust as well.
Vertical resizing of the WAVES window allows either more or fewer waves to fit on the screen.
The number of visible Group buttons increases (to a maximum of 20) or decreases as a result
of resizing. The Scroll Up and Scroll Down buttons remain positioned above and below the
visible Group buttons as the window height changes.
The maximum window dimensions that you can obtain depends on the windowing system
you use. Table 2-1 on page 18 lists these sizes.
February 1993
17
Product Version 1.2c
Graphical Output for the Verilog Product Family
Waveform Output
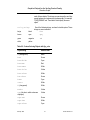
Table 2-1 Maximum Dimensions
Windowing System
Dimensions (in pixels)
X-Windows
2048 x 2048
Sunview
1120 x 900
Apollo GPR
1200 x 800
Figure 2-1 Sample WAVES Output
February 1993
18
Product Version 1.2c
Graphical Output for the Verilog Product Family
Waveform Output
If a window shrinks horizontally past the Cursor Time area, clipping occurs—that is, the
window layout takes its minimum width and the right edge of the window cuts off some of the
display. If the height of the WAVES window is shorter than ten Group buttons, clipping occurs
at the bottom edge.
Interrupting WAVES Window Drawing
You can interrupt a redraw of the WAVES window by typing Control-C in the Verilog-XL
interactive window. Verilog-XL must be in interactive mode to recognize this as a redraw
interrupt.
This feature is not currently supported on Apollo™ platforms under GPR. It is supported on
Apollo platforms under X Windows.
Positioning and Sizing Windows with a System Task
The $gr_position system task gives you the ability to specify placement and size of a
Graphics window.
Syntax:
<gr_position_task> ::=
$gr_position("<window_type>", <x_origin>,<y_origin>,<x_width>?,<y_height>?);
Arguments:
<window_type >
One of the following strings enclosed in double quotes: regs,
waves, bars. These strings are case insensitive.
<x_origin >
The x-dimension origin location, in pixels, of the window
specified by <window_type >. This must be a non-negative
integer.
<y_origin >
The y-dimension origin location, in pixels, of the window
specified by <window_type >. This must be a non-negative
integer.
<x_width >
An optional argument used to define the width, in pixels, of the
window specified by <window_type >. The minimum width is
50. The maximum width depends on your windowing system, as
specified in Table 2-1 on page 18.
February 1993
19
Product Version 1.2c
Graphical Output for the Verilog Product Family
Waveform Output
<y_height >
An optional argument used to define the height, in pixels, of the
window specified by <window_type >. The minimum height is
50. The maximum height depends on your windowing system, as
specified in Table 2-1 on page 18.
Both <x_origin > and <y_origin > are required. The optional arguments <x_width >
and <y_height > must be specified as a pair; a placeholder can not be used. If the
$gr_position parameters do not provide <x_width > and <y_height >,
$gr_position uses the current or default dimensions.
Under X Windows, a Graphics window can be positioned totally on, partially on, or totally off
the screen. However, under Sunview™ and Apollo® GPR, windows must be fully on the
screen. Therefore, under Sunview and GPR, the sum of <x_origin > and <x_width >
cannot be greater than the x dimension specified in Table 2-1 on page 18. Similarly, the sum
of <y_origin > and <y_height > cannot be greater than the y dimension. If either of
these sums exceeds the specified value, $gr_position adjusts the window origin so that
the whole window fits within these dimensions.
Examples:
$gr_position("regs",10,10,500,500);
$gr_position("waves",0,0);
The first example places a 500 x 500 pixel REGS window on the screen with its upper lefthand
corner at pixel location (10,10). The second example places the WAVES window in the upper
lefthand corner of the screen. You can schedule the $gr_position system task to be
executed before or after calling a Graphics window.
Customizing Colors with a System Task
The $gr_color system task assigns new colors to specified graphics objects. The
parameters consist of a list of one or more object/color pairs.
Syntax:
<gr_color_task> ::= $gr_color (<pair> <,<pair>>*);
<pair> ::= "<object_string>","<color_string>"
Arguments:
<object_string >
February 1993
One of the strings listed in Table 2-1 on page 21, enclosed in
double quotes. This table also lists the default colors supplied for
20
Product Version 1.2c
Graphical Output for the Verilog Product Family
Waveform Output
each of these objects. The strings are case-insensitive, and they
accept hyphens and underscores interchangeably. For example,
“TIME_BUBBLE” and “Time-bubble” both specify the same
object.
<color_string >
One of the following strings, enclosed in double quotes. These
strings are case insensitive.
blue
beige
black
brown
cyan
gray
green
magenta
red
white
yellow
Table 2-2 Custom-Coloring Objects with $gr_color
Object String
Default Color
BG (background)
Black
bars
Green
bars-divide
Cyan
bars-max+
Red
bars-names
White
bars-titles
Yellow
bars-values
White
bus-values
Green
buses
Cyan
cursor
White
FG (foreground)
White
marker
Yellow
regs (the box in which values are
displayed)
Yellow
regs-text
Green
regs-time
White
regs-values
Cyan
February 1993
21
Product Version 1.2c
Graphical Output for the Verilog Product Family
Waveform Output
Table 2-2 Custom-Coloring Objects with $gr_color, continued
Object String
Default Color
time-bubble
Yellow
time-labels
Green
time-scale
Gray
time-values
Cyan
wires
Green
Xs (unknown values)
Red
Zs (high-impedance)
Brown
Example:
$gr_color ("BG", "gray",
// gray background
"time-scale", "blue", // blue timescale
"Buses", "yellow");
// yellow buses
Understanding the Default Colors
In this release, some of the brighter colors have been toned down, as follows:
■
The Time scrollbar is gray, with the currently-visible time in yellow.
■
Menu buttons are gray.
■
Highlighted menu items, such as defined groups, are white.
■
The current group is yellow.
■
Fixed signals (on the SELECT window) are gray.
■
Selected signals (on the SELECT window) are blue.
These colors were selected to improve readability, as well as color consistency, across all
supported platforms.
X-Window Colormap Allocation Problems
The Graphical Output software currently tries to allocate 16 colormap entries. If these can not
be uniquely allocated under X11, the X server returns a pointer to the closest available color.
A replacement color that is not very close in value to the original color can cause display
February 1993
22
Product Version 1.2c
Graphical Output for the Verilog Product Family
Waveform Output
anomalies. This colormap allocation problem can occur if other applications are running that
require too many colormap entries, or if the hardware supports less than 16 colors.
Selecting Fonts
You can specify the font that the graphics display uses by setting the environment variable
VGR_FONT to the desired font. Suggested fonts to use are as follows:
■
screen.r.14 (default)
■
screen.b.12
■
cour.b.12
■
serif.r.11
If the VGR_FONT environment variable is not set, the default font, screen.r.14, is used.
For example, in a UNIX C shell, to set the graphics font to cour.b.12, the following should
be entered in the login script or at the prompt:
setenv VGR_FONT cour.b.12
Other fonts listed in the directory /usr/lib/fonts/fixedwidthfonts can be used;
however, larger fonts than those suggested above are not recommended, since distortions
can occur.
The environment variable VGR_FONT is recognized under both
X Windows and Apollo GPR. Since the size of a displayed wave is proportional to the size of
the font, you can fit more signals on the screen by selecting a smaller font. This is true for all
systems.
Under X Windows, if this environment variable is not set, Graphical Output first searches for
the font 8x13; if this is not found, it uses the font named fixed, usually a 6x10 font. Fonts
larger than 8x13 can cause distortions. The fonts available under X-Windows can be found in
/usr/lib/X11/fonts.
Under Apollo GPR, if this environment variable is not set, Graphics searches for the font
f5x9. The fonts available under GPR can be found in /sys/dm/fonts.
Scaling Due to Fonts
Changing the selected font can alter scaling within the Graphical Output windows. For
example, if the font is made smaller, more waves fit in the WAVES window.
February 1993
23
Product Version 1.2c
Graphical Output for the Verilog Product Family
Waveform Output
All the buttons in the windows rescale when fonts change. To accommodate this feature, the
Group buttons have been modified. The default Group button labels now appear on one line
as GP <number> (for example, GP 5). When a group_name is assigned to the button using
$define_group_waves, the Graphical Output software replaces the entire Group button
label. See “Defining Groups” on page 24 for more information on groups.
Learning a New Mouse Behavior
The right mouse button now has new behavior for the WAVES window. If you move the mouse
pointer to any position in the window or on the Time bar and then click with the right mouse
button, the cursor moves to that position in the WAVES display, and then the window repaints
with the cursor centered in the window. This is the functional equivalent of clicking in the
window or Time bar with the left mouse button and then clicking the center button (CNTR ).
Using 64-Bit Times
In this release, the WAVES display provides graphical support for 64-bit simulation time
values. In prior releases of Graphical Output, simulation time values could not exceed 32-bits
in length even though Verilog-XL versions 1.3 and beyond support values to 64-bits. The BAR
graph output does not need to support 64-bit times since it is event-driven, not time-driven.
NOTE: To use the $gr_jumptotime system task to jump to a time greater than 32 bits, the
<time > argument must be expressed in the following number format (refer to the Lexical
Conventions chapter of the Verilog-XL Reference Manual for an explanation of this format):
ss..s ’f nn..n
For example, to jump to time 34,000,000,000, type:
$gr_jumptotime(64’d34000000000);
Defining Groups
The $define_group_waves task provides the ability to group a set of signals together that
have already been defined in the $gr_waves task and associate a group name to them.
During a graphics interaction, you can select any group for display by clicking the mouse
button on the menu item associated with the group.
Syntax:
$define_group_waves(<group_no>, "<group_name>", "<signal_label>",
"<signal_label>", ...);
February 1993
24
Product Version 1.2c
Graphical Output for the Verilog Product Family
Waveform Output
Arguments:
<group_no >
An integer value between 1 and 20.
<group_name >
A string, surrounded by double quotes, with a maximum of 5
characters.
< signal_label >
A signal label string, including the format specifier, surrounded
by double quotes. This string has already been defined under the
$gr_waves task. If a signal label does not match any of the
labels defined in $gr_waves, then a blank space is inserted in
place of that undefined signal.
Note: A maximum of 30 signals can be included in a group.
Example:
The following string groups the signals defined in the $gr_waves example.
$define_group_waves(1, "adds", "areg %h", "breg %b", "addv %h","i_rl %f", "j_rl
%e", "a_rl %f");
Here, group 1 consists of the signals a, b, add_v, i, j, and add_r, and the label adds
appears on the menu button associated with group 1. (See Figure 2-1 on page 18.)
Freezing the Display
The $freeze_waves system task disables continuous update of the Graphical Output
window. You can use this task to speed up simulation by avoiding graphics operations
associated with every update of the signal values. Interrupting Verilog refreshes the window
to the current status of the monitored signals and you can analyze previous simulation history
using the interactive operations.
The $unfreeze_waves task reenables the continuous update of the Graphical Output
window.
Syntax:
$freeze_waves;
$unfreeze_waves;
There are also system-dependent methods for improving simulation speed that can be used
in place of the $freeze_waves task. On Sun workstations, closing the Graphical Output
February 1993
25
Product Version 1.2c
Graphical Output for the Verilog Product Family
Waveform Output
windows inhibits drawing for improved performance. On Apollo workstations, the same effect
can be achieved by overlapping other windows on top of the Graphical Output windows.
Setting the Storage Space
The $gr_waves_memsize system task informs Verilog of the maximum amount of memory
space to be allocated for the waveform display.
Syntax:
$gr_waves_memsize(<size>);
The size argument is in bytes. Memory is requested by the waveform display as simulation
progresses and value changes occur on the signals being displayed. When the maximum
specified memory space has been allocated and used, the oldest data is discarded and its
space is reused.
The minimum amount of space that can be allocated is 300,000 bytes. The maximum amount
is limited only by the amount of virtual memory space available on the host machine. The
default amount of space allocated in the absence of a call to $gr_waves_memsize is
500,000 bytes. This limit is set when $gr_waves is called. A call to $gr_waves_memsize
after a call to $gr_waves can increase the amount of memory available for the waveform
display, but it cannot reduce it.
Improving Simulator and Graphical Output Performance
You can reduce network traffic by up to a factor of 8 by observing the following rules:
■
Use $freeze_waves.
■
Reduce the amount of drawing by taking one of the following steps:
❑
Totally obscure a REGS or BARS window by placing it under another window
❑
Iconize a REGS or BARS window
Adding Signals
The $gr_addwaves task adds signals to the waves display.
February 1993
26
Product Version 1.2c
Graphical Output for the Verilog Product Family
Waveform Output
Syntax:
$gr_addwaves("<signal_label>",<signal>,...);
This task accepts a list of signals in the same format as $gr_waves. The task $gr_waves
must be executed before $gr_addwaves.
Example:
$gr_addwaves("lpct %o", loopcnt,"fnsl %d", func_sel);
As a result of the above $gr_addwaves task, the signals loopcnt and func_sel have
been added to the bottom of the list of signals displayed in the waves window (see Figure 2-1
on page 18). The values of the signals added are not available in the WAVES display prior to
the time they were added. If the display is scrolled, zoomed or jumped back to a time prior to
the addition of these signals, they are displayed as several horizontal lines, one above the
other.
Jumping to a Specified Time
The $gr_jumptotime task allows you to jump to a particular time in both the WAVES and
REGS displays.The cursor is centered in the WAVES window at the specified time. The
REGS window also jumps to the specified time and displays the appropriate values.
Syntax:
$gr_jumptotime(<time>);
Argument:
<time >
An integer or real expression assumed to be in the units of the
currently active timescale, as defined by the most recently
executed $timeformat system task.
Note: To use the $gr_jumptotime system task to jump to a time greater than 32 bits, the
<time > argument must be expressed in the following number format (refer to the Lexical
Conventions chapter of the Verilog-XL Reference Manual for an explanation of this format):
ss..s ’f nn..n
For example, to jump to time 34,000,000,000, type:
$gr_jumptotime(64’d34000000000);
February 1993
27
Product Version 1.2c
Graphical Output for the Verilog Product Family
Waveform Output
Using the $timeformat System Task
The $timeformat system task is a Verilog system task which establishes the time unit for
delays entered interactively, as well as the time unit, precision, suffix string, and minimum field
width for time information displayed using the %t format specifier. The time unit, precision,
suffix string, and minimum field width for the cursor, marker, and ∆ times—which appear in
the upper right-hand corner of the WAVES window—are also derived from the $timeformat
system task. The same is true for the time in the upper right-hand corner of the REGS
window. (Please refer to the Verilog-XL Reference Manual for the exact syntax and definition
for the $timeformat system task.)
The $timeformat system task can appear in the Verilog code or it can be entered
interactively. The most recently executed $timeformat system task formats the times
displayed in the upper right-hand corner of the WAVES and REGS windows. If no
$timeformat system task has been executed, the default time unit is set to the smallest
precision argument of the ‘timescale compiler directives in the source description. When
the default time unit is used, no suffix string appears with the cursor, marker, and ∆ times or
with any variables using the%t format specfier. (Please refer to the Verilog-XL Reference
Manual for more information.)
When a $timeformat system task is entered interactively, the times in the Graphical Output
windows do not automatically reflect the change. To cause an update to occur, the RDRW
button must be selected or a command must be executed which causes a redraw of the
screen to occur.
The Graphical Output windows have limited space available for the display of times. If a time
exceeds the available space, it is truncated on the left and preceded by a "~" to indicate that
an overflow has occurred. Simulation can continue with the overflow, or a $timeformat
system task can be executed interactively to adjust the time unit to a format which requires a
smaller field width.
Example:
$timeformat(-8, 4, " x10 ns", 20);
In the example shown in Figure 2-1 on page 18, this $timeformat system task was
executed at 60 nanoseconds. Therefore, both the times in the upper right-hand corner and
the final value of the signal lpstart (which is formatted by %t) have been formatted by this
$timeformat example.
However, prior to the time 60 nanoseconds, no $timeformat system task was executed.
Therefore, the first two values of lpstart (shown in Figure 2-1 on page 18) are displayed in
the time of the simulator. In this particular case, the time unit is picoseconds, since the time
of the simulator was determined by the compiler directive:
February 1993
28
Product Version 1.2c
Graphical Output for the Verilog Product Family
Waveform Output
‘timescale 1 ns / 1 ps
Interacting with the Waveform Display
The $gr_waves system task initializes the Graphical Output window. Mouse interaction for
the Graphical Output window is enabled when Verilog is in the interactive mode. The left
mouse button is used for input. A set of menu buttons, along the top of the WAVES window,
is provided for interaction. Positioning the pointer inside a menu button and clicking the left
mouse button selects the graphics operation associated with that menu item.
Two different screens, WAVES_SCREEN and SELECT_SCREEN are provided by the
waveform display. Both of these screens accept mouse input.
WAVES_SCREEN
The signal waveforms are displayed on this screen and are displayed as timing diagrams. The
unknown state (X-state) of a scalar or vector is displayed as a filled solid box.
High-impedance is displayed as a horizontal line which is vertically centered between the 0
and 1 levels (refer to signals b and add_v, respectively, in Figure 2-1 on page 18). The values
for vectors appear in their specified format if enough space is available at the given scale.
Appropriately adjusting the scale of the display allows these lengthier numbers to appear.
In addition to the waveforms, the WAVES_SCREEN displays the following features (refer to
Figure 2-1 on page 18).
Time Bar
A Time bar is displayed to represent the total time period over which the preserved data is
available. The Current Time window is projected onto this Time bar as a filled rectangle.
Cursor and Marker Lines
A cursor line and a marker line are provided to measure time intervals and to define regions
for zooming. The cursor line can be placed by moving the mouse to a waveform edge or to a
location on the time bar and clicking the left mouse button. The cursor line moves to the
nearest edge for any of the signals defined on the waves screen. The corresponding time is
displayed as the cursor time. The time associated with the marker line is displayed as the
marker time, and the difference between the cursor time and the marker time is displayed as
the ∆ time. The marker line and the cursor line appears either on the waveforms or on the time
bar depending upon their time values. Only the cursor line can be placed directly using the
February 1993
29
Product Version 1.2c
Graphical Output for the Verilog Product Family
Waveform Output
left mouse button; the marker line cannot be placed this way. Instead, the marker line can be
swapped with the cursor line either by clicking on the SWAP button or by pressing the middle
mouse button.
The cursor and marker lines can be used to measure point-to-point time differences. In
Figure 2-1 on page 18, to measure the length of time that the signal labeled areg has the
value 05d3, click the mouse at the point where areg transitions to 05d3; the cursor line
moves to that point. Then SWAP the cursor and marker lines. This moves the marker line to
the transition point of areg. Finally, move the cursor to the following transition of areg. The
difference, in this case 20 nanoseconds, is the time between the cursor and marker lines.
Cursor Time, Marker Time and ∆ Time
The cursor, marker and ∆ times are displayed in the upper right-hand corner and are all in the
format specified by the most recently executed $timeformat task. These times change with
movement of the cursor and marker lines.
Current List
The signal labels for the waveforms currently displayed on the screen are shown to the left of
the waveforms.
Interactive Display Buttons
The following interactive display buttons are provided with the WAVES screen:
SWAP Button
Swaps the cursor and marker lines.
ZOOM Button
Zooms the waveform display so that the data between the marker and the cursor positions
fills the entire display. ZOOM can be used to both zoom in or zoom out. To zoom in, place the
cursor and marker lines on the waveform display and click on ZOOM . To zoom out, place one
or both of the cursor and marker lines in the time bar (outside the range already displayed)
and click on ZOOM .
February 1993
30
Product Version 1.2c
Graphical Output for the Verilog Product Family
Waveform Output
LEFT/CNTR/RGHT Buttons
These buttons are used for traversing along the time bar and for pivoting the display around
the cursor position. Each time you click a button, the display moves so that the cursor position
is at the left/center/right of the display.
RDRW Button
Redraws the current screen. If a $timeformat system task is entered interactively, RDRW
can be selected to cause the cursor, marker and ∆ time formats to update.
Scrolling Buttons
Clicking on the appropriate arrow at the ends of the Time bar causes the waves screen to
move forward (">") or backward ("<") in time to the next value change. Clicking on the
appropriate arrow above and below the Group buttons moves your view of the display by one
signal position. The following table illustrates the use of these buttons:
>>
move forward in time to the next value change.
<<
move backward in time to the next value change.
↑↑↑↑
move your view of the display up by one signal position (signals move down).
↓↓↓↓
move your view of the display down by one signal position (signals move up).
SELECT Button
Changes the display to the SELECT_SCREEN, where you are allowed to revise the current
list of signals on the WAVES screen, as well as define or redefine signal groups. The
SELECT_SCREEN is described in more detail below.
Group Buttons
If a group is defined, it can be exposed by moving the pointer onto the appropriate Group
button and clicking the left mouse button.
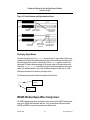
SELECT_SCREEN
The SELECT_SCREEN displays the list of signals defined in the $gr_waves task along with
the current list of signals in the WAVES_SCREEN. You can redefine the existing groups,
February 1993
31
Product Version 1.2c
Graphical Output for the Verilog Product Family
Waveform Output
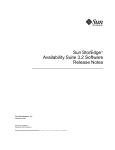
define new groups, or just change the current mix of signals on the WAVES_SCREEN. A
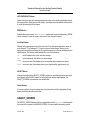
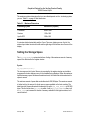
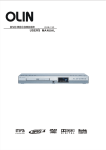
portion of the SELECT_SCREEN is shown in Figure 2-2 on page 32.
Figure 2-2 Portion of SELECT_SCREEN
fixed
signal
(highlighted)
blank
unfixed
signal
(any one
NOT
highlighted)
Group
buttons
selectable
signals
Current
List
The operations available from the SELECT_SCREEN are as follows:
Fix/Unfix Signal
Signals on the Current List can be fixed/unfixed by clicking the left mouse button while the
pointer is on one of them. A fixed signal is not overwritten by a selected signal; an unfixed
February 1993
32
Product Version 1.2c
Graphical Output for the Verilog Product Family
Waveform Output
signal is overwritten. The fixed signals are highlighted. The default state of the signals in the
Current List is unfixed.
Select Signal
Signals in the list of all signals can be selected by moving the mouse so that the pointer is on
the signal name and clicking the left mouse button. The selected signal replaces the first
unfixed signal in the Current List. A particular signal can be selected many times, resulting in
multiple copies of its waveform on the WAVES_SCREEN.
Select Blank
Selecting the blank box in the list of all signals replaces the first unfixed signal in the Current
List with a blank space, resulting in a blank line on the WAVES_SCREEN. This can be used
to separate groups or to separate signals within groups.
Interactive Display Buttons
The following interactive display features are provided with the WAVES screen:
CLEAR Button
Clears the current list of selected signals.
Scroll Buttons
↑↑↑↑
move your view of the unfixed signals up by one position (names move down).
↓↓↓↓
move your view of the unfixed signals down by one position (names move up).
PREV Button
Brings in the previous page of signals in the Signals List. This is useful if all the signals in the
Signals List cannot be displayed on the screen at one time.
NEXT Button
Brings in the next page of signals in the Signals List. This is useful if all the signals in the
Signals List cannot be displayed on the screen at one time.
February 1993
33
Product Version 1.2c
Graphical Output for the Verilog Product Family
Waveform Output
REDRAW Button
Redraws the current screen.
Group Buttons
The items in the Current List can be grouped together by clicking the left mouse button on
one of the Group buttons and then clicking on CLEAR or DONE . The defined group
associates the signals in the Current List; the group can then be exposed in the WAVES
window as explained earlier in “Group Buttons” on page 31 in the WAVES_SCREEN section.
At the same time, in the SELECT_SCREEN, clicking on a button associated with a group
defined by $define_group_waves redefines that group to the Current List.
DONE Button
Exits from the SELECT_SCREEN and returns back to the WAVES_SCREEN.
Using Real Numbers
In addition to the data types previously accepted, many of the Graphical Output tasks now
accept real number expressions. In the WAVES screens, to display a signal value as a real
number, a format specifier should be included in the <signal_label > argument to the
$gr_waves system task. Additionally, expressions can be displayed in a time format defined
by the $timeformat Verilog system task. The format specifiers are of the form %<format >,
where <format > can be one of the following characters:
■
e or E — real numeric in exponential format
■
f or F —real numeric in decimal format
■
g or G —real numeric in exponential or decimal format, whichever format
in the shorter printed output
■
t —time format
results
WAVES Output Formats
The following system tasks, provided to facilitate the waveform display, now support the real
number format specifiers:
■
$gr_waves
February 1993
34
Product Version 1.2c
Graphical Output for the Verilog Product Family
Waveform Output
■
$define_group_waves
■
$gr_addwaves
Additionally, the <time > argument to the $gr_jumptotime system task can now be a real
number. The <time > value is assumed to be in the unit of the most recently executed
$timeformat system task.
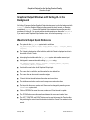
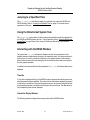
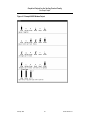
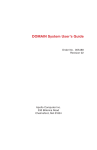
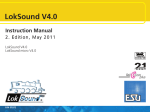
Displaying Partial Unknown and High-impedance Vectors
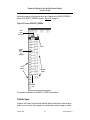
The WAVES output displays partial unknown and partial high-impedance vectors (see
Figure 2-3 on page 36). In previous versions of WAVES, any vector that contained at least
one bit that evaluated to unknown (X-state), would appear as a filled solid box; any vector that
contained at least one bit that evaluated to high-impedance (Z-state), would be displayed as
a line in the middle of the 0 and 1 levels. These displays made it difficult to determine whether
a vector was partially or fully at one of these states.
In version 2.0, a filled solid box represents a vector where all specified bits are in the X-state;
a vector where all specified bits are in the Z-state appears as a line in the middle of the 0 and
1 levels. However, vectors that are partially in the unknown or high-impedance state appear
in their specified formats using the following rules:
■
x — All bits of the digit are unknown.
■
X — At least one, but not all, of the bits are unknown.
■
z — All bits of the digit are at high-impedance.
■
Z — At least one, but not all, of the bits are at high-impedance.
Vectors in decimal format (%d) that are partially in the unknown or high-impedance state
display a single X or Z, respectively. Vectors in the binary format (%b) display each bit
separately using the characters 0, 1, x and z.
February 1993
35
Product Version 1.2c
Graphical Output for the Verilog Product Family
Waveform Output
Figure 2-3 Partial Unknown and High-impedance Values
All bits are
unknown
At least one, but
not all, of the bits
are unknown
All bits of this
digit are unknown
All bits at highimpedance
All bits of this
digit are at highimpedance
At least one, but not
all, of the bits are
at high-impedance
Displaying Signal Names
The name of a signal used in a $gr_waves command must be unique within the first seven
characters. If the format string following the signal name starts within seven characters of the
start of the signal name, a portion of that string, such as %b or %h, appears as part of the
signal name. The extra characters display on the screen as part of the name and are also
required by $define_groups to identify that signal. To avoid this problem for short signal
names, use additional spaces in front of the formatting characters so that they do not fall
within seven characters from the start of the signal name.
The following two examples illustrate the problem and the solution:
"CLK %b"
"CLK
The signal name is
"CLK %b"
%b"
The signal name
is "CLK"
WAVES Window Beeps When Using Cursor
The WAVES window beeps when you place the cursor at a time in the WAVES window where
there are no REGS value changes at that time. This is an intentional notification that the
WAVES and REGS cursors are now positioned at different times.
February 1993
36
Product Version 1.2c
Graphical Output for the Verilog Product Family
Waveform Output
Graphical Output Windows with Verilog-XL in the
Background
If a Verilog-XL process that has Graphical Output windows open is put in the background with
Control-z, then the Graphical Output windows cannot be closed, moved, or otherwise
manipulated. Control-z freezes the Graphical Output windows because they are child
processes of Verilog-XL. You cannot perform window operations on them after Control-z.
If you want to make Graphical Output window icons, do so before pressing Control-z.
Waveform Output Quick Reference
■
The syntax for the $gr_waves system task is as follows:
$gr_waves("<sig1_label>", <sig1>, "<sig2_label>", <sig2>, ..."<sig<n>_label>",
<sig<n>>);
■
The X-state is displayed as a filled solid box, while the Z-state is displayed as a line in
the middle of 0 and 1 levels.
■
Interrupting the simulation after the $gr_waves system task enables mouse input.
■
Add signals to waves window after calling $gr_waves using:
$gr_addwaves("<signal1_label>", <signal1>, "<signal2_label>", <signal2>,
..."<signal<n>_label>", <signal<n>>)
■
Use the left mouse button for all Graphical Output input.
■
The cursor line is a solid line, and the marker line is a dashed line.
■
The cursor line can be moved to waveform edges.
■
∆ time is the time interval between the marker and cursor lines.
■
The middle mouse button can be used to swap cursor and marker lines.
■
The format for the cursor, marker, and ∆ times can be changed by executing a new
$timeformat system task.
■
Click on REDRAW to cause the cursor, marker and ∆ time formats to update.
■
The ZOOM button zooms the waveforms between the cursor and marker lines.
■
The LEFT, CENTER , and RIGHT buttons can be used to traverse the Time bar after
first positioning the cursor line at the location to which the Current Time window is to be
moved.
February 1993
37
Product Version 1.2c
Graphical Output for the Verilog Product Family
Waveform Output
■
The SELECT button can be used to invoke the SELECT_SCREEN to select signals
and/or to define groups.
■
Scrolling backward/forward is in terms of the next value change.
■
Scrolling up/down is with respect to your view of the data— think of a window on the data,
similar to a text editor.
■
Issue keyboard commands to Verilog-XL in the window in which Verilog-XL is running.
February 1993
38
Product Version 1.2c
Graphical Output for the Verilog Product Family
3
REGS Window Output
Verilog provides an interactive graphics interface to display data as a window of text along
with formatted values of nets and registers. These values are continuously updated as the
simulation progresses. When in the interactive state of Verilog, you can perform graphics
operations using the mouse device. This chapter describes the REGS window display and
the system tasks that are provided to create and facilitate thatdisplay. This chapter contains
the following sections:
■
Setting Up the REGS Window
■
Resizing the REGS Window
■
Setting the Storage Space
■
Jumping to a Specified Time
■
Using the $timeformat System Task
■
Interacting with the REGS Window
■
Using 64-Bit Time Values
■
Accepting Real Numbers
■
REG Window Output Quick Reference
Setting Up the REGS Window
The $gr_regs task defines the layout of the window and specifies the variables to be
displayed with their formats. If it does not already exist, a special graphics window is created
in the upper left-hand corner of the window. After the $gr_regs task is called, the mouse
becomes active whenever Verilog is waiting for an interactive command.
Syntax:
$gr_regs("<string1>", <optional list of expressions>, "<string2>",
<optional list of expressions>, ..."<string<n>>", <optional...>);
February 1993
39
Product Version 1.2c
Graphical Output for the Verilog Product Family
REGS Window Output
Arguments:
An ASCII string enclosed in double quotes that contains one
format specifier for each <expression > that follows it.
<string >
<optional list of expressions >
A list of general Verilog expressions.
Example:
$gr_regs(
"
"
"
"
"
"
"
"
"
"
"
"
"
"
"
"
"
"
"
"
"
"
"
"
MULTIPROGRAMMING VIRTUAL STORAGE SYSTEM
disks %d
terminal %d
cpu use %f
job count %d
disk
1
2
3
4
track seek times
%d
%d
%d
%d
record search time
%d
%d
%d
%d
terminal mean user delay
terminal mean cpu job time
%d
%d
maximum wait times in queues
Schq=%d
Dpchq=%d
Dkq1=%d
Dkq3=%d
Dkq2=%d
Dkq4=%d
",
",
",
",
",
",
",
",
",
",
",
",
",
",
",
",
",
",
",
",
",
",
",
",
s1.numdisks, num_terms,
(s1.c1.totalbusy*100.0)/$time, jobcount,
s1.d1.maxseek, s1.d1.maxsearch,
s1.d2.maxseek, s1.d2.maxsearch,
s1.d3.maxseek, s1.d3.maxsearch,
s1.d4.maxseek, s1.d4.maxsearch,
t1.mean_cpu_time, t1.user_delay,
sched_q_maxlwt, dispatch_q_maxlwt,
disk_q_maxlwt[1], disk_q_maxlwt[2],
disk_q_maxlwt[3], disk_q_maxlwt[4]);
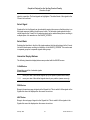
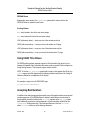
The previous example shows how to specify formats to $gr_regs. The resulting output can
be found in Figure 3-1 on page 42. Note that zero, one, or more expressions can follow a
string, as long as the number of expressions equals the number of format specifiers in that
string. In other words, a string should not contain format specifiers if no expressions come
after it in the argument list. Conversely, every string must contain one format specifier for each
February 1993
40
Product Version 1.2c
Graphical Output for the Verilog Product Family
REGS Window Output
expression that does follow it. The format specifiers are of the form %<format >, where
<format > can be one of the following characters:
■
b — binary numeric
■
o — octal numeric
■
d — decimal numeric
■
h — hexadecimal numeric
■
s — string
■
e or E — real numeric in exponential format
■
f or F — real numeric in decimal format
■
g or G — real numeric in exponential or decimal format, whichever format results in the
shorter printed output
■
t — time format
The format specifiers follow the same rules for unknowns and high impedance values as the
specifiers in the $display system task.
Specifiers match expressions in left-to-right order. Each specifier should be placed at the
location in the string where you want the expression it formats to be displayed.
Enough space must be left between format specifiers to allow display of the full width of the
registers. Note that the width of real numbers is automatically 25 spaces. If not enough space
is provided, the values of the arguments overlap on the window. A warning is issued during
compilation if this situation is detected.
The graphics window is updated whenever a value changes for any of the variables defined
in $gr_regs during simulation.
A new call to $gr_regs clears the current window and sets up the new window as specified
by the new parameter list.
February 1993
41
Product Version 1.2c
Graphical Output for the Verilog Product Family
REGS Window Output
Figure 3-1 REGS Window Output
Resizing the REGS Window
The REGS window previously supported vertical resizing. However, horizontal resizing of the
REGS window now causes the Time bar to expand or contract to fill the width of the window
as well.
February 1993
42
Product Version 1.2c
Graphical Output for the Verilog Product Family
REGS Window Output
The maximum window dimensions that you can obtain depends on the windowing system
you use. Table 3-1 on page 43 lists these sizes.
Table 3-1 : Maximum Dimensions
Windowing System
Dimensions (in pixels)
X-Windows
2048 x 2048
Sunview
1120 x 900
Apollo GPR
1200 x 800
If a window shrinks horizontally past the Cursor Time area, clipping occurs—that is, the
window layout takes its minimum width and the right edge of the window cuts off some of the
display.
Setting the Storage Space
The $gr_regs_memsize system task informs Verilog of the maximum amount of memory
space to be allocated for the register window.
Syntax:
$gr_regs_memsize(<size>);
The size argument is in bytes. Memory is requested by the register window as simulation
progresses and value changes occur on the variables being displayed. When the maximum
specified memory space has been allocated and used, the oldest data is discarded and its
space is reused.
The minimum amount of space that can be allocated is 300,000 bytes. The maximum amount
is limited only by the amount of virtual memory space available on the host machine. The
default amount of space allocated in the absence of a call to $gr_regs_memsize is 500,000
bytes. This limit is set when $gr_regs is called. A call to $gr_regs_memsize after a call
to $gr_regs can increase the amount of memory available for the register window, but it
cannot reduce it.
February 1993
43
Product Version 1.2c
Graphical Output for the Verilog Product Family
REGS Window Output
Jumping to a Specified Time
The $gr_jumptotime task allows jumping to a particular time in both the WAVES and
REGS windows. Refer to “Jumping to a Specified Time” on page 27 for syntax and an
explanation of this task.
Using the $timeformat System Task
The $timeformat system task is a Verilog system task which formats the time displayed in
the WAVES and REGS windows, and the %t format specifier. Refer to “Using the $timeformat
System Task” on page 28 and to the Verilog-XL Reference Manual for a more detailed
explanation.
Interacting with the REGS Window
The system task $gr_regs initializes the Graphics window. Mouse interaction for the
graphics window is enabled when Verilog is in the interactive mode. The Left mouse button is
used for input. A menu is provided for interaction in the graphics window. Positioning the
pointer inside the menu item and clicking the left mouse button selects that menu option for
the next graphics operation.
In addition to the data as defined by the parameters of $gr_regs, the following features are
displayed.
Time Bar
A Time bar is displayed at the top of the REGS window to represent the total time period over
which the preserved data is available. The current time for which data is displayed is projected
on this bar by a vertical line. During the interactive mode one can traverse along the time bar
by positioning the pointer at a location and clicking the left mouse button. The data values for
the corresponding time are then displayed.
Interactive Display Buttons
The following interactive display features are provided with the REGS window:
February 1993
44
Product Version 1.2c
Graphical Output for the Verilog Product Family
REGS Window Output
REDRAW Button
Redraws the current window. If a $timeformat system task is entered, click on the
REDRAW button to update the time format.
Scrolling Buttons
>> — move forward in time to the next value change
<< — move backward in time to the next value change
LINE (with arrows above) — move your view of the window up one line
PAGE (with arrows above) — move your view of the window up 1/2 page
LINE (with arrows below) — move your view of the window down one line
PAGE (with arrows below) — move your view of the window down 1/2 page
Using 64-Bit Time Values
The REGS window provides graphical support for 64-bit simulation time values. In prior
releases of Graphical Output, simulation time values could not exceed 32-bits in length even
though Verilog versions 1.3 and beyond support values to 64-bits.
NOTE: To use the $gr_jumptotime system task to jump to a time greater than 32 bits, the
<time > argument must be expressed in the following number format (refer to the Verilog-XL
Reference Manual for an explanation of this format):
ss..s ’f nn..n
For example, to jump to time 34,000,000,000, type:
$gr_jumptotime(64’d34000000000);
Accepting Real Numbers
In addition to the data types previously accepted, many of the graphics tasks now accept real
number expressions. In the REGS window, to display a signal value as a real number, a
format specifier should be included in the <string > argument to the $gr_regs system
task. Additionally, expressions can be displayed in a time format which is defined by the
$timeformat Verilog system task. The format specifiers are of the form %<format >,
where < format > can be one of the following characters:
February 1993
45
Product Version 1.2c
Graphical Output for the Verilog Product Family
REGS Window Output
■
e or E — real numeric in exponential format
■
f or F— real numeric in decimal format
■
g or G— real numeric in exponential or decimal format, whichever format results in the
shorter printed output
■
t—time format
REGS Output Format
The $gr_regs system task supports the real number format specifiers. The width of real
numbers in the REGS window is automatically 25 spaces.
As in the WAVES window, the $gr_jumptotime system task now accept a real number for
the <time > argument.
REG Window Output Quick Reference
■
Interrupting the simulation after the $gr_regs system task enables mouse input.
■
Use the left mouse button for all graphics input.
■
Scrolling backward/forward is in terms of next value change.
■
Scrolling up/down is with respect to your view of the data — think of a window on the
data, similar to a text editor.
■
The keyboard commands to Verilog-XL are to be given in the window in which Verilog-XL
is running
■
The REGS window is slaved to the time operations performed in the WAVES window, but
the reverse is not true.
■
The time format can be changed by executing a new $timeformat system task.
■
Click on REDRAW to cause the time format to update.
February 1993
46
Product Version 1.2c
Graphical Output for the Verilog Product Family
4
Bar Graph Output
Verilog provides the capability to view data as dynamically changing bar graphs. This chapter
describes BARS windows and the system task that allows you to set up charts with multiple
bars and to update those bars as simulation progresses. This chapter contains the following
sections:
■
Setting up a BARS Window
■
Plotting
■
Understanding Bar Values
■
BARS Output Formats
■
Example Calls to $gr_bars
Setting up a BARS Window
The system task $gr_bars creates a window and legends for the bar graphs to be displayed
and then asynchronously updates the windows whenever one of the data arguments changes
value.
Syntax:
$gr_bars("<chart_name>",<max_height>,"<bar_label>",
<expr>,"<bar_label>",<expr>, ...);
Arguments:
<chart_name >
February 1993
A string that identifies a group of bars which is displayed side by
side. The <chart_name > string is displayed beneath the set of
bars. The maximum length of the <chart_name > string can be
45 characters.
47
Product Version 1.2c
Graphical Output for the Verilog Product Family
Bar Graph Output
<max_height >
An integer or real expression which determines the scale of all
the bars of a particular chart. This argument can be real whether
or not any real expressions are monitored.
<bar_label >
An ASCII string enclosed in double quotes (maximum six
characters) which appear beneath the bar in the windows. The
associated expression, <expr >, must by the next argument.
<expr >
Any valid integer or real expression that returns a value. The
most common case is a variable name.
When $gr_bars is called, it opens a graphics window in the upper right-hand corner of the
screen.
This system task should be called once for each group of bars you want to display. Multiple
groups can be displayed by calling $gr_bars with different chart names. These groups are
displayed one above the other in the same window.
Currently, the maximum number of charts that can be displayed is 5. The maximum number
of bars in a chart is currently 10.
BARS Output Formats
The $gr_bars system task accepts a real expression for the <max_height > argument.
Additionally, any bar which monitors a real expression has a real value shown at the top of
the bar. No format specifier is necessary.
Plotting
The <begin_time > and <end_time > arguments of the $ps_waves system task can
now be expressed as real numbers. These values are assumed to be in the units of the most
recently executed $timeformat system task.
Understanding Bar Values
The current value associated with a bar appears above the bar. Any bar that monitors a real
expression has a real value shown at the top of the bar. If the number contains too many digits
to fit in the available space, it is truncated on the right, and a "~" appears to indicate
truncation has occurred.
February 1993
48
Product Version 1.2c
Graphical Output for the Verilog Product Family
Bar Graph Output
When the current value associated with a bar exceeds <max_height >, the value shown at
the top of the bar is correct, but the bar is only shown at <max_height >. On color windows,
the bar changes color to indicate this off-the-scale condition.
Example Calls to $gr_bars
The following is an example of a multiple calls to $gr_bars.
$gr_bars("queue lengths", 10, "Schq",sched_q_count, "Dpchq", s1.dispatch_q_count,
"Dkq1",s1.diskq_count[1],"Dkq2",s1.diskq_count[2],"Dkq1",s1.diskq_count[3],"Dkq1
", s1.diskq_count[4]);
$gr_bars("mean inter-arrival times", 100, "Schq", "Dpchq", "Dkq1",
"Dkq2", "Dkq3", "Dkq4", sched_q_mat, dispatch_q_mat,
disk_q_mat[1], disk_q_mat[2], disk_q_mat[3], disk_q_mat[4]);
$gr_bars("average wait times", 100, "Schq", "Dpchq", "Dkq1", "Dkq2",
"Dkq3", "Dkq4", sched_q_awt, dispatch_q_awt, disk_q_awt[1],
disk_q_awt[2], disk_q_awt[3], disk_q_awt[4]);
$gr_bars(“longest wait times currently in queues", 50.0, "Schq","Dpchq", "Dkq1",
"Dkq2", "Dkq3", "Dkq4", sched_q_lwt,dispatch_q_lwt, disk_q_lwt[1],
disk_q_lwt[2],disk_q_lwt[3], disk_q_lwt[4]);
$gr_bars("cpu busy flag and cpu utilization", 100,
"rand",bignum,"busy",100*s1.c1.cpubusy, "util",(s1.c1.totalbusy*100.0)/$time);
The <chart_names > are queue lengths, mean-arrival times, average wait times, etc. The
<max_height > for the first chart is 10 and the strings Schq, Dpchq, Dkq1, Dkq2, Dkq3,
Dkq4 are the bar legends for the bars representing variable sched_q_count (in the current
scope) and variables (in scope s1) dispatch_q_count, diskq_count[1],
diskq_count[2], diskq_count[3], and diskq_count[4], respectively. Figure 4-1 on
page 50 is a sample output of this example.
February 1993
49
Product Version 1.2c
Graphical Output for the Verilog Product Family
Bar Graph Output
Figure 4-1 Example BARS Window Output
February 1993
50
Product Version 1.2c
Graphical Output for the Verilog Product Family
5
Timescales
The $timeformat system task is a Verilog system task that establishes the time unit for
delays entered interactively, as well as the time unit, precision, suffix string and minimum field
width for time information displayed using the %t format specifier. The time unit, precision,
suffix string and minimum field width for the cursor, marker and ∆ times—which appear in the
upper right-hand corner of the WAVES window—are also derived from the $timeformat
system task. The same is true for the time in the upper right-hand corner of the REGS
window. (Please refer to the Verilog-XL Reference Manual for the exact syntax and definition
of the $timeformat system task).
The $timeformat system task can appear in your Verilog source description or it can be
entered interactively. The most recently executed $timeformat system task formats the
times displayed in the upper right-hand corner of the WAVES and REGS windows. If no
$timeformat system task has been executed, the default time unit is set to the smallest
precision argument of the ‘timescale compiler directives in the source description.
February 1993
51
Product Version 1.2c
Graphical Output for the Verilog Product Family
Timescales
February 1993
52
Product Version 1.2c
Graphical Output for the Verilog Product Family
6
Plotting Waveforms
The Verilog graphics interface allows you to create a PostScript™ format file from the WAVES
window. This file can then be sent to a laser printer or any other device that can accept a
PostScript™ description of the image to be plotted. The plot can be one or many pages long,
and the scale of the waveforms on the plot is easily selected using the mouse. This chapter
explains how to use the Graphics output to plot and print your waveform data. This chapter
contains the following sections:
■
Using the $ps_waves System Task
■
Selecting Signals for the Plot
■
Scaling the Plot
■
Making Multi-Page Plots
■
Performing System Administration for a LaserWriter
Using the $ps_waves System Task
The system task $ps_waves creates the PostScript™ file. It takes several arguments, all of
which are optional.
Syntax:
$ps_waves("<filename>", "<header>", <begin_time>, <end_time>);
Arguments:
<filename >
A string, enclosed in double quotes, that is a valid operating
system filename.
< header >
A string, enclosed in double quotes, that is printed as a header
on each page of the plot.
February 1993
53
Product Version 1.2c
Graphical Output for the Verilog Product Family
Plotting Waveforms
<begin_time >
An integer or real number, assumed to be in the units of the most
recently executed $timeformat system task, that specifies the
first time to display on the plot.
<end_time >
An integer or real number, assumed to be in the units of the most
recently executed $timeformat system task, that specifies the
last time to display on the plot
Note that the filename passed to $ps_waves is limited to a literal string. This is the only
system task with this limitation — all others that need a filename can accept a string variable.
If no <filename > argument is specified, then the PostScript description of the plot is placed
in the file gr_waves.ps. If the file specified already exists, it is overwritten.
The header string can be up to 60 characters long. If a longer string is specified, it is truncated
and a warning message is issued. To specify a header argument, a <filename > argument
must also be specified.
The endpoints of the plot can either be specified using the <begin_time > and
<end_time > arguments, or they can be selected using the cursor and marker lines on the
WAVES window. If no <begin_time > and <end_time > argument pair is given, then the
lower of the cursor and marker positions is taken as the begin time, and the greater of the two
is taken as the end time. If a <begin_time > argument is specified, then an <end_time >
argument must also be specified. To specify a <begin_time > and <end_time >
argument pair, the <filename > and <header > arguments must also be specified.
Examples:
$ps_waves;
$ps_waves("mycircuit.ps");
$ps_waves("mycircuit.ps","read cycle");
$ps_waves("mycircuit.ps","read cycle", 3510, 8900);
The <begin_time > and <end_time > arguments of the $ps_waves system task can
now be expressed as real numbers. These values are assumed to be in the units of the most
recently executed $timeformat system task.
Selecting Signals for the Plot
Each plot can display up to 20 signals. The signals to be plotted are selected by displaying
them on the window using the standard waves commands such as the SELECT window and
the Group buttons.
February 1993
54
Product Version 1.2c
Graphical Output for the Verilog Product Family
Plotting Waveforms
Scaling the Plot
The scale of the plot—that is, how close together the edges appear on the paper—is selected
by scaling the window display using the ZOOM button. The closer the edges are on the
window, the closer they appear on the paper plot.
Making Multi-Page Plots
The number of pages in the plot is determined by the begin time, end time, and scale of the
plot. There is no limit to the number of pages that can be plotted.
Performing System Administration for a LaserWriter
The printing of waveform plots has been tested from both the Sun™ and Apollo workstation
platforms using an Apple LaserWriter™. While other devices have not been tried, there is
every reason to believe that any device capable of printing from a PostScript™ description
can print the output from $ps_waves.
We are including instructions for setting up the printer on both workstations for your
convenience.
Sun Workstations
To set up the printer on a Sun, edit the file /etc/printcap to have the following entry:
#LaserWriter on RS232 PortA lw|ps|postscript|PostScript:lp=/dev/ttya:sd=/usr/
spool/lw: :lf=/dev/console: :br#9600:rw:fc#0000374:fs#0000003:xc#0:
:xs#0040040:mx#0:sf:sh
Create a spooling directory for the LaserWriter such as /usr/spool/lw. All users are able
to plot PostScript files by typing:
lpr -Pps ’postscript_filename’
For more information, see the Sun System & Network Administration manual.
Apollo Workstations
To set up the printer on an Apollo, edit or create a configuration file for a default LaserWriter
on serial port one. Place this file in /sys/print/printer_config.data. It must contain
the following entries:
February 1993
55
Product Version 1.2c
Graphical Output for the Verilog Product Family
Plotting Waveforms
bottom_margin 0
collate_copies on
cpi 12
device laserwriter
file_banners off
form_feeds 0
interface serial
lpi 6
pageno_column 72
page_headers off
page_width 78
page_reversal on
paper_size A
plot_mode on
print_length 8
print_width 5.5
printer_name p
resolution 300
sio_line 1
speed 9600
top_margin 0
Start a print server process by typing the following command:
cps /com/sh -c ’/com/prsvr’
All users are able to plot PostScript files by typing this command:
prf ’postscript_filename’ -transparent
February 1993
56
Product Version 1.2c
Graphical Output for the Verilog Product Family
7
Remote Graphics Support
Remote Graphics allows you to run the Verilog simulator on a remote host and, at the same
time, view and interact with graphics on a local workstation.
The Remote Graphics system tasks available are:
■
$gr_remote—Connects a simulation process on one machine with a graphics process
on another machine.
■
$gr_synchon—Synchronizes the simulation and graphics processes with respect to
simulation time.
■
$gr_synchoff—Decouples the simulation and graphics processes with respect to
simulation time.
This chapter provides a brief overview of the use of Remote Graphics with Verilog-XL and the
Graphical Output. Please refer to the Remote Graphics Reference Manual for complete
details on the Remote Graphics product and the use of the above system tasks.
This chapter contains the following sections:
■
Remote Graphics on the Apollo/Aegis System
■
Graphics Window Scrolling Problem on Apollos
■
Graphical Output Features Not Present in Remote Graphics
■
Clarifications for Use of $save and $restart with Remote Graphics
■
Bug Fixes
Remote Graphics on the Apollo/Aegis System
You can run Remote Graphics only on systems that support the UNIX Transmission Control
Protocol / Internet Protocol (TCP/IP). Consequently, a gr_vlog graphics object module that
supports Remote Graphics uses UNIX TCP/IP for communications.
February 1993
57
Product Version 1.2c
Graphical Output for the Verilog Product Family
Remote Graphics Support
In light of this requirement, Cadence provides two gr_vlog object modules with each Verilog
release on Apollo/Aegis™ 9.7 systems: one module that supports Remote Graphics and one
that does not.
The Verilog executable file shipped on the Apollo/Aegis 9.7 system is linked with the
gr_vlog object module that does NOT support Remote Graphics. Therefore, Apollo/Aegis
9.7 users whose systems support UNIX TCP/IP and who wish to run Remote Graphics must
relink Verilog with the gr_vlog object module that does support Remote Graphics. The
Verilog configuration program, Vconfig , can be used to reconfigure the Verilog executable
module appropriately. Please consult the Vconfig User’s Manual for details about how to use
this program.
Graphics Window Scrolling Problem on Apollos
If you run a Verilog-XL simulation on any Apollo, have any Graphics window open (that is,
WAVES, REGS, or BARS), and Verilog is stopped at the interactive prompt; you cannot scroll
the Verilog window backwards without first pressing the HOLD key. After reviewing the
transcript in the Verilog window, press the HOLD key again to release it before continuing.
Graphical Output Features Not Present in Remote
Graphics
Remote Graphics does not support the system tasks $gr_color and $gr_position. Note
that the Graphics software executes any $gr_position command on all systems in local
mode (and only in local mode). You can change the window size and position in remote mode
only by manual means.
You cannot interrupt a redraw in a remote WAVES window by typing Control-C in the
Verilog-XL interactive window.
Clarifications for Use of $save and $restart with Remote
Graphics
The next two sections explain some of the ramifications of using $save and $restart with
Remote Graphics.
February 1993
58
Product Version 1.2c
Graphical Output for the Verilog Product Family
Remote Graphics Support
Setting the Graphics Host
The RHOST environment variable simplifies the naming of the remote system that is to receive
the output of a Verilog-XL simulation. You can name the remote host either with the RHOST
variable or as an argument to the $gr_remote system call as explained below:
■
$gr_remote() — This defaults the Graphics host to the system specified by the
environment variable RHOST. If Remote Graphics is not running on that system, or RHOST
is not defined, then the Graphics host defaults to the local system.
■
$gr_remote("xyzzy") — This defaults the Graphics host to the system named
xyzzy. If Remote Graphics is not running on that system, then the host is selected as
described in the previous bullet item. The $save system task saves the host name
specified by $gr_remote and reassigns this host when $restart is executed.
The preferred method for naming the remote host when using $restart is to use the RHOST
variable. This allows you to change to a different host when restarting after $save.
Saving Window Size and Position
The $save system task saves the current window size and position only when Graphics is
running locally in Sunview. When Remote Graphics runs in Sunview, or when Graphical
Output or Remote Graphics runs under Apollo GPR or X-Windows, the window size and
position revert to the Graphics defaults on execution of $restart.
Bug Fixes
The following bug fixes apply specifically to Remote Graphics.
Remote Graphics crashes after several Verilog-XL runs
In releases prior to version 1.2a, you could run multiple consecutive simulations in
communication with Remote Graphics under Sunview. In version 1.2a, this caused a crash,
with Sunview running out of windows. This has been fixed.
Second Verilog-XL simulation opens closed window
Under Sunview, a Graphics window that was an icon during one simulation used to open as
a window when the next Verilog-XL simulation started (thereby reducing simulator
performance). This problem has been fixed.
February 1993
59
Product Version 1.2c
Graphical Output for the Verilog Product Family
Remote Graphics Support
Remote Graphics does not work with Open Windows
Remote Graphics now works with Open Windows.
Crash occurs on mouse click on group defined after $gr_waves
Remote Graphics used to crash if a group was defined that included signals from a call to
$gr_addwaves—if there had been a call to $gr_bars or $gr_regs between the calls to
$gr_waves and $gr_addwaves. This problem has been fixed
Crash caused by space in group_name
Remote Graphics used to crash when there was a space in the group_name specified for
$define_group_waves. This has been fixed.
February 1993
60
Product Version 1.2c
Graphical Output for the Verilog Product Family
8
Limitations
This chapter describes the general and platform-specific functional limitations of the
Graphical Output software. This chapter contains the following sections:
■
General Limitations
■
Sun-Specific Information
■
Apollo-Specific Information
General Limitations
The current release of the Graphical Output has the following limitations:
■
The Verilog save and restart features are not supported after any of the graphics output
mechanisms have been used.
■
The maximum length of a line in the REG window is 80 characters.
■
The maximum number of bars in a bar chart is 10. The maximum number of charts
displayed at one time is 5.
■
When using the $define_group_waves task, the <signal_label > character
string must match exactly with the <signal_label > character string previously
defined including spaces and format specifiers. For example, if in the $gr_waves task
a signal label is specified as bus %d, then in the $define_group_waves task, the
signal label must also be given as bus %d(not just bus).
■
Simulation time values cannot exceed 64 bits in length. All simulation time values are
stored in most precise ‘timescale compiler directive given in the Verilog code. To work
around this, use ‘timescale compiler directives only to the precision absolutely
necessary.
■
Some of the waveform edges and text might appear brighter than the rest. There is no
significance to this.
February 1993
61
Product Version 1.2c
Graphical Output for the Verilog Product Family
Limitations
■
The $gr_regs and $gr_waves windows cannot display formatted values that are more
than 256 characters long. The number of characters required for display can be
calculated based on the number of bits in a value and the format specifier used. There
are two ways to circumvent this limit:
a. Display the value in a format that requires 256 characters or less.
b. Split the value into multiple pieces—by using part-selects of a vector, for example—
so that each piece requires no more than 256 characters to display.
■
String arguments that embed double quote characters (\") cannot be passed to Remote
Graphics for display in graphics windows. This is due to the protocol Remote Graphics
uses to exchange data between separate simulation and graphics processes. The
graphics interface skirts this limitation by automatically converting embedded double
quotes to single quotes before passing them to the Remote Graphics process for display.
For example, if you input the following string:
$gr_regs(“problem string: %s”, “This is a quote -> \” “);
The resultant output in the REGS window is the following:
problem string: This is a quote -> ‘
Double quote characters do not pose a problem for the normal graphics operation, which
is part of the same process as the simulation.
■
When the cursor or marker occurs at that edge due to an XOR operation, The operations
for window manipulations are not stored in the keys file; therefore, these operations
cannot be replayed from the keys file.
Sun-Specific Information
The graphics interface on Sun workstations has been integrated with the Suntools package.
Verilog-XL should be invoked from one of the windows inside the Suntools. The graphics
windows can be moved, closed, resized, exposed, hidden, or redisplayed using Sunview’s
window, Frame Menu . A quit on the window is ignored. To get maximum speed and better
graphics, we recommend that you do not resize the window.
Sun-Specific Limitations
■
The very first mouse input click is always interpreted as a left mouse button click.
■
When system loading is heavy, mouse events sometimes get buffered, requiring extra
clicks to perform desired operations. This can be identified by characteristic symptoms:
February 1993
62
Product Version 1.2c
Graphical Output for the Verilog Product Family
Limitations
Several clicks produce no response, followed by additional clicks, whose actions lag
noticeably behind their trigger clicks.
Methods suggested to recover normal mouse function are as follows:
■
❑
Continue simulation for a few simulation units and try the mouse again.
❑
Click on a button that might not greatly affect the target operation —for example,
click the middle button to swap cursor and marker. Then, continue simulation for a
few seconds and try the display again.
❑
If the symptoms persist, try to avoid clicking ahead of the display. Wait for each
mouse action to take effect before clicking again.
Certain graphics programs —such as FrameMaker TM from Adobe—aggravate mouseevent buffering. In such cases, it is often necessary to exit Suntools and then reenter to
clear up buffering.
Graphics Under the Bourne Shell on Sun Workstations
You can run Verilog Graphics under the Bourne shell (/bin/sh) on Sun workstations. Due
to a SunOS bug, this used to cause all keyboard interrupts to be ignored and interactive input
to hang the process. Because command scripts are fed to /bin/sh for processing unless
otherwise specified, Verilog Graphics could not be started from inside a shell script. The
SunOS bug still exists, but it no longer affects Verilog Graphics.
Running Graphics from a UNIX Command File
You can run Verilog with graphics from a UNIX command file since the interrupt key is now
recognized.
Apollo-Specific Information
The graphics interface on Apollo workstations has been integrated with the standard window
system. Verilog can be invoked from any AEGIS window. The graphics windows can be
moved, resized, or popped using the standard Apollo commands.
Apollo-Specific Limitations
■
Only windows that do not have other windows overlapping on top of them have data
redisplayed or accept input.
February 1993
63
Product Version 1.2c
Graphical Output for the Verilog Product Family
Limitations
■
The windows can turn black due to moving/resizing. The data reappears the next time
data is written to that particular window, but only if the window has no overlapping
windows on top of it.
■
Mouse input can be ignored after a window goes blank. This problem can be alleviated
by popping the graphics windows.
■
Closing the graphics windows into icons on Apollo workstations has the effect of blocking
the Verilog process, thus stopping the simulation.
February 1993
64
Product Version 1.2c
Graphical Output for the Verilog Product Family
9
Bugs
This chapter contains the following sections:
■
Bug Fixes
■
Outstanding Bugs
Bug Fixes
The following bug fixes have been made for this final release of the Graphical Output for the
Verilog product family.
Segmentation fault occurs when $gr_addwaves follows a $gr_waves with
no signals
Invoking $gr_waves with no signals at time 0, followed by a $gr_addwaves very early in
the simulation, no longer causes a segmentation fault.
Fatal error occurs when simulation time exceeds 31 bits
In version 1.2a, both the WAVES and REGS windows supported 64-bit simulation time
values. However, under certain circumstances, a fatal error used to occur when the span of
time units stored in the simulation history exceeded 31 bits. This bug is now fixed so that the
Graphics software no longer crashes. However, the Graphics software data structure design
still only allows simulation history to span 31 bits worth of simulation time. When the number
of time units experienced by simulation history approaches 31 bits, Graphics starts deleting
simulation history from memory. At this point, it prints the following message:
> Graphics: WARNING - Discarding value changes at time 3100000000:
> Waves history would span too large a time value.
Occasionally, the software cannot delete history without fatally impacting the simulation. If
deleting simulation history so that the elapsed time fits within 32 bits causes less than fifty
history units to remain, the Graphics software exits with the following messages:
February 1993
65
Product Version 1.2c
Graphical Output for the Verilog Product Family
Bugs
>
>
>
>
>
>
WARNING at time 3200000000: Too much waves history would be depleted:
Must keep at least 50 time cells in memory.
Check memory allocation and circuit activity
fatal error in routine gr_minimize_ds_times:
Can’t normalize data structure
This situation occurs if you are monitoring signals that change infrequently relative to the
passing of simulation time. This could require deletion of history resulting in less than 50 time
units remaining in memory. In this situation, the software experiences a fatal error. One way
to solve this problem is to add monitoring to a signal that changes more frequently.
Control-c and other windows-related Verilog crashes
Verilog-XL no longer crashes when a user types Control-c with the Graphics window
displayed. A bug that allowed window requests to be serviced when the Graphics data
structures were incomplete has been fixed.
Initial delta value is incorrect in successive $ gr_waves calls
The WAVES window no longer displays an erroneous initial delta value for successive
$gr_waves calls during the same simulation.
Overlapping display of bus values in WAVES window
There is no longer an overlapping display of bus values in the WAVES window.
Core dump occurs when Graphics memory is increased more than once
A core dump used to occur when REGS or WAVES memory was increased more than once
before the window was opened. This was fixed so that a second memory allocation now
executes correctly. When a memory allocation executes, the Graphics software displays a
confirmation message. The following example shows an interactive invocation of
$gr_waves_memsize and the resulting message. The allocated size total shows how much
of the memory available for allocation is currently allocated.
> $gr_waves_memsize (600000);
Waves memory size = 600000 Allocated size = 494208
This same form of message would be displayed by $gr_regs_memsize.
February 1993
66
Product Version 1.2c
Graphical Output for the Verilog Product Family
Bugs
Incorrect display when $gr_addwaves follows a $gr_waves not at time 0
Waves now displays correctly when $gr_addwaves is executed following a $gr_waves not
at time 0. This bug only occurred in version 1.2a only.
Incorrect data display after Graphics history deleted
A window error sometimes caused signals that changed infrequently to show incorrect values
after Graphics history was deleted. This has been corrected.
Fatal error in routine gr_deleted_regs_cell
An error was issued whenever the Graphics memory manager could not find an appropriately
sized memory cell in old Graphics history to overwrite with more recent data. This has been
corrected by allocating more memory. Refer to “Change in Definition of $gr_waves_memsize”
on page 12 for more information.
Overlap of WAVES and REGS windows
Under some windowing environments, the default positions of the WAVES and REGS
windows overlapped. This has been corrected.
BARS graphics drawn in WAVES or REGS window
Calls to $gr_bars no longer cause pieces of the BARS text and Graphics to be written into
the WAVES or REGS window.
Support for Sunview version in OPENLOOK®
The Sunview version of Graphical Output is now supported in the OPENLOOK environment.
Segmentation fault occurs if $ps_waves is issued without a prior
$gr_waves
When a $ps_waves call was issued with begin and end arguments, but without a prior
$gr_waves call, the software used to crash with a segmentation fault. This has been fixed.
When $ps_waves is issued without a prior $gr_waves, the following error message
displays:
February 1993
67
Product Version 1.2c
Graphical Output for the Verilog Product Family
Bugs
no graphics history available
Compilation terminates when <max_height> is 0
Verilog-XL compilation no longer terminates when the <max_height > argument to the
$gr_bars system task evaluates to zero.
Fatal error occurs when defining group name
Leaving out the second parameter <group_name > for the system task
$define_group_waves no longer causes Verilog-XL to crash. The compiler now gives a
compiler error to identify the omission.
Outstanding Bugs
The following is a list of all known bugs in this final version of the Graphics software, along
with their known workarounds.
Monitoring a signal with a zero-delay loop
Monitoring signals of a Verilog description that does not advance in time may cause
excessive warnings and increases in memory allocation to occur after simulating for several
minutes. If this condition occurs, check for a zero-delay loop in the Verilog code.
Allowing this situation to continue might cause all virtual memory to be exhausted, causing
the computer to hang or crash.
Clicking in the Graphics window during simulation (Sunview only)
In Sunview, clicking the mouse in a Graphics window while Verilog-XL simulation is running
(not in interactive mode) may cause the cursor to become invisible. However, if the mouse is
moved to another window, the cursor reappears.
Limit on simulation time-range available for window
The Graphics software can maintain simulation history to represent approximately 231 bits of
simulation time. When this limit is reached, the software starts deleting early simulation
history.
February 1993
68
Product Version 1.2c
Graphical Output for the Verilog Product Family
Bugs
Blank transition fields on bus values
In the WAVES window, the value in the first transition field displayed for a bus is sometimes
blank until the window is refreshed. As a workaround for this anomaly, click on the redraw
button (RDRW ).
Thick lines appear in the window
When scrolling the window, during simulation or interactively, some lines might appear as
double the width of others. This is caused by round off differences within the different drawing
algorithms. To correct the window, click on the redraw button (RDRW ).
Key file values are incorrect
Under certain conditions, key file values are not correct for time related commands done
interactively using the mouse, such as setting the cursor position in either the REGS or the
WAVES window. This problem shows when the $gr_waves command is issued at a time
other than 0, or when simulation time exceeds 31 bits. There is no workaround for this
problem.
February 1993
69
Product Version 1.2c
Graphical Output for the Verilog Product Family
Bugs
February 1993
70
Product Version 1.2c
Graphical Output for the Verilog Product Family
Index
Symbols
E
$define_group_waves 24 to 25, 34, 61
syntax 24
$display 10, 17, 41
$freeze_waves 25
syntax 25
$gr_addwaves 37
syntax 27
$gr_bars 10, 47
$gr_jumptotime
in regs output 44
in waveform output 27
syntax 27
$gr_regs 10, 39 to 46, 62
syntax 39
$gr_regs_memsize 43
syntax 43
$gr_remote 57
$gr_synchoff 57
$gr_synchon 57
$gr_waves 9, 16 to 17, 27, 31, 37, 61
syntax 16
$gr_waves_memsize
syntax 26
$monitor 10
$ps_waves 53 to 54
$timeformat 31, 37, 44 to 46, 54
effects on regs display 44
with waveform output 28, 51
$unfreeze_waves
syntax 25
e or E 41
examples
$gr_bars 49
$gr_regs 40
$gr_waves 17
$ps_waves 54
multiple calls to $gr_bars
F
format specifiers
(b)binary 16, 41
(d)decimal 16, 41
(h)hexadecimal 16, 41
(o)octal 16, 41
(s)string 16, 41
(t)time 41
‘real’ decimal 34, 46
‘real’ exponential 34, 46
e or E 16, 34, 46
f or F 16, 34, 41, 46
for regs 34, 41, 45
for waves 16
g or G 16, 34, 41, 46
real decimal 16, 41
real exponential 16, 41
t 34, 46
time 16, 34, 46
G
A
general limitations 61
gr_vlog 10, 57 to 58
Apollo workstations 55
Apollo-specific information 63
Apollo-specific limitations 63
I
B
interacting with REGS display 44 to 45
interacting with waveform display 29 to 34
Introduction 9 to 13
Bar Graph Output 47
BARS example 50
February 1993
49
71
Product Version 1.2c
Graphical Output for the Verilog Product Family
J
jumping to a specified time
setting storage space 26
setting up display 16 to 17
using $timeformat with 28
waves screen 29 to 31
44
L
limitations
61 to 64
M
multi-page plots
55
Q
quick reference 46
R
REG Screen Output 39
remote graphics support 57 to 58
S
scaling the plot 55
selecting signals for the plot 54
setting the storage space 43
setting up the display 39 to 41, 47
Sun workstations 55
Sun-specific information 62 to 63
Sun-specific limitations 62 to 63
system administration for LaserWriter
55
U
using $timeformat system task
44
W
waveform output 15 to 38
adding signals to 26 to 27
defining signal groups 24 to 25
freezing the display 25 to 26
jumping to specified time 27
February 1993
72
Product Version 1.2c