1
12
Interactive Biplot Construction
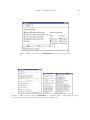
possible to select several elements to be modified at once. This tool is also useful as a data
analysis tool: selecting any element (case or variable) is reflected also in the data window
(provided it is already open). Using these dialog windows it is also possible to set the current
properties for axes/arrows/points as default for future biplots.
The Move tool allows the user to modify the length of the arrows keeping fixed the relative
lengths to one another, or even to change the length of a single arrow. It is also possible to
move the labels to place them in a better position than the one assigned automatically by the
(a bit smart) default algorithm. This algorithm tries to place the labels for points and arrows
in an appropriate position, but it do not try to avoid overlapping after a first attempt. This
should be improved in a future version.
Finally the Coords tool is useful to show the coordinates of any click in the graph, and the
Help tool gives access to a context sensitive series of help screens.
Numerical output
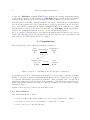
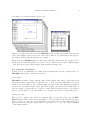
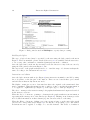
Numerical output is accessible through the item Save biplot Report in the Save... menu button
(see Figure 8). The report can be directed to a text file or displayed in a window.
Figure 8: Dialog window used in XLS-Biplot to obtain a numerical report on the characteristics of the biplot and the data used to build it.
The report includes a brief summary of the data and the options used to build the biplot, and
the eigenvalues obtained in the SVD and the subsequent percentage of variability captured in
each dimension (see section 2) as well as the quality of the representation of the variables in
the plot. Optionally, the biplot report may include the data list, a statistical data summary,
case label listing, weight listing or transformed coordinates listing.
Graphical output
The screen-resolution (low quality) graph produced by XLS-Biplot in its window may be
used in many ways depending on the operating system it runs on. Under Linux/Unix it is
possible to save a postscript file containing the screen-resolution graph. Under MS-Windows,