1
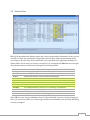
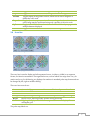
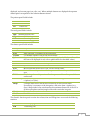
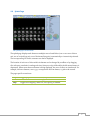
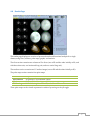
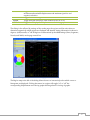
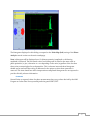
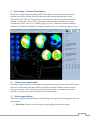
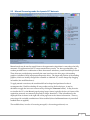
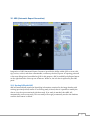
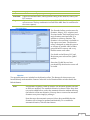
6.2 Reviewing Results Phase calculations Phase calculations are based on the analysis of mid-myocardial motion or myocardial thickening derived from the epi- and endocardial surfaces. Displacements and thickening are calculated along the mid-myocardial normal for each interval, and the resulting time-dependent signals are interpolated by Fourier transform. The phase and amplitude of the first harmonic are computed. Phase values can be expressed in degrees [deg] (0-359), in milliseconds [ms] with heartbeat length information that is available in the dataset header (assuming a default heart rate of 60bpm if the actual beat length is not available), or as a percentage of the cardiac cycle duration [%cy] (0-99). Amplitude (of motion or thickening) is always expressed in millimeters [mm]. Regional values Within any region the following values are calculated and can be displayed on the polar map: mean (average over the region), standard deviation, mode (location of the peak of the distribution of values), and entropy. The entropy H(X) is calculated for the distribution of values as follows: H ( X ) P( x) log 2 [ P( x)] x where P(x) is the probability that variable X is in state x and Plog2P is defined as 0 if P=0. H(X) is expressed in percent where 0% (minimum) means all values are identical in the region and 100% (maximum) indicates uniform distribution of all values across the region. Mean and mode are indicators of regional value and can be used to evaluate interregional variations, while standard deviation and entropy measure intraregional variability. Global value To provide an assessment of global ventricular synchrony, the phase panel includes the global LV entropy derived from mid-myocardial wall motion. This value is calculated as indicated in the previous section, with the calculation extended to all LV samples. Note: the type of value provided in this space may change in future releases as the clinical value of this information is assessed. Phase-related graphs and histograms An additional dialog can be displayed to show displacement and velocity (first temporal derivative of the displacement) curves, thickening and regional counts curves, as well as phase histograms. The following controls are available on the dialog: The following controls are available on the Displacement/Velocity dialog. Values Toggle shows or hides maximum displacement and maximum (negative) velocity. 27