1
Chapter 6
Historical Data Logging and Extraction
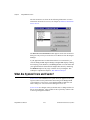
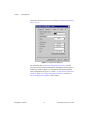
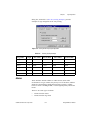
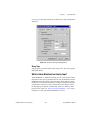
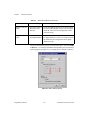
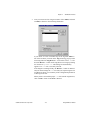
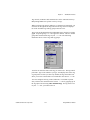
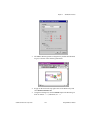
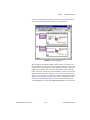
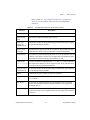
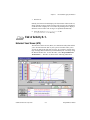
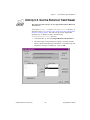
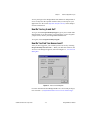
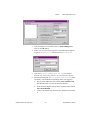
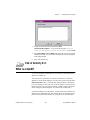
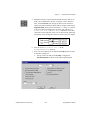
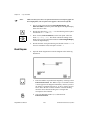
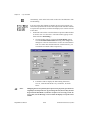
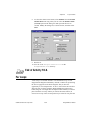
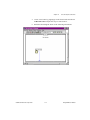
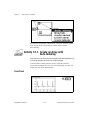
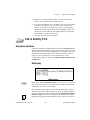
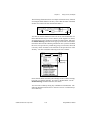
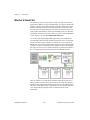
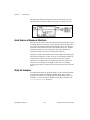
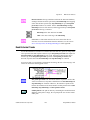
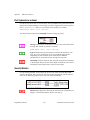
appears, shown below, and you can enter the start and stop time of the
data displayed in the trend.
How Do You Change the Timespan of Data
Displayed?
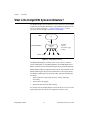
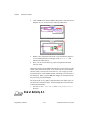
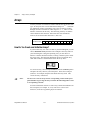
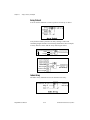
The timespan indicator displays the amount of relative time between the
start and end points of the time axis. To change the amount of time
between these points, you either can manually re-enter data in the start
or end point on the time axis, or pull down the ring for the timespan
indicator.
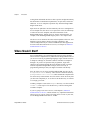
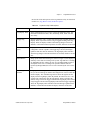
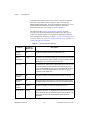
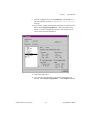
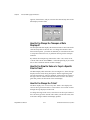
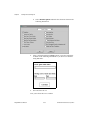
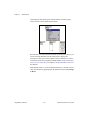
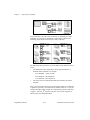
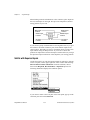
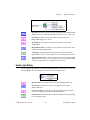
By default, the timespan ring contains the values 1:00, 10:00, 30:00,
1:00:00, and 3:00:00. Select Other… in the timespan ring if you would
like to enter a different amount of data to display.
How Do You View the Value of a Tag at a Specific
Point in Time?
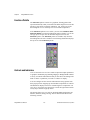
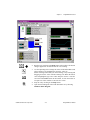
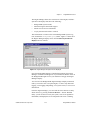
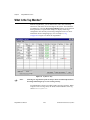
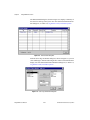
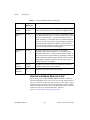
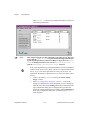
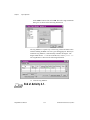
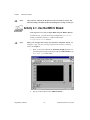
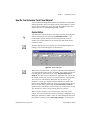
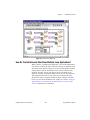
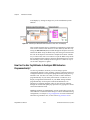
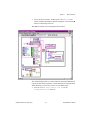
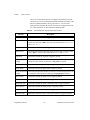
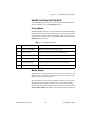
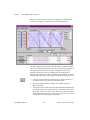
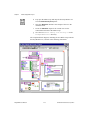
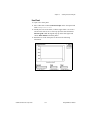
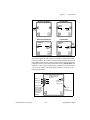
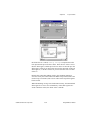
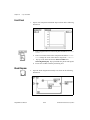
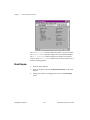
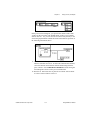
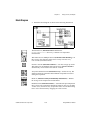
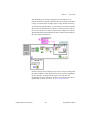
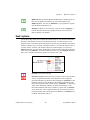
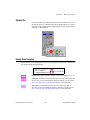
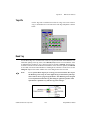
The Data Display table on the HTV, shown in Figure 6-2, shows the tags
displayed in the trend, the tag description, and the engineering units
associated with the tag. The two rightmost columns show the values of
the tags at the two cursor locations in the trend. To move the cursors,
grab their pointers at the bottom of the trend display.
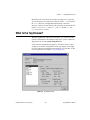
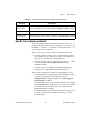
How Do You Change the Y Axis?
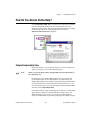
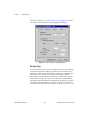
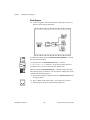
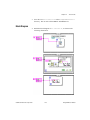
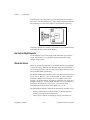
The HTV displays two Y axes at any time. Each Y axis displays the
color of the tag associated with it. Click on the Y axis to make it rotate
through the tags displayed in the trend.
To change the range in the Y axis, select the text at the top or bottom of
the scale and type in the desired value. When you enter the value, that
trend scale changes and the trend display updates.
BridgeVIEW User Manual
6-12
© National Instruments Corporation