1
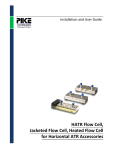
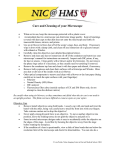
Installation and User Guide
JetStream ATR Accessory
The information in this publication is provided for reference only. All
information contained in this publication is believed to be correct and
complete. PIKE Technologies, Inc. shall not be liable for errors contained herein
nor for incidental or consequential damages in connection with the furnishing,
performance, or use of this material. All product specifications, as well as the
information contained in this publication, are subject to change without notice.
This publication may contain or reference information and products protected
by copyrights or patents and does not convey any license under the patent
rights of PIKE Technologies, Inc. nor the rights of others. PIKE Technologies, Inc.
does not assume any liability arising out of any infringements of patents or
other rights of third parties.
This document contains confidential or proprietary information of PIKE
Technologies, Inc. Neither this document nor the information herein is to be
reproduced, distributed, used or disclosed, either in whole or in part, except as
specifically authorized by PIKE Technologies, Inc.
PIKE Technologies, Inc. makes no warranty of any kind with regard to this
material including, but not limited to, the implied warranties of merchantability
and fitness for a particular purpose.
Copyright 1991-2013 by PIKE Technologies, Inc., Madison, WI 53719. Printed in
the United States of America. All world rights reserved. No part of this
publication may be stored in a retrieval system, transmitted, or reproduced in
any way, including but not limited to, photocopy, photograph, magnetic or
other record, without the prior written permission of PIKE Technologies, Inc.
Address Comments to:
PIKE Technologies, Inc.
6125 Cottonwood Drive
Madison, WI 53719
Phone
Fax
E-mail
Web Site
Jan. 1, 2013
(608) 274-2721
(608) 274-0103
[email protected]
www.piketech.com
Contents
Introduction
Unpacking Your Accessory
Packing List
Installation
Performance Verification
Sampling Procedures
Cell Filling
Cell Cleaning
Disassembly
Re-Assembly
ATR Spectra
ATR Correction
Theory
How ATR Works
Depth of Penetration
Precautions
SAFETY
Mirrors
Crystal Care
1
2
2
3
3
4
4
4
5
7
10
11
12
12
12
13
13
13
13
Introduction
The PIKE Technologies JetStream ATR Accessory is designed for use in your FTIR spectrometer. The
compact design employs a pair of transfer optics to direct the infrared beam to one end of an IR
transmitting ATR crystal. A similar pair of optics directs the beam emitted from the other end of the ATR
crystal to the spectrometer detector.
The ATR crystal for the JetStream ATR Accessory is of a cylindrical shape and is 82 mm long and 6.4 mm
thick. The volume of the sample chamber is 1.2 ml. In order to produce optimum performance from the
accessory, the length and diameter of the crystal has been carefully chosen. A larger diameter crystal
would result in less bounces of the infrared energy in the crystal, resulting in lower absorbances in the
resulting spectrum. A smaller diameter crystal would give more bounces in the crystal, resulting in a
greater absorbance in the spectrum, but the overall throughput of the device would be reduced. This
design gives 12 bounces of light along the cell surface. The standard crystal dimensions have been
chosen to maximize the signal to noise in the resulting spectra.
The maximum pressure rating is 1500 psi.
Figure 1. Schematic of the JetStream ATR Accessory and optics
PN 350-0201900-00
P a g e |1
Unpacking Your Accessory
In order for you to quickly verify receipt of your accessory, we have included a packing list. Please
inspect the package carefully. Contact PIKE Technologies if any discrepancies are noticed.
Packing List
User Manual
JetStream ATR Accessory
Hex Wrenches
PN 350-0201900
PN 020-19XX
Quantity 1 Set
Quantity 1
Quantity 1
(Crystal ordered separately)
PN 350-0201900-00
P a g e |2
Installation
The JetStream ATR Accessory has been aligned and tested to ensure that it performs to specification.
There are no customer alignments necessary.
1. Set your FTIR spectrometer to collect data at 4 cm-1 resolution (including FTIR J-stop). Your
JetStream ATR Accessory is set to an appropriate configuration to fit the sample compartment of the
FTIR instrument you specified. Before inserting the accessory in the sample compartment, ensure
that your spectrometer is aligned. If the instrument is not aligned, follow the manufacturer’s
instructions for maximizing the interferogram signal (the IR energy throughput) of your FTIR
spectrometer.
2. Fasten the accessory onto the FTIR sample compartment by attaching the supplied baseplate to the
bottom of your spectrometer. The JetStream ATR Accessory is now ready for use.
Performance Verification
1. With the accessory removed from the sample compartment, collect a background spectrum.
2. Place the JetStream ATR Accessory in the instrument.
3. Collect a transmission spectrum using the same collection parameters as used to collect the
background spectrum.
The transmission value of this accessory should be at least 7% for ZnSe and 6% for Ge at 1000 cm-1. If
your accessory does not meet this minimum transmission value when installed, please contact PIKE
Technologies. A typical energy throughput spectrum is shown in Figure 2.
20
18
16
14
%T
12
10
8
6
4
2
0
5000
4500
4000
3500
3000
2500
2000
1500
1000
cm-1
Figure 2. Sample throughput spectrum of the JetStream ATR Accessory with ZnSe crystal
PN 350-0201900-00
P a g e |3
Sampling Procedures
The sample spectrum is obtained by ratioing a sample scan collected with a sample in the JetStream ATR
Accessory to a background scan collected with no sample on the face of the crystal or to a background
scan collected with the pure solvent or other reference material in the cell.
Cell Filling
The cell may be removed from the accessory base for convenient filling and emptying. The cell has been
supplied with compression gas fittings for gas or liquid flow samples.
Always check the sealing prior to use by filling the cell while the cell is removed from the spectrometer.
The surface of the crystal should be fully covered for proper measurements, thus make sure that the
liquid flows out clearly without any bubbles indicating that the cell is full.
After the sample has been measured, the cell needs to be flushed with the next sample until there is no
residue left from the previous sample. Should the next sample be different in its chemical nature or the
concentration is very different, the cell needs to be washed in between samples. Cleaning and cleaning
validation is application and sample specific so the user must make sure that there is no cross
contamination from an earlier sample that could change the measurement results.
Cell Cleaning
Sometimes “carry over” may occur from one sample to another due to incomplete cleaning of a prior
sample from the face of the crystal. This effect may be minimized by “washing” the sample chamber
with the new sample, cleaning the crystal and then running a background scan. The sample is then
injected again and a sample spectrum collected.
The cell can be cleaned easily by flushing the cell with an appropriate solvent, detergent or other
cleaning fluids. Be sure to use solvents that are chemically compatible with EPDMTM cell seal. Contact
PIKE Technologies for KalrezTM O-ring options.
Samples should never be left in contact with the crystal for an extended period of time as some samples
may degrade the crystal material. Once the measurement has been made, remove the sample from the
crystal by cleaning the cell with a suitable solvent.
Should the crystal surface inside the cell get contaminated such that it is not removable by flushing the
cell, the only remedy is to take the cell apart. This has to be performed with care, because the crystal is
fragile. Scratches on the surface of the crystal will result in reduced energy throughput of the accessory.
PN 350-0201900-00
P a g e |4
Disassembly
1. Remove the cell from the accessory by unscrewing the two hex head socket cap screws at the top of
the cell, then lifting the cell out of the accessory.
2. Set the cell on a flat surface. Loosen button screws on the sides of the cell ½ turn.
3. Once all screws are loose, remove all screws and the outer caps on both ends.
PN 350-0201900-00
P a g e |5
4. Gently push crystal face on one side into the cell, to free the O-ring seal on the opposite side.
Carefully pull the crystal out of the flow cell.
The crystal surface is now exposed and can be cleaned. Note that the crystal used in the accessory is
made from zinc selenide, a fairly brittle material. A solvent (see the section below on crystal cleaning)
and a “Q tip” should be used to remove traces of a previous sample. Apply the solvent to the crystal
with a Q-tip and gently remove using a Q-tip or non-abrasive wipe. Repeat this procedure until all traces
of the sample have been removed.
The solvent used for cleaning your crystal is dependent on the sample that has been analyzed. In all
cases it is best to attempt to clean the crystal with the mildest solvent possible. For most cases the
preferred solvent is isopropyl alcohol. If a more vigorous solvent is required, acetone may be used. In
very stubborn cases dimethylformamide may be used.
In all cases when using solvents, inspect the materials safety data sheet associated with the solvent you
are using and comply with any recommended handling procedures. Also, confirm solvent compatibility
with the liquid cell O-ring.
NOTE: Under no circumstances must the crystals be rubbed with paper products such as “Kleenex”.
Many paper products are abrasive and could cause scratching of the crystal surface.
PN 350-0201900-00
P a g e |6
Re-Assembly
Once the ATR crystal and the cell interior are clean and dry, the cell can be re-assembled.
1. Place large O-rings onto inner caps. Slide inner caps into place on either end of the cell. Make sure
the screw holes are properly aligned.
2. Slide one of the small O-rings onto the end of the ATR crystal.
3. Carefully slide the end of the crystal opposite the small O-ring into the cell.
PN 350-0201900-00
P a g e |7
4. Once the crystal is completely inserted into the cell, position the second small O-ring onto the
opposite end of the crystal. The O-ring does not need to be completely on the crystal or in the
groove. The top cap will push it into place when it is screwed down.
5. Position top caps and screws on both sides of the cell. Make sure the screw holes are properly
aligned.
6. Tighten the screws gradually and evenly on both sides of the cell, keeping the outer cap
approximately parallel to the cell face.
PN 350-0201900-00
P a g e |8
7. Before completely tightening the screws, check the crystal to make sure it is approximately
centered in the cell lengthwise. If it is not, gently push on one side of the crystal face to re-position
the crystal within the cell.
8. Once the crystal is centered, completely tighten all of the screws. The cell is now ready to be placed
into the accessory.
PN 350-0201900-00
P a g e |9
ATR Spectra
ATR spectra are similar to transmission spectra. A careful comparison of ATR spectra and transmission
spectra reveals that the intensities of the spectral features in an ATR spectrum are of lower absorbance
than the corresponding features in a transmission spectrum and especially in the high wavenumber
(short wavelength) region of the spectrum. The intensity of the ATR spectrum is related to the
penetration depth of the evanescent wave into the sample. This depth is dependent on the refractive
index of the crystal and the sample, and upon the wavelength of the IR radiation.
The relatively thin depth of penetration of the IR beam into the sample creates the main benefit of ATR
sampling. This is in contrast to traditional FT-IR sampling by transmission where the sample must be
diluted with IR transparent salt, pressed into a pellet or pressed to a thin film, prior to analysis to
prevent totally absorbing IR bands.
A comparison of transmission vs. ATR sampling result for a thick polymer sample is shown below
(Figure 3) where the sample is too thick for high quality transmission analysis (shown in the lower
spectrum). In transmission spectroscopy, the IR beam passes through the sample and the effective path
length is determined by the thickness of the sample and its orientation to the directional plane of the IR
beam. Clearly in the example below the sample is too thick for transmission analysis because most of
the IR bands are totally absorbing.
Figure 3. ATR and transmission spectra of a thick polymer sample
However, simply placing the thick sample on the ATR crystal and applying pressure generates a high
quality spectral result (upper red spectrum) - identified by library search as a polybutylene
terephthalate. The total analysis time for the thick polymer by ATR was less than 1 minute.
PN 350-0201900-00
P a g e | 10
ATR Correction
If an ATR spectrum representative of a transmission spectrum is desired, the ATR spectrum must be
processed with the ATR correction program available on your instrument. An example of the effect of
this correction on a spectrum is shown in the following example for polystyrene. The lower spectrum is
the original ATR spectrum of polystyrene. The middle, blue spectrum is the transmission spectrum of
polystyrene. Clearly the IR bands around 3000 cm-1 in the ATR spectrum are weaker relative to the IR
bands at longer wavelength.
Figure 4. Original and corrected Spectra
However, in the upper red spectrum after ATR correction, we see relative IR band intensities very similar
to those from the polystyrene run by transmission.
PN 350-0201900-00
P a g e | 11
Theory
How ATR Works
With ATR sampling we direct the IR beam into a crystal of relatively higher refractive index. The IR beam
reflects from the internal surface of the crystal and creates an evanescent wave, which projects
orthogonally into the sample in intimate contact with the ATR crystal. Some of the energy of the
evanescent wave is absorbed by the sample and the reflected radiation (some now absorbed by the
sample) is returned to the detector. This ATR phenomenon is shown graphically in the following
representation of a single reflection ATR (Figure 5).
Figure 5. Graphical representation of a single reflection ATR
Depth of Penetration
The depth of penetration gives us a relative measure of the intensity of the resulting spectrum and is
expressed by the following equation:
dp =
λ
(
2π n12 sin 2 θ1 − n22
)
1
2
where:
dp
λ
θ
n1
n2
=
=
=
=
=
Depth of penetration
Wavelength of light
Angle of incidence of the IR beam
Refractive index of the crystal
Refractive index of the sample
PN 350-0201900-00
P a g e | 12
Precautions
SAFETY
Caution should be used when handling and using ATR crystals since some of the materials can be
hazardous. Specifically, zinc selenide is a heavy metal material and should be handled with this in mind.
If the crystal is broken or pulverized, the dust may be harmful by inhalation, ingestion or skin
absorption.
DO NOT exceed 2000 psi pressure in the cell while operating or flowing samples. This cell has not been
tested for small leaks at high pressure. If you are considering running dangerous or toxic samples
through the cell at high pressure, contact PIKE Technologies to discuss application and possible safety
testing.
Mirrors
In order to provide the maximum transmission in the infrared and allow for the custom shape that
maximizes performance, the mirrors are made of bare polished aluminum. The polished surface of the
aluminum is soft, and care must be taken to avoid damage. Normally, these mirrors will not need
cleaning, since they are contained within the housing of the accessory. If they do need cleaning,
blowing off the surface with clean, pressurized air is the best method.
Under no circumstances must the mirrors be rubbed with paper products such as "Kleenex" since this
will produce scratching of the mirror.
Crystal Care
Zinc Selenide
ZnSe is a rigid, hard crystalline material is superior. Although a general-purpose material, it has limited
use with strong acids and alkalies. The surface becomes etched during prolonged exposure to extremes
of pH (the acceptable pH range is 5-9).
Note: Complexing agents, such as ammonia and EDTA, will also erode its surface because of the
formation of complexes.
Germanium
Germanium (Ge) has been used extensively in the past as a higher refractive index material for samples
that have a high refractive index, such as carbon filled samples. The down side of using Ge is the high
refractive index produces a relatively weaker spectral absorbance compared to ZnSe.
PN 350-0201900-00
P a g e | 13
6125 Cottonwood Drive · Madison, WI 53719-5120 · (608) 274-2721 (TEL) · (608) 274-0103 (FAX)
[email protected] · www.piketech.com