1
Chapter 1: Memory Analysis Demos
LeakExample Tutorial
21
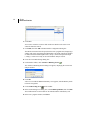
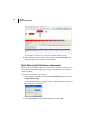
JProbe disconnects from the running session. After a few seconds, the Instances
view appears, displaying instances that were created during the use case.
Step 3: Identifying Loitering Objects
In this step, you look for loitering objects in the heap. Based on the hypothesis, you
should expect the count change for the JButton class to be zero, because you
removed all the buttons you added. In fact, the buttons are not removed and continue to
loiter in the heap.
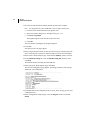
To identify loitering objects:
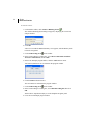
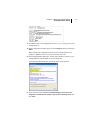
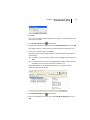
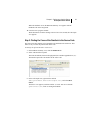
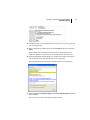
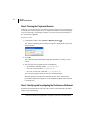
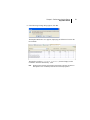
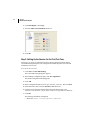
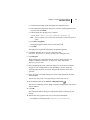
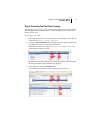
1 In the Instances view, select Heap Count from the Investigate by list.
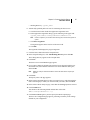
2 Type JButton in the Filter Classes field and press Enter to locate the JButton
class.
Note
This field is case-sensitive.
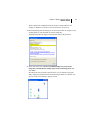
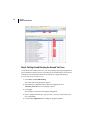
The Instances list now displays only the JButton class.
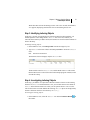
The Recorded Count for JButton is 10, and the Dead Count is 0. This means
that the buttons were removed from the Leak Example program window, but not
from the Java heap.
Step 4: Investigating Loitering Objects
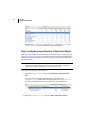
In this step, you find the live object that continues to hold a reference to the loitering
instances of JButton. From the Instances view, you can drill down to more detail on
JButton in the Instance Detail view. Then you can open the Source view to see the
code for the loiterer. You will find that the loitering JButton objects are being held by
obsolete collection references from the array JButton[].
To investigate loitering objects:
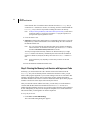
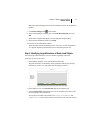
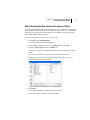
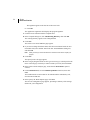
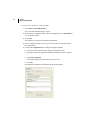
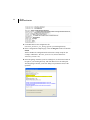
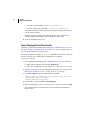
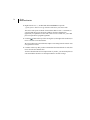
1 In the Instances view, select the JButton row and click Instance Detail
the toolbar.
on