Download 
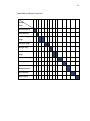
geotravel: harvesting ambient geographic footprints from gps

Transcript
GEOTRAVEL: HARVESTING AMBIENT GEOGRAPHIC
FOOTPRINTS FROM GPS TRAJECTORIES
LIEW LI CHING
GOH ONG SING
FACULTY OF INFORMATION AND COMMUNICATION TECHNOLOGY
UNIVERSITI TEKNIKAL MALAYSIA MELAKA
2014
ABSTRACT
The study is about harvesting point of interest from GPS trajectories.
Trajectories are the paths that moving objects move by follow through space in a
function of time while GPS trajectories generally are point-sequences with geographic
coordinates, time stamp, speed and heading. User can get information from GPS
enable device. For example, user can acquire present location, search the information
around them and design driving routes to a destination and thus design travel itineraries.
By sharing GPS logs among each other, people are able to find some places that attract
them from other people’s travel route. Analysis on the GPS logs can get the point of
interest that is popular. By present the point of interest, user can choose travel place
easily and the travel itineraries is plan based on the user preferences.
TABLE OF CONTENTS
CHAPTER
SUBJECT
PAGE
DECLARATION
Error! Bookmark not defined.
DEDICATION
Error! Bookmark not defined.
ACKNOWLEDGEMENTS
Error! Bookmark not defined.
ABSTRACT
CHAPTER 1
TABLE OF CONTENTS
iii
LIST OF TABLES
vii
LIST OF FIGURE
viii
LIST OF ABBREVIATIONS
x
LIST OF ATTACHMENT
xi
INTRODUCTION
1.1 Project Background
CHAPTER II
i
1
1.2 Problem Statements
2
1.3 Objective
4
1.4 Scopes
5
1.5 Project significance
6
1.6 Expected output
7
1.7 Conclusion
7
LITERATURE REVIEW AND PROJECT
METHODOLOGY
2.1 Introduction
2.2 Facts and findings (based on topic)
2.2.1 Domain
9
10
12
2.2.2 Existing System
13
2.2.3 Technique
18
2.3 Project Methodology
19
2.4 Project Requirements
21
2.4.1 Software Requirement
21
2.4.2 Hardware Requirement
22
2.4.3 Other requirements
22
2.5 Project Schedule and Milestones
22
2.6 Conclusion
23
CHAPTER III ANALYSIS
3.1 Introduction
24
3.2 Problem analysis
25
3.3 Requirement analysis
27
3.3.1 Data Requirement
27
3.3.2 Functional Requirement
27
3.3.3 Non-functional Requirement
29
3.3.4 Others Requirement
31
3.3.5 Use Case
32
3.3.5.1 Search Location
32
3.3.5.2 Display Detail of POI
32
3.3.5.3 Display the distance and duration
between two point
33
3.4 Conclusion
34
CHAPTER IV DESIGN/THE PROPOSED TECHNIQUE
4.1 Introduction
35
4.2 High-Level Design
35
4.2.1 Software Architecture
36
4.2.2 Quality Requirements
36
4.2.3 System Architecture
37
4.2.2 User Interface Design
39
4.2.2.1 Input Design
43
4.2.2.2 Output Design
43
4.2.3 Database Design
4.2.3.1 Conceptual and Logical Database
Design
4.3 Detailed Design
43
44
45
4.3.1 System Specification
45
4.4 Technique Propose
4.4.1 Data Collection
46
4.4.2 Pre-processing
46
4.4.3 Stay Point Detection
46
4.4.4 Mining of Stay Point
47
4.4 Conclusion
CHAPTER V
46
48
IMPLEMENTATION
5.1 Introduction
49
5.2 Software or Hardware Development Environment
50
5.2.1 Java Environment Setup
50
5.2.2 Web Application Server
51
5.2.3 Software Development Tools Setup
51
5.2.3.1 Eclipse IDE
51
5.2.3.2 Android Development Tools (ADT)
52
5.3 Software Configuration Management
CHAPTER VI
53
5.3.1 Configuration Environment Setup
53
5.3.2 Version Control Procedure
54
5.3.2.1 Access Right
54
5.3.2.2 Backup Management
54
5.4 Implementation Status
55
5.5 Conclusion
56
TESTING / EXPERIMENTAL RESULTS AND
ANALYSIS
6.1 Introduction
57
6.2 Test Plan
58
6.2.1 Test Organization
58
6.2.1.1 Integration Test Plan
58
6.2.1.2 Unit Test Plan
61
6.2.2 Test Environment
62
6.2.3 Test Schedule
62
6.3 Test Strategy
63
6.4 Test Implementation
63
6.5 Data Analysis
64
6.5.1 Experimental / Test Description
64
6.4.2 Data
65
6.5 Test Results and Analysis
67
6.6 Conclusion
69
CHAPTER VII PROJECT CONCLUSION
7.1 Introduction
75
7.1 Observation on Weaknesses and Strengths
76
7.1.1 Strengths in GeoTravel System
76
7.1.2 Weakness in GeoTravel System
76
7.2 Propositions for Improvement
77
7.3 Contribution
77
7.4 Conclusion
78
REFERENCES
79
APPENDIX
80
LIST OF TABLES
TABLE
Table 2.1
Table 2.2
Table 2.3
Table 3.1
Table 3.2
Table 3.3
Table 3.4
Table 3.5
Table 3.6
Table 3.7
Table 4.1
Table 4.2
Table 5.1
Table 5.2
Table 5.3
Table 5.4
Table 5.5
Table 5.6
Table 6.1
Table 6.2
Table 6.3
Table 6.4
Table 6.5
TITLE
Software Requirement
Hardware Requirement
Other Requirements
Function Requirements
Non-functional Requirements
Software Requirement
Hardware Requirement
Search Location Use case
Display Detail Use Case
Display distance Use Case
GeoTravel Application's Quality Requirements
System Specification
Environment Setup
Version Control
Configuration Access Right
Backup Management
Analysis Status
Implementation Status
Integration Test Report
Unit Test Plan
Test Schedule
Sample Data
Result
PAGE
21
22
22
28
29
31
31
32
32
33
36
45
53
54
54
54
55
55
61
61
62
65
69
LIST OF FIGURE
DIAGRAM
Figure 2.1
Figure 2.2
Figure 2.3
Figure 2.4
Figure 2.5
Figure 2.6
Figure 2.7
Figure 2.8
Figure 2.9
Figure 2.10
Figure 2.11
Figure 2.12
Figure 4.1
Figure 4.2
Figure 4.3
Figure 4.4
Figure 4.5
Figure 4.6
Figure 4.7
Figure 4.8
Figure 4.9
Figure 4.10
Figure 4.11
Figure 4.12
Figure 6.1
Figure 6.2
Figure 6.3
Figure 6.4
Figure 6.5
TITLE
GeoLife Application
Searching Trajectories
GPS Trajectories data
Trip Planner
Main Menu
Point of interest
Location by map
Nearby Attraction
Itinerary
Tripomatic Application
Chose city to travel
Agile Development
3-tier Architecture
Flow Chart
Screen Design for the web
Screen Design for Main Menu
Screen Design for Menu List
Screen Design for Point of Interest
Screen Design for Traffic Analysis
Screen Design for Detail
Screen Design for the description of POI
Screen Design for Distance and Duration
ERD Design
Harversine' Formula
Interface among Module
GPS trajectories
Density based Clustering
Point of interest
Search Location
PAGE
14
14
14
16
16
16
16
16
16
18
18
20
37
38
39
40
40
41
41
42
42
43
44
47
60
68
68
70
71
Figure 6.6
Figure 6.7
Figure 6.8
Figure 6.9
Figure 6.10
Place of Interest
Traffic Analysis
Description of POI
Detail of POI
Distance and Duration
71
72
73
73
74
LIST OF ABBREVIATIONS
ADT
–
Android Development Tools
API
–
Application Programming Interface
APK
–
Android Application Package File
DFD
–
Data Flow Diagram
GPS
–
Global Positioning System
IDE
–
Integrated Development Environment
JDK
–
Java Development Kit
JDT
–
Java Development Tools
MB
–
Megabytes
OS
–
Operating System
POI
–
Point of Interest
SDK
–
Software Development Kit
SDT
–
Software Development Team
UI
–
User Interface
UML
–
Unified Modelling Language
XML
–
Extensible Markup Laguage
LIST OF ATTACHMENT
APPENDIX
TITLE
APPENDIX 1
APPENDIX 2
Flow Chart and Grantt Chart
User Manual
PAGE
80
83
1
CHAPTER 1
INTRODUCTION
1.1 Project Background
Smartphones nowadays are integrated with advanced technology that make
smartphone is not a wanted item but is a needed item. Smartphone make people life
more convenient and easy, everything become simple once you own a smartphone.
People can use smartphone to surf internet, pay bill, e-learning and many thing else.
One of the important thing that can be done by smartphone is smartphone can act as a
GPS (Global Positioning System) device. A lots of GPS navigator software are
available in the market. The GPS navigator navigate the route from one place to
another place. The shortcoming of the GPS navigator software is the user do not know
how other people travel or what is the suggested route. People may want to know how
other people travel and where is the interesting place.
Trajectory mean path of moving object that follows through space as a function
of time while GPS trajectories is the point sequences with geographic coordinate
which someone had travel along. GPS device is one of the examples of locationacquisition technologies. By using GPS device, people will be able to record their
journey or location history with a sequence of time-stamped. From other people GPS
trajectories, someone can know life interests and preferences of that user, thus
facilated people to do things. Trajectories can link peopele in the phiysical world by
location.
2
Personal GPS tracking trajectories generally are point-sequences with
geographic coordinates, time stamp, speed and heading. Automatic recorded GPS
travel data can not only reduce the burden of persons who participant in travel survey,
but also provided detailed and accurate information in time, geo-locations and route
choices. However, several data processing steps are required to explore knowledge
hidden in raw GPS trajectories. One of these procedures is Activity Identification
which aims at discovering activities in trajectories since travel purposes are obviously
not included in GPS traces. And as the volume of historic data keep increasing,
completely computer aided methods are need.
By analysis on GPS trajectory, people city travel sequence can be known. This
is different from the traditional travel data. The raw GPS trajectories do not contain
information about trip purpose or activity, it just include GPS coordinate and time.
Earlier studies addressed this issue through a combination of manual and computerassisted data processing steps. Nevertheless, geographic context databases provide the
possibility for automatic activity identification based on GPS trajectories since each
activity is uniquely defined by a set of features such as location and duration.
Increasing in the usage of GPS capabilities device, positions of mobile objects can be
detected.
GeoTravel in harvesting ambient geographic footprints from GPS trajectories
project is about analysis GPS trajectories form various user and getting the POI (point
of interest) of the users. Stay point is detected from the GPS trajectories and the result
is clustered by density based clustering (OPTICST). GeoTravel application can detect
the location of the user automatically and therefore can give some suggestion on
interesting locations. Classical travel sequences by the users can be known by GPS
trajectories. This will help people who wish to plan travelling trip by themselves.
In conclusion, the dataset of GPS trajectories will be first collected and follow
by analyzed. From the analysis, we will get the top interesting location (point of
interest) and travel sequence among location. From that, we can transfer the point of
interest into customize itinerary which will generates multiday itineraries for the users.
1.2 Problem Statements
3
Here discuss with the problem statements that happen in the real life scenarios that
proves the need of building a GeoTravel application to make the trip planning
easier.
i.
Users need a system that can auto detect their location
The users need to enter the location in order to search the interesting place
in some of the system/apps. It is time wasted and complicated if the users
want to search the place of interest which is nearby them.
ii.
Users need effective system that can suggest the place of interest and
live event
Most of the traveling planner application do not include live event. The live
event that held in a place is important for a travelers because some of the
traveler especially backpacker may want to join local event to gain more
experience.
iii.
Users especially backpacker need an efficient and economic trip plan
application
Creating and efficient and economic trip plan is the most annoying job for
a backpacker traveler. Although travel agency can provide some predefined
itineraries, they are not tailored for each specific customer.
iv.
Users or travelers need a system that can generates multiday
itineraries
In most of the existing itineraries planning system, it only provides single
day itineraries but in the real world, most of the people will travel in one
place more than one day. Therefore, travelers need a system that can help
them plan a multiday trip.
v.
A traveler used application could be better
4
There are similar applications for travelers use is published in Play Store.
However, that is still not good enough for travelers. It should be more userfriendly and cover more things about the point of interest of the place.
1.3 Objective
The problem stated perhaps can be solved by developing this application for
travelers. Here states with the objectives of building this application.
i.
To access user location by IP address and GPS trajectories
The system should be able to get the users/travelers location automatically
so that it can suggest the place of interests to the users based on the location.
This will save the time of the user on insert the location manually.
ii.
To understand GPS trajectories
Study and understand GPS trajectories from previous travelers not only can
know the life interests and preferences of the traveler, it also facilitated
people to do many things. From the GPS trajectories, we can suggest the
traveler the common travel plan and include live event in the place of
interests list.
iii.
To build an efficient and economic trip plan application
Analysis the data of GPS trajectories will give popular places that traveled
by most travelers. Recommendation is made based on the analysis result.
User can plan their trip base on the recommendation.
iv.
To build a system that can generate multiday itineraries
In most of the existing application, it only provides single day itineraries.
This application can generate multiday itineraries with no repeat of place
5
of interest. This helps most of the users because normally a trip would not
be only one day.
v.
To build a user friendly and high effective application for traveler use
This application will focus on graphical presentation. That is, interesting
icons and colourful features are introduced in the application to attract
users’ eyesight. Other than just plan the itineraries of the trip, this
application also give recommendation on the traffic.
1.4 Scopes
i.
User
The system is mainly developed for the users such as below:

Backpacker
They are one of the main end-users of this application which the
function of the system is built especially for their usage. They can
plan their multiday itineraries based on the point of interests that
provided by this application. Besides that, they also can include the
live events that occur at that time into their trip. This application
will calculate the shortest path to use for the users.

Local Traveler
Local traveler is the people that wish to travel in his own place.
Usually local people aim is to find the live event or restaurant in the
town. This application provide point of interests include restaurant
and live event for the user to choose. This application will plan the
itineraries based on the user selection, therefore different user
preferences will not affect other.
ii.
Platform

Web-based
6
This system is a web-based system. User can surf the website by
internet browser. Every information can be look through the web
site. User can plan their trip by using web system.

Android
In order to simplify the system, android application is built. This
android application can run on all android base smart-phone. Other
platform such as Mac OS is not available for this moment.
1.5 Project significance
GeoTravel Application is built to improve the efficiency for travelers
especially backpackers to plan their multiday itineraries. The point of interests that
suggest to the user is based on other people trajectories history. This application
provide several features like

Get the users location

Get the users GPS trajectories

Analysis the GPS trajectories from other travelers

Suggest point of interest and live events

Perform multiday itineraries based on the user preference

Suggest the best route for the user

Advice user on the traffic

Cost estimation
GeoTravel Application used a useful method to analyze the GPS trajectories
from other traveler. It will give the result of the top interesting location and common
travel sequence among location. It is easy to plan your own trip with this system. User
only needs to select the point of interest that wish to travel and the system will
automatic give the itineraries as the result.
The most beneficial people of this system are the backpackers. By this system,
travelers can choose its own packages that suit them. Although the travel agencies may
provide efficient and convenient services, for some travelers or backpackers, the
7
itineraries provided by the travel agents lack customization and cannot satisfy
individual requirement. Some interested point of interest even missing in the itineraries
and the package are too expensive for a backpack traveler. Therefore, this system
provide an alternative way for them to plan their trips in every detail, such as picking
point of interest for visiting and selecting the hotels.
1.6 Expected output
A better efficiency and user friendly android mobile application that provide
the features that help the backpacker to plan their trip. The application will auto detect
the location of the user and direct to the point of interests in that location. The point of
interest is suggested based on the result from other user GPS trajectories. It also
includes the live events in the point of interest that help the user which are not from
that place. This application is a multiday itineraries planning instead of single day.
There is a limit hour to travel in each day. In order to make the system more complete,
suggestion of hotel is makes in multiday itineraries. This system is built to overcome
the weakness form the other published travel use application that is available in Play
Store.
1.7 Conclusion
The project background is discussed in this chapter, thus detect the problems
faced by the current situation of the travelers. Objective and scope of this project is
determined to emphasize the need to build up a system like GeoTravel application so
that the problem can be overcome and improve the system to be better.
The systems will first analysis the data from the previous traveler and make a
conclusion of the point of interests. User can choose their own point of interest and the
system will generate itineraries based on their preference point of interest. The system
not only can generate single day itineraries, it also can generate multiday itineraries.
8
For the next chapter, the literature review and project methodology will be
discussed. It also describes more details about the differentiation between existing
application and GeoTravel system. Besides that, next chapter also include the
requirement to build this application, the project schedule and milestone.
9
CHAPTER II
LITERATURE REVIEW AND PROJECT METHODOLOGY
2.1 Introduction
This chapter explains about literature review conducted and methodology that
is used to develop GeoTravel Application.
According to the Literature review is about discusses published information in
a particular subject area or topic. It may just a simple summary which is a recap of the
important information of the sources or combines both summary and synthesis.
Synthesis is a re-organization and reshuffling, of the information. It may give a new
interpretation l or combine new interpretation with old one. Besides that, synthesis
might trace the intellectual progression of certain field which includes major debates.
Furthermore, the literature review may evaluate the source and advise the reader on
the most pertinent or relevant”.
According to A. Stefanidis (2012), “the using of the location-acquisition
technologies like GPS device, people are able to record their trajectories which are
their location history in a sequence of time-stamped. These trajectories have facilitated
people to do many things based on users’ life interests and preferences, and. Therefore,
by using these trajectories, we not only connect locations in the physical world but
also bridge the gap between users and locations.”
10
According to Y. Zheng, “In the real world, traveler leave their location history
in a form of trajectories. Based on GPS trajectories, people can share their life
experience and generic travel recommendation.
“Personal GPS tracking trajectories generally are point-sequences with
geographic coordinates, time stamp, speed and heading. Automatic recorded GPS
travel data can not only reduce the burden of persons who participant in travel survey,
but also provided detailed and accurate information in time, geo-locations and route
choices. However, several data processing steps are required to explore knowledge
hidden in raw GPS trajectories. One of these procedures is Activity Identification
which aims at discovering activities in trajectories since travel purposes is obviously
not included in GPS traces. And as the volume of historic data keep increasing,
completely computer aided methods are need”, said by L.Huang (2010).
In brief, there are many methodologies are applicable in software management
project, such as Waterfall model, agile management, Spiral model and also Rational
Unified Process (RUP). The size, composition, priorities, criticality and skills that are
different in each project are always the factor to be concerned about while selecting a
methodology. An appropriate methodology would optimize the project management
process by introducing a framework that may reduce the risk level. Hence, the
methodology that is used to develop GeoTravel Application will introduced in this
chapter as it does play the main key in ensuring the success of this project
development.
2.2 Facts and findings (based on topic)
A practical solution for the trip planner application is to provide an automatic
itinerary planning service. The user lists a set of interested point of interests (POIs)
and specifies the time and money budget. The itinerary planning service is then returns
top-K trip plans satisfying the requirements. In the ideal case, the user selects one of
the returned itineraries as his plan and notifies the agent. There are a lot of algorithms
for automatic itinerary planning service. However, only few of the current itinerary
11
planning can generate a ready-to-use trip plan, as they are based on various
assumptions. The one that can generate a ready-to-use trip plan is not based on the
GPS trajectories of the previous travelers.
With GPS device like GPS phones have become popular in modern life. People
always used GPS device during travelling. Hence, a lot of GPS log data which include
GPS trajectories have been accumulated both continuously and unobtrusively. There
is many new generate application regarding GPS currently due to the increasing of the
usage of GPS device which collect GPS data based on real world. Users are allowed
to view, upload and share GPS tracks logs. Multimedia content in the application or
web also attract people to use the device.
GPS trajectories contain information about the travel sequence of the users. By
analysis on GPS trajectories, travel recommendation can be generic. This can be done
by mining the data based on GPS trajectories. Based on the result, interesting location
and classical travel sequence can be detected in a given place. The interesting location
or point of interest in here include culturally place like museum, events and common
frequented public area such as restaurant.
Current planning algorithm of the trip planner normally only consider a single
day’s trip, while in real cases, most users will schedule an n-day itinerary. Generating
an n-day itinerary is more complex than generating a single day one because it is not
just combining the single day itinerary to become n-day itinerary. This is because point
of interest can only appear once in the itinerary. One of the possible solutions is to
exploit the geolocation (put the nearby POIs in the same day’s itinerary). Besides that,
we can also rank POIs by using a priority queue base on their importance to schedule
the trip.
Novel itinerary planning algorithm is used to generate itineraries that narrow
the gap between the agents and travelers. This algorithm reduces the overhead of
constructing a personalized itinerary for the traveler and also provides a tool for the
agents to customize their service.
Besides that, smartphone tend to become necessary item in our daily life.
Number of mobile application in the market keep on increasing, therefore choosing a
mobile platform become an issue for developer. There are few platforms which are
12
quite popular in the market nowadays. These platforms include iOS, Android, Lumnia,
Symbian and Bada. Among all these, iOS and Android always bear to mind first than
others. iOS is mobile operating system of Apple Inc. while Android is introduced by
Google Inc.. Bother operating systems provide high user-friendly, well designed and
also high efficiency. For this project, Android will be chosen because it is an opensource development environment. Meanwhile, its functionality and power is almost
same to iOS.
2.2.1 Domain

GPS Trajectories
There is a branch of GPS trajectories related application available on the
market or internet. By using those applications by GPS device, people can
record or view their travel routes. Users can also share their travel experiences
by upload their GPS trajectories to the web or application. Previously, people
shared their experience in text-based article or blog. GPS trajectories
applications give an alternative method that is more interactive than the
previous one. This method helps users with valuable references when planning
a travel itinerary.

Web-based system
Web-based system can be done by using many web languages such as PHP and
java script. In this system, the language use is PHP. User can browse through
the web site by any browser. Point of interest and event can be seeing through
the web. User can also plan their trip by using the web based system.

Android
Android is an open platform that had become famous recently. It drives
innovation in mobile communications and beyond. Android application is easy
to be built because it is an open source application such as Linux community
and other hardware, software and carrier partners. Due to android is an open
source application, it has rapidly grow and become a famous platform to be
used recently. People are able to develop any android application by various
13
platforms since it was an open platform. Developer can published their
application through open marketplace.

Android Application
The simple software that is built to be run on the Android platform such as in
smartphone or tablet which provide entertainments, tools and also platform for
internet browsing. Most of the applications can be found in Google Play
Market and download for free or either with charge.

Android API Level
Android API Level is an integer value that uniquely identifies the framework.
The API revision is offered by a version of the Android platform. The
framework API consists of:
-
A core set of packages and classes
-
A set of XML elements and attributes for declaring a manifest file
-
A set of XML elements and attributes for declaring and accessing resources
-
A set of Intents
-
A set of permission that application can request, as well as permission
enforcements included in the system
-
Each successive version of the Android platform can include updated to the
Android application framework API that it delivers.
2.2.2 Existing System
There are some travel use applications that exists in the market. In this topic, 3 selected
applications or algorithm used are discussed here.
i.
GeoLife
In GeoLife application, GPS data are collected through a device. Those
data are real data and are well managed. The result is easy understood as
compared to current technologies. Visualizing GPS data over digital maps
and display result make this application interactive. Besides that, this
application suggests the point of interest based on the user behavior or
14
travel history. Searching function is also available in this application. The
GPS trajectories show the search result over digital maps by using spatial
range or a temporal interval as query. By these, people can understand other
peoples’ travel sequence or live pattern from their GPS trajectories.
This application is quite functional in the GPS trajectories field but not
in trip planner application. This application only gets the raw GPS
trajectories and does analysis from the GPS trajectories. The result get from
the analysis is then transforms into point of interests. From there we can
know classic routes, popular travel routes and point of interest. The
shortage of this application is users cannot customize the place that they
want to go, they just can read the history of GPS trajectories from the past.
Figure 2.1: GeoLife Application
Figure 2.2: Searching
Trajectories
Figure 2.3: GPS Trajectories data
ii.
Trip Planner
Tourism Malaysia had launched a travel application which is Trip
Planner application. With this application, panning a memorable holiday
15
becomes simple and interesting. These applications describe the points of
interest and show the unique attractions around Malaysia. Besides that, this
application also highlights special event or cultural festival in different
time. By using this application, users can add items to their itinerary, save
them and share with their social networks.
This application show few point of interests in Malaysia. User can
choose which point of interest mainly cities to explore and add in their
itinerary. After user has chosen, the information about that point of interest
is shown and some nearby attraction is shown in the map. User can know
more information about that point of interest via this application.
Although this application provide a lot of information about the point
of interest but the point of interest of this application is lesser if compare to
other application. Besides that, this application does not suggest the route
and plan the itinerary for the user. This application does not help to user to
plan their trip by which point of interest the user can go in one day. This
application only shows the location of the point of interest on the map and
the users need to find it by their own.
Although this application is official travel application, but it lack of live
event that occur on certain date. Many tourists may need to want to join the
live event on the city to gain more experience of the city. This application
should show how to get to the certain point of interest by GPS navigator
because travelers may need to know how to go from one place to another
place.
16
iii.
Figure 2.4: Trip Planner
Figure 2. 5: Main Menu
Figure 2.6: Point of interest
Figure 2.7: Location by map
Figure 2.8: Nearby Attraction
Figure 2.9: Itinerary
Tripomatic
17
Tripomation application is an international application. It shows the
point of interest along the world. This application is type of sightseeing
travel guide. It Discover thousands of attractions in 400+ destinations
worldwide. Users can plan trip itineraries either one day trip or multiple
days by this application. All information is automatically synced to
www.tripomatic.com so that users can edit on the web without using the
device. Besides that, offline maps are also available.
The unique or advantage of Tripomatic's application is that the
information or trip planning are sync up with a web-based itineraryplanning service. Users can know the point of interest when travel to other
place or country. This application contains the information of different
fields. This gives freedom to the traveler or blacker to explore while on
vacation.
Users can user Tripomatic application to can make personal travel
itinerary by choosing the destination and pick sights the point of interest
which their wish to visit or interesting to them.
By using this application, user can:
-
Find nearby point of interest or attraction
-
Get the details of point of interest include contacts, business
hours and admission fees
-
Get personal travel itineraries plan
-
Plan trip by using phone
-
Edit trip by using web
-
Get offline map
-
Included more 40000 attractions worldwide
This application gives an alternative choice for the trip planner. The
shortage of this application is it is a worldwide application therefore it only
contain point of interest that from the main city. If the traveler wish to travel
in small town of certain country, the information that provide by this
18
application may not sufficient. The lacks of information of local event also
make this system not a perfect application.
Figure 2.10: Tripomatic Application
Figure 2.11: Chose city to travel
2.2.3 Technique
Online research and analysis of algorithm is done to collect the algorithm that
suitable for the system. After study about few algorithms, one of the most suitable
algorithms is chose to implements in the system. Analyses the weakness and strengths
of the other algorithms will help to build up a better algorithm by improve it.
19
Online research is also done to collect information about Android application
development. Study on gaining user experience in order to achieve higher degree of
user friendliness and usability is done too by using other existing traveler use
applications that are published on the Play Market. Analyses the weakness and
strengths of the other application will help to build up a better software application
product by improve it.
2.3 Project Methodology
Methodology is the systematic and theoretical analysis of the methods which
applied to a field or study. In this project, methodology is used to gather relevant data
about GPS trajectories from specified documents. The data is then analyzed and the
result is discussed. Databases are compiled by using the point of interest from the
analysis process. By undergo all these project will improve understanding about GPS
trajectories. This project will utilize both quantitative and qualitative data collection
tools, but is rooted in a qualitative epistemological position that recognizes the
importance of locating the research within a particular social, cultural, and historical
context. It also takes seriously the social construction of these contexts and the
identities participants construct within them.
Agile methodology is used in this project development. Agile methodology is
an incremental, repetitious means of managing projects particularly in the field of
software development. It was built upon the foundations of the traditional waterfall
sequential methods of the 1970’s. In the late 1970’s and throughout the 1980’s,
Japanese companies began using phased program planning in new product
development where each phase of the project is continue to be revisited throughout the
project until the project reach the final phase in a short duration. This led to just-intime manufacturing and eventually becomes agile software development
Agile software development methodology is divided into two which is XP and
Serum. XP stands for extreme programming and it concentrates on the development
20
rather than managerial aspects of software projects. XP development starts with release
planning phase, followed by several iterations which concludes with user acceptance
testing. This project is more to XP style of agile development where the development
phase is concerned more. Refer figure 2.12 for the more detail.
Figure 2.12: Agile Development
This type of methodology introduces a set of XP rules and concepts, which is
integrate often, project velocity, pair programming and user story. Integrate often is
also called as continuous integration. The changes in continuous integration must be
integrated into the development baseline frequently. Besides, project velocity is
important in every development. Project velocity measures the work along the project
development. This process makes sure the product can be delivery on date by drives a
proper planning and gets the schedule updated. Pair Programming is where two people
working together in a single computer in production of code in order to achieve higher
21
quality of user satisfaction. Gather user story also important because that describes the
problems faced by them and need to be solved by the system being built. This story is
written by user and should be about three sentences long. One of the strengths of XP
development is able to figure out what the user is not clear about the criteria of the
system to be built.
In the first stage of the system, users’ stories which describe the need of the
software are collected. The system should fulfill the user stories. After this process,
the time to build and the resources needed to build the system is estimated. By using
the information, a release plan is created and the development tasks are divided into
iterations. The release plan defines each iteration plan in order to drives for the iteration.
After test case being done by the developer, the user performs acceptance tests based
on the user stories. If the users accept the system, the system is released else, the system
being modified to fulfill the needs of the users. If the is bug in the system, then bug
fixing is the next iterantion.
2.4 Project Requirements
Here introduce with the project requirement. There are software requirement
and hardware requirement in this part. Software requirement is the software that
needed to build the system while hardware requirement is hardware that necessary for
the development of system.
2.4.1 Software Requirement
Refer table 2.1 for descriptions of software requirement in this project.
Table 2.1: Software Requirement
Item
Description
22
Microsoft Windows 7
Operating system from Microsoft
Google Chrome/Mozilla Firefox
Web Browser
WordPress
Website creator
Eclipse Kepler
IDE for Android and Java development
Android SDK 2.2/4.4
Android software development toolkits
Star UML
Unified Modeling language tool
Microsoft Visio
Flow Chart software
Microsoft Words 2010
Project documentation editor
2.4.2 Hardware Requirement
Refer table 2.2 for hardware requirement in this project.
Table 2.2: Hardware Requirement
Suggested Configuration
Minimum Configuration
4GB RAM
1GB RAM
Keyboard and Mouse
Any Keyboard and Mouse
Network Card
Any Network Card
Android Phone with KitKat
Android Phone with Froyo
2.4.3 Other requirements
Refer table 2.3 for other requirement in this project.
Table 2.3: Other Requirements
Suggested Configuration
Minimum Configuration
Android Supported Virtual machine
Any Android Supported Virtual machine
2.5 Project Schedule and Milestones
23
Project schedule and milestones describes the action that need to be done
throughout the whole project development. For every single project that in
development process, conducting a project schedule and milestone are important. Both
of them are useful in guiding the project flow so that the system/application can be
delivered on time. In the project schedule, action is decomposed into every single task
and the time frame is provided. Usually extra time is added in the project schedule.
The developer must finished the task on time so that in won’t affect the whole process.
In this project, Grantt Chart is used to represent the project schedule and
milestone. Tasks distribution with the timeline is schedule. Refer Appendix 1 for the
Grantt Chart and Flow Chart.
2.6 Conclusion
In this chapter, literature review and methodology is done. Literature review is
the summary of the research after exploration of a topic. It is crucial to study the current
trend of existing product in the market to build an effective and higher quality of
software product. On the hand, methodology consist the method to use throughout the
whole project. A proper software development methodology will result to the
successful in development process. This can be done by offering the best suit
development framework for the development of the application. The listed project
requirements do also give a basic overview on what are used to develop this project.
In next chapter, requirement analysis which describe both functional and nonfunctional requirement will be discussed. Those requirements will be show through
diagrams and the system flow also will be explained later.
24
CHAPTER III
ANALYSIS
3.1 Introduction
In this chapter the requirements of the system is discussed. This includes the
problem analysis which defines the requirements of the system, independent of how
those requirements will be accomplished. This chapter includes requirement analysis
which will be discussed later. In requirement analysis, module and function about this
GeoTravel Application will be discussed.
Analysis represent the ‘what phase’. In this phase, the problem that faced by
the customer is define. Developer trying to solve their problems by developed a system.
Deliverable result which is a requirement document is included. This document is
needed at the end of this project to check whether the system meet the requirement that
had set. In this document, it state clearly and precise the procedure and what to be built
for the system. Requirement from the customer is captures and define the goals and
interaction.
In this chapter, analysis phase start with problem analysis. Problem analysis
phase normally describe the current system and follow by analysis the possible steps
to improve the application. In this case, as far as I know, there is no similar system
being developed so the real life scenarios of traveler become a way to analysis the
traveler itineraries planning and turn it into business requirements of this application.
25
Besides that, functional requirement of this application in solving current
problems will be discuss later. The non-functional requirements are explained too as
the consideration of software quality issues. Other requirement such as software and
hardware requirement which have been discussed in Chapter 2 also will further discuss
in this chapter.
3.2 Problem analysis
As far as I aware, there is no similar automation travel system is being
developed. Therefore, the real life scenarios will be discussed on finding the problems
of current situation. In this project, how the travelers plan their itineraries will be the
main consideration.
Traveling market is divided into two parts, casual customers and backpackers.
For casual customers, normally they will pick a package from local travel agents. The
package that provide by the travel agents usually is a pre-generated itinerary. The
agency will provide all service in the trip such as book hotels, transportation and
preorder the tickets. This prevents customers from constructing their personal itinerary
and this save a lot of time. The aim for the agency is the first time travelers. Therefore
the package provided by the agency normally just covers the most popular point of
interests.
The problem faced by the travelers is the itineraries provided by the travel
agents is lack customization and cannot satisfy individual requirements. Some of the
point of interest in a place is missing due to agency preference. Besides that, package
provided by the travel agents are too expensive for backpack travelers. Therefore,
backpackers need to plan their trips in every detail include selecting the hotel, picking
point of interests to visit, contacting the car rental service and so on.
In the real world, it is impossible for a travel agency to list all possible
itineraries for customers to customize their itineraries. Therefore, a practical solution
for this problem is to provide an automatic itinerary planning service. The user lists a
26
set of interested point of interest and specific the time and budget, the
service/application will returned itineraries to the user.
Algorithm that current use normally only consider a single’s day trip. This is
not a real case as in the real world most users will schedule multiday itineraries.
Generating multiday itineraries is more complex than generating single day itineraries
as in multiday itineraries, the point of interests cannot be repeated. To solve this, we
can rank point of interests by their importance and use priority queue form the
itineraries. Other than this, we also can exploit the geo-location by putting the point of
interests which are nearby in the same day’s itineraries.
Besides that, many travelers face the problem of provided point of interest is
not the place that they want. This happen because the travel agents always provide the
same set of trip plans, composed with point of interests but those point of interest may
not attractive for the travelers who have visited the place before. Therefore, in this
project, the selected point of interest is giving high priorities and generates the trip
plan based on the priorities.
Therefore, in this system a novel itinerary planning approach is used. This
method is to generate itineraries that narrow the gap between the agents and travelers.
Basically in the preprocessing, the distance of two point of interest are evaluated by
Google Map’s API. List of point of interest provided in the map GUI to let the user to
choose. The user can select preferred point of interest explicitly, while the rest points
are assumed to be the optional. Different ranking functions are applied to different type
of point of interest. The automatic itinerary planning service needs to return the
itinerary with the highest ranking. Searching the optimal itinerary can be transformed
into the team orienteering problem, which is an NP-complete problem without
polynomial approximation. Therefore, a two stage scheme is applied.
In the preprocessing stage, parallel processing framework, MapReduce is used
to iterate single-day itineraries. The results are maintained in the distributed file system
and an inverted index is built for efficient itinerary retrieval. To construct a multiday
itinerary, we need to selectively combine the single itineraries. The preprocessing
stage, in fact, transforms the team orienteering problem into a set-packing problem,
which has well known approximated algorithms. In the online stage, we design an
approximated algorithm. In the online stage, we design an approximate algorithm to
27
generate the optimal itineraries. The approximate algorithm adopts the initializationadjustment model and a theoretic bound is given for the quality of the approximate
result.
3.3 Requirement analysis
In this section, the behavior of the system is being capture. This include data
requirement, functional and non-functional requirements.
3.3.1 Data Requirement
In this project, database is used to store the data which needed for the system.
The tools that used to store database is MySQL. The object of this system is recognized
and the database is built based on the result. The objects of this system include
information about point of interest, user location, and user history. The data should be
gathered and well designed so that the system function well and integration between
each other will be in a good quality and consistent.
In this project, the data to be displayed may come from more than one table
which combined few tables in order to get the result. Some modules may not have its
own table of data but it used a certain primary key from a certain table to pass on to
the other modules. This make this application runs smooth when message passing.
3.3.2 Functional Requirement
GeoTravel Application may be decomposed into several important
components and each component interacts with each other to handle the data exchange
and manipulation. Each component here provides its unique functionality to the system
and may runs on different type of data from database.
28
These components can be called as sub-system and in this application they are
divided into few units table 3.1.
Table 3.1: Function Requirements
ID No.
Requirement
Description
GeoTravel_FR1_1
Detect user
The system should auto-detect the location of
location
GeoTravel_FR1_2
the user
The system should display the point of
interest based on the location of the user
GeoTravel_FR1_3
The system should notify user when there is
no internet connection
GeoTravel_FR2_1
Point of
The system should differentiate the point of
interest
interest. Examples of POI include historical
place, event and restaurant.
GeoTravel_FR2_2
The detail of the POI should be show to the
user when the user click the button
GeoTravel_FR2_3
The system should direct the user to the page
that describe the place when the user clicking
the location button
GeoTravel_FR2_4
The system should notify the user if the
process is failed
GeoTravel_FR3_1
Check the
The system should show the distance between
distance and
two point when the user click two point in the
the expected
map
time
GeoTravel_FR3_2
The duration to travel along the point of
interest should be display to the user
29
GeoTravel_FR3_3
The system should notify the user if the
process failed
GeoTravel_FR3_4
The nearest route should be recommended to
the users based on the point
3.3.3 Non-functional Requirement
System constraints and performance expected in real life scenario are
considered as a part of requirement to make sure the system to function as user expect
and perform well. It is important to stress out the non-functional requirement to make
sure the progress of functional business is being supported. The non-functional
requirements are stated in table 3.2.
Table 3.2: Non-functional Requirements
ID
Qualities
Description
GeoTravel_NFR1_1
Availability
The system should be available to use
most of the time. System operational
time should be high. The system should
also need to be available for service
when users request it.
GeoTravel_NFR1_1
Efficiency
The system should be efficient in
providing the point of interests of the
place and calculate the best route for
the users. The system should fully
utilize the resource such server cycle
and memory.
30
GeoTravel_NFR1_1
Flexibility
Flexibility specifies the expandability
of the functionality of the system after
it is deployed. The system should be
flexible
enough
to
extend
the
functionality after it is implemented.
GeoTravel_NFR1_1
Reliability
The system should be reliable and all
the components in the system should
work properly. The capability of the
software to maintain its performance
over time is calculated. The failure rate
of the system should be less than 1 over
100 requests.
GeoTravel_NFR1_1
Security
Security ensures the integrity of the
system from accidental or malicious
damage and prevents unauthorized
access to the system. The system
should
be
secure
from
any
unauthorized access as the information
of the users is confidentiality.
GeoTravel_NFR1_1
Platform
This system should be able to run on
Compatibility
any Android platform between API
level 8 (Froyo) to API level 19 (KitKat)
and with GPS location function in the
device.
GeoTravel_NFR1_1
Usability
The system should be easy to learned,
understood and use by the user. The
31
system should also develop based on
user requirement that is user-friendly.
3.3.4 Others Requirement

Software Requirement
Table 3.3: Software Requirement
Item
Description
Microsoft Windows 7
Operating system
Google Chrome/Mozilla Firefox
Web Browser
WordPress
Website creator
Eclipse Kepler
IDE for Android and Java development
Android SDK 2.2/4.4
Android software development toolkits
Star UML
Unified Modeling language tool
Microsoft Visio
Flow Chart software
Microsoft Words
Project documentation editor

Hardware Requirement
Table 3.4: Hardware Requirement
Suggested Configuration
Minimum Configuration
4GB RAM
1GB RAM
Keyboard and Mouse
Any Keyboard and Mouse
Network Card
Any Network Card
Android Phone with KitKat
Android Phone with Froyo
32
3.3.5 Use Case
3.3.5.1 Search Location
Table 3.5: Search Location Use case
Use Case Diagram
Search Location
Description
User can search location based on point of interest or
coordinate. The system will direct the map to the
place the user search.
The system’s point of interest table should have data
Preconditions
stored and not to be empty
Internet connection is require to direct the user to the
Constraints
location by showing in the map
- From main menu screen, user can choose either
Normal Operations
enter place or latitude with longitude
- If the place that key in by user is not in the
database, notification message will be display
to the user
- If the place or point of interest that enter by the
user is in the list, the system will show and
direct to the location by using map
- Next, user can see the point of interest around
that point
Processing Frequencies
None. User can search the location from everywhere
and any time they want
3.3.5.2 Display Detail of POI
Table 3.6: Display Detail Use Case
Use Case Diagram
Display Detail of the point of interest
Description
User can view the detail of the point of interest by
clicking the location icon in the system
Preconditions
The system’s point of interest table should have data
stored and not to be empty
33
Internet connection is require to direct the user to
Constraints
page that describe the detail of the point of interest
- From the map that show the POI, user can click
Normal Operations
the POI that interesting to them
- The system will direct to the page and the
details such as operation hour and admission
fee is displayed
- If the system cannot search the detail of the
POI, error message will be prompt
Processing Frequencies
None. User can search the location from everywhere
and any time they want
3.3.5.3 Display the distance and duration between two point
Table 3.7: Display distance Use Case
Use Case Diagram
Display the distance and duration between two point
Description
User can view the distance and duration of two point
Preconditions
The system’s should get the point of interest from the
user
Constraints
Internet connection is require to direct the user to
page that describe the detail of the point of interest
Normal Operations
- From the map that show the POI, user can click
two POI that interesting to them
- The system will calculate and show the shortest
distance and the duration between two point
- If the system cannot search the point of interest
that user enter, error message will be prompt
out
Processing Frequencies
None. User can search the location from everywhere
and any time they want
34
3.4 Conclusion
Analysis phase is important for gathering the system requirement so that the
functionalities of the system fit to the scope of the system. Through this chapter,
functional requirement, non-functional requirement and use case of the system is
covered. These requirements are important in order to develop a system which fulfilled
user requirement. At the end of the development phase, user will be test the system
based on the requirement, therefore the system should fulfill user satisfaction. This
chapter also constructed to improved current scenarios to be better.
In next chapter, the design and the technique used to develop this project will
be discussed. This will include the High Level Design (HLD), Detail Design (DD) and
the technique used in the analysis part.
35
CHAPTER IV
DESIGN/THE PROPOSED TECHNIQUE
4.1 Introduction
In this chapter, the system design and function will be discussed. Besides that,
this chapter will also include the proposed technique which will be used in the analysis
phase. System design in this chapter will be discussed based on high-level design and
high level design based on the analysis that had discussed in the previous chapter.
System architecture, user interface and database design is included in the high level
design.
This chapter is important to give a clear picture about how the system functions.
In order to determine reliability of this system, the design phase should be included
high level design. This chapter can be also used as a reference manual that stated how
the system and module interact in the real environment.
4.2 High-Level Design
This section discussed the high level design of the project which includes
architecture design, class diagram, screen design and database design. Function of high
level design is to analyze all requirements that are needed for the software. The
36
structures of the high level design which must be fulfilled by the developer are
functional and non-functional design.
4.2.1 Software Architecture
The software architecture is the set of structures about the system. It included
software elements, external visible properties and the relationship between the
components or module. The main purpose of this section is to asses and evaluates the
system. The software architecture is frequently used as a means to manage the
configuration of the product.
4.2.2 Quality Requirements
GeoTravel application is planned to be recommend the traveler point of interest
in the place that traveler wish to visit. This will be a public application and the
attributes that used in this system are performance, availability, reliability, consistency,
modifiable and traceable.
Table 4.1: GeoTravel Application's Quality Requirements
1
Attributes
Details
Performance
Response to queries should take no longer than 5 seconds
to load the result or data onto the screen to be display to
user after user submitted the query.
2
Availability
The system should available all the time.
3
Reliability
The failure rate of the system should be less than 1 over
100 requests.
4
Consistency
The system requirements must be consistent and do not
conflict with each other.
5
Modifiable
The system should be able to modified or make changes.
6
Traceable
All the data should be able to trace back.
37
4.2.3 System Architecture
Figure 4.1: 3-tier Architecture
The system architecture for GPS Trajectories system is illustrated in the above
figure. It represented in three-tier architecture which consist of Client tier
(presentation), Middle Tier (application and logic) and Database (data and resources).
The architecture of GeoTravel application included server, database and device.
User use a device to access and view the system that supported by a server. When the
user enter a query, the server send the request to database and the database process the
query and send the result to be display to the user on the device.
Flow chart of the system is shown in the figure 4.2.
38
Start
User log into
the system
Get GPS Trajectories
Auto detect location
Mining classical
travel sequence and
interesting place
Suggest
place of
interest
based on the
user location
Place of
interest
User chose place of
interest
Store place of
interest in the
database
Plan itinerary based
on userpreference
User log into
the system
End
End
Figure 4.2: Flow Chart
39
4.2.2 User Interface Design
User interface design is the screen design of the system on how a user will be
able to interact or use the system. User interface design is important to show a more
attractive system. Besides that, the user interface may influence the user to understand
about the system. A good user interface will help the user more understanding about
the system and thus easier to use it. Cost for modify the system at the end of the project
will be reduced if the screen design is plan well at the beginning.
Figure 4.3: Screen Design for the web
40
Figure 4.4:Screen Design for Main Menu
Figure 4.5: Screen Design for Menu List
41
Figure 4.6: Screen Design for Point of Interest
Figure 4.7: Screen Design for Traffic Analysis
42
Figure 4.8: Screen Design for Detail
Figure 4.9: Screen Design for the description of POI
43
Figure 4.10: Screen Design for Distance and Duration
4.2.2.1 Input Design
Input design emphasize on the entry of data into the system. The system need
to receive input from users in order to process its functions. The interfaces and forms
are to be designed to get input from users.
4.2.2.2 Output Design
Output design is the design that emphasizes on presenting the information
retrieved from the system database based on user’s request.
4.2.3 Database Design
Database design is the design of interaction of data entity in the system. The
information that needed to run the application is store in the database. Therefore a well
44
design database will improve the efficiency of the application. Database design is
included in the next section.
4.2.3.1 Conceptual and Logical Database Design
transaction
comments
PK
comment_id
FK1
comment_post_id
comment_author
comment_author_email
comment_author_url
comment_author_IP
comment_date
comment_date_gmt
comment_content
comment_karma
comment_approved
comment_agent
comment_type
comment_parent
user_id
commentmeta
PK
meta_id
FK1
meta_key
meta_value
comment_id
PK
trans_id
FK1
user_id
post_id
post_title
status
payment_method
payable_amt
payment_date
paypal_transection_id
user_name
pay_email
billing_name
billing_add
postcodes_id
FK2
usermeta
PK
umeta_id
FK1
user_id
meta_key
meta_value
user
PK
zones
currency
Countries
PK
zone_id
FK1
zone_code
zone_name
countries_id
PK
PK
countries_id
FK1
countries_name
isa_code_2
isa_code_3
currency_id
currency_id
currency_name
currency_code
currency_symbol
symbol_position
user_id
user_login
user_password
user_name
user_email
user_url
user_registered
user_activation_key
user_status
display_name
postcodes
PK
postcodes_id
FK1
post_id
post_type
latitude
longtitude
countries_id
event
PK
event_id
FK1
postcodes_id
start_date
end_date
price
contact
other
hotel
restaurant
place
PK
hotel_id
PK
place_id
FK1
postcodes_id
price
contact
other
FK1
postcodes_id
price
contact
other
Figure 4.11: ERD Design
PK
restaurant_id
FK1
postcodes_id
working_hour
contact
food_type
other
45
4.3 Detailed Design
After high level design, documentation focus is on detailed design which is low
level design. In detailed design, each module’s responsibility should be specified as
precisely as possible.
4.3.1 System Specification
Table 4.2: System Specification
Title
Description
Project
GeoTravel Application
Sub-system name
none
Author
Liew Li Ching
Program name
GeoTravel
Description
This application is to recommend point of
interest to traveler
Classes used in this application are:
1. MainActivity.java
2. MainMenu.java
3. RouteMapper.java
4. MapMarker.java
5. Direction.java
6. Duration.java
7. Setting.java
46
4.4 Technique Propose
For the analysis part, data is collected through Garmin GPS website. GPS
trajectories about Melaka are collected and stored. The architecture for mining the
interesting location and traveler travel sequence are as below:
i.
GPS trajectories/logs is collected
ii.
Pre-processing is done before mining process
iii.
Detect the stay point
iv.
Mining the location interest by using OPTICS Density Based Clustering
v.
The point of interest is show as the result of the mining process
4.4.1 Data Collection
The main data used in the analysis part is GPS trajectories of various users on
different date and time. The GPS trajectories data is collected from Garmin GPS which
are in text file. After that, the data collected is converted to .gpx file so that it can map
the trajectories on the map.
4.4.2 Pre-processing
In pre-processing, the data collected is pre-process before the mining process.
The method used is cleaning process. During the cleaning process, the data that is
improper is being removed. The data that have the speed value more than 300km/h is
removed. This is because that is impossible for a car or people to travel at 300km/h
except they are traveled by plane. This may be due to malfunction of the GPS.
4.4.3 Stay Point Detection
After pre-processing process, the stay point is detected by using below
algorithm. A simple system is done to detect the stay point base on the algorithm. The
stay point is detected if the distance is not more than 200 m and the time exceed
47
threshold time which is 20 min. Then the point is a stay point. Haversine’ formula is
used to calculate the distance between 2 points.
Figure 4. 12: Harversine' Formula
Input : GPS trajectories
Output: Stay Point
BEGIN
For each GPS trajectories, do
Traj=LogParsing(P)
S=StayPointDetection(Traj, Distancethreshold, Timethreshold)
StayPoint.Add(S)
End
END
Above is the algorithm to determine the stay point. The stay point is detected
and removed the inconsistent point. After this, a Tree Based Hierarchical Graph
(TBHG) is plotted based on the stay point.
After getting get the TBHG, the classical travel sequence of the users is mined.
4.4.4 Mining of Stay Point
In mining process, clustering method is being used. Clustering of stay point is
to get the point of interest which is the common places for traveler. The clustering
method used is OPTICS density based clustering. This clustering is based on density
of the data. This mean that the stay point is clustered based on the location. The more
popular place will have higher density.
48
4.4 Conclusion
Design of the architecture is the important part in a system. Useful of system
is depends on the architecture. Therefore, in this chapter design of architecture is
discussed clearly with the database, system design, detailed design and etc.
In the next chapter, implementation of the design system will be discussed.
49
CHAPTER V
IMPLEMENTATION
5.1 Introduction
In this chapter, implementation phase of the project will be discussed. This
include software and hardware development environment, configuration management
and version control procedure that being used in this project. The purpose of this phase
is to develop and deliver product to client after testing phase. Installation, setup, coding
and testing is the process in this phase.
Software and hardware development environment will be discussed in the first
section.
This project involved environment requirements like Java Kepler
environment to develop android application and server environment. The environment
setting must be setup before the developer can start implementation phase.
The next section is this chapter is about software configuration management.
In this section configuration management plan is discussed. This included the version
on the documentation, user access right, system backup management and etc.
At last, the implementation status for each module is summarised. The details
show in the module included the module size, the start date and the end date of the
module.
50
5.2 Software or Hardware Development Environment setup
Java Development Kit (JDK) must be done at the beginning of the phase
because JDK is important in developing android application using Eclipse. Besides
that, server setup and runtime environment setup are also important for this project.
Therefore, this setup must be done before the development activity start.
5.2.1 Java Environment Setup
Java Development Kit (JDK) and Java Runtime Environment (JRE) are
important to run Eclipse IDE. Without JDK and JRE, the development will failed to
compiled and run.
Download the package of Java EE 6 which included JDK 7. To setup the JDK
in a computer, the following steps are needed:

Download the Java EE 6 zip file

Go to setup/installers

Unzip java_ee_sdk-6u4-jdk7-windows-x64-ml.zip in your computer

Run java_ee_sdk-6u4-jdk7-windows-x64-ml.exe file. The file will automatic
run in cmd.exe when click it

The installation wizard will pop up

Follow the instruction on the installation wizard

Refer http://www.oracle.com/technetwork/java/javaeejavaee6sdk -install-jsp140358.html for more details of installation process
51
5.2.2 Web Application Server
Developing a web application need a server to host the web application. There
are a lot of servers hosting available in the internet. Apache Tomcat 7.0 will be used
as the server in this project.
Step to setup Apache Tomcat 7.0 is as below:

Download Apacthe Tomcat 7.0 on Apache Web

Unzip apache-tomcat-7.0.29.zip

Run apache-tomcat-7.0.30.exe

The installation wizard will pop up

Follow the instruction on the installation wizard.

Refer http://www.mulesoft.com/tomcat-windows for more informatio
5.2.3 Software Development Tools Setup
Installation process of software development tools that required for developing
GeoTravel application.
5.2.3.1 Eclipse IDE
Eclipse IDE for this project is using Java EE Developers (Kepler Packages) .
The purpose of IDE is to develop an application which include coding and testing.
Follow step below to setup Eclipse IDE (Keepler Packages):

Download the Keepler Package from internet

Go tsetup/installers/

Unzip eclipse-jee-kepler-SR2-win32-x86_64.zip

Click eclipse.exe and the eclipse is run on your computer

Refer
http://www.eclipse.org/resources/?category=Getting%20Started
more details
for
52
5.2.3.2 Android Development Tools (ADT)
Android Development Tool (ADT) is a plugin that needed to build Android
application. This plugin can be installed through Eclipse.
Follow the step below to install the plugin:

Run Eclipse on your computer

Select Help, then choose Install New Software.

On the right corner, click add button

Enter https://dl-ssl.google.com/android/eclipse for "ADT Plugin"

Click OK.

Follow the wizard.

Choose the tools you wish to download, the click next

Click accept liscense agreenment if you agree with the liscense

Click next and it will start download.
53
5.3 Software Configuration Management
5.3.1 Configuration Environment Setup
Table 5.1: Environment Setup
LC Stage
Deliverables
Responsible
Planning

Planning Document
Onsite
Requirements
Analysis

Software Requirement
Specification Document
Onsite
Design


High Level Design
Onsite
Build


Source Code
Unit Test Result
Onsite
Integration Test


Integrated Software
Integration Test Result
Onsite
Documentation

User Manual
Onsite
Detailed Design Document
54
5.3.2 Version Control Procedure
Table 5.2: Version Control
Section
Version Type
Revision Number
1
Draft
0.0a
2
Review
0.0b
3
Minor Changes
1.1
4
Major Changes
2.0
5
Baseline
1.0
5.3.2.1 Access Right
Table 5.3: Configuration Access Right
Type of area
Access rights
Draft
Read, Write, Delete, Destroy
Read, Write, Delete
Read, Write
Review/test
Read, Delete, Destroy
Read
Baseline
Read, Delete, Destroy
Read
Release
NA
5.3.2.2 Backup Management
Table 5.4: Backup Management
Storage
Backup
Area
Media
All
Hard Disk
Backup
Checking backup files
Frequency
Frequency
Weekly
Monthly
55
5.4 Implementation Status
Implementation status stated the progress for each module in term of module
planning. The time or duration of each module is stated and the date complete of each
module is recorded.
Table 5.5: Analysis Status
Step
Duration to Complete
Date Completed
Data Collection
10
12 Jun 2014
Proposed Technique
10
22 Jun 2014
Analysis
5
27 Jun 2014
Other
3
30 Jun 2014
Table 5.6: Implementation Status
Module
Duration to Complete
Date Completed
Main Menu
3
3 July 2014
Point of interest
4
7 July 2014
Traffic Analysis
5
12 July 2014
Route Suggestion
3
15 July 2014
Analysis Result
2
17 July 2014
Others
2
19 July 2014
56
5.5 Conclusion
This chapter is about implementation phase in project development life cycle.
It explained about process to development system which included setup before code.
Tasks like software or hardware development environment setup, configuration
environment setup, and implementation status is discussed in this chapter.
In the first section of this chapter, software or hardware development
environment setup is discussed where environment setup process is discussed in detail.
These setup are important and must be done before develop process so that coding can
be implemented on time. Environment setup included setup of software included java
environment setup, database server setup, web application server setup, Eclipse setup
and android development setup which are needed in development and testing process.
In this project, GeoTravel application can be run either on web or android platform.
Therefore the mobile server and web server must be setup before GeoTravel
application can be run and tested fully.
In the next section, detail of software configuration management is discussed.
Configuration of environment setup and version control procedure are recognized and
documented. The flow and the version is determined and recorded so that it gives clear
information of the version. In configuration plan, the flow between working stage,
review stage, and finally stage have their own version of numbering and must be
follow throughout the project.
Lastly, implementation status of this project application is discussed in the last
section. In this section, analysis status and the implementation status for module is
conducted. The duration of complete and date completed must be followed so that the
project schedule won’t be affected and can deliver on time. The duration to complete
the analysis and implementation status is roughly 5 weeks.
57
CHAPTER VI
TESTING / EXPERIMENTAL RESULTS AND ANALYSIS
6.1 Introduction
This chapter is about testing, experimental results and analysis. This includes
test plan, test environment, test strategy, and analysis experimental result. In testing
phase, the system is tested and checked function by function so that the developer can
detect the fault of the system. Based on the testing result, developer can fixed the error
before establish the system to public.
In test strategy, approach and architecture to be used to perform testing is
discussed. The purpose of a test strategy is to clarify the major tasks and challenges of
the test project. Test Strategy included black box testing, cause-effect, graphing,
boundary testing, and white box testing to test this product against its specification. In
this project, only bottom-up, white box testing and black box testing will be conducted.
Test plan is the document that describing the testing scope, activity and
perform a test to the system. Any software product or application project are required
to undergo test plans. Test plans are prepared for every stage of the system so that
tester can test the whole system. Test plans included unit testing, integration testing,
and user acceptance testing. Every stage of test plan has its own function and format
to be followed.
58
Besides that, this chapter also included test design which is the design or
planning on test phase that is suitable for testing this application. In this section, test
plan is explained in detail which including, test name, condition and expected result.
The purpose of test design is to make sure the tester can test the application
systematically and perfectly by follow the plan.
After perform test case, the test result will be documented as test result. Test
result included the error or failure of the application. If error is get as the test result,
the detail of error or failure must be stated clearly in the document.
Last section of this chapter is analysis and result. This included result of mining
GPS trajectories.
6.2 Test Plan
Test plan is the document that describing the testing scope and activity of
application thus perform a test to the system
6.2.1 Test Organization
6.2.1.1 Integration Test Plan
6.2.1.1.1 Integration Test Environment

Hardware
Laptop
i.
ASUS N43, Intel (R) Core(TM) i5-2410M CPU @ 2.30GHz, 4.00GB of
RAM

ii.
Mouse
iii.
Keyword
Software
59

i.
Window 7 Ultimate Service Pack 1
ii.
Eclipse Keepler
iii.
Android SDK
iv.
Google Chrome
Communication
- Internally

Security Level
- At each module

Specific test needs
- None
6.2.1.1.2 Integration Parameter


Critical Modules
i.
Main Menu
ii.
Search Location
iii.
Point of Interest
iv.
Traffic Analysis
v.
Distance and Duration
Interfaces among module
60
-
Main Menu  Search Location/ Point of Interest/ Traffic Analysis/
Distance and Duration/ User manual
Search Location
Point of Interest
Traffic Analysis
Main Menu Page
Distance and Duration
User Manual
Figure 6.1: Interface among Module

External interfaces
-
6.2.1.1.3

None
Integration Procedure
Order of integration
Main Menu Search Location Point of Interest Traffic Analysis Distance
and Duration

Activities, techniques, tools
-

None
Test Execution procedures
61

Test result checking method
-

Visual inspection and comparison to the expected result
Test stop criteria.
-

Input data manually into form fields.
Mandatory error
Integration Test report
Table 6.1: Integration Test Report
Author
Liew Li Ching
Tested By
Liew Li Ching
Subsystem Name
-
Funtionality Test
GUI
Test Data
refer IntegrateTestPlan.xls
Test Condition
IntegrateTestPlan.xls
6.2.1.2 Unit Test Plan
Table 6.2: Unit Test Plan
Author
Liew Li Ching
Application
GeoTravel Application
Tested By
Liew Li Ching
Subsystem Name
-
Funtionality Test
All module
Test Execution
1. Main menu
2. Search Location
3. Point of interest
4. Traffic
5. Distance and Duration
Test Data
refer IntegrateTestPlan.xls
Test Condition
IntegrateTestPlan.xls
62
6.2.2 Test Environment

Hardware
i.
Samsung Galaxy NOTE 10.1
ii.


-
Android 4.3 Jelly Bean
-
Memory: 3GB RAM, 16GB
-
1.9GHz Quad + 1.3GHz Quad
Sony Ericson Xperia X10
-
Android 2.3.3 GingerBread
-
Memory: 384 MB RAM, 8GB
-
1 GHz Scorpion
Software
i.
Microsoft Windows 7 Ultimate Service Pack 1
ii.
Eclipse Kepler
iii.
SDK environment
iv.
Google Chrome
Test Stop Criteria
-
Mandatory error
6.2.3 Test Schedule
Table 6.3: Test Schedule
Date
Module
Result
1 August 2014
Main Menu
Functioning
4 August 2014
Search Location
Functioning
8 August 2014
Point of Interest
Functioning
12 August 2014
Traffic Analysis
Functioning
15 August 2014
Distance and Duration
Functioning
63
6.3 Test Strategy
Test strategy in a project is important to reduce the testing time. Test
strategy is used to produce an efficient test case so that the application can be test
efficiently in order to improve the quality of application.. The purpose of a test strategy
is to clarify the major tasks and challenges of the test project. Test Strategy included
black box testing, cause-effect, graphing, boundary testing, and white box testing to
test this product against its specification. In this project, only bottom-up, white box
testing and black box testing will be conducted.
Bottom-up testing approach is used in this project. The lowest level
components are tested first follow by higher level components. It starts from testing
the small component in each modules and follow with integration test which is tested
in integrated module. The bottom-up testing is end up with testing the whole system
which user acceptance test is performed. The reason of choosing bottom-up approach
as test strategy in this project is because this application has 5 modules and each
module has to complete their own functionality so that the system can be work together.
White box testing also known as structural testing is the testing method which
used to test the internal mechanism of the system. It is a verification techniques used
by the developer to examine whether their code works as expected. Usually, white box
testing involved unit testing and integration testing.
Black box testing which also known as functional testing is the testing phase
that ignores the internal mechanism of system or component. Black box testing only
focused on the output that generated in response. User acceptance testing is one of the
examples of black box testing as users only test the external function of the system and
do not know what is the code structure and how the internal work.
6.4 Test Implementation
64
Test implementation is the process where test condition is transformed into test
case. At this phase, test environment is setup to perform test on the application.
Major task in test implementation are:
i.
Develop test case
ii.
Collect test data
iii.
Create test data
iv.
Write test procedures
v.
Create test from test case
vi.
Verify test environment
vii.
Execute test case
viii.
Compare result
6.5 Data Analysis
6.5.1 Experimental / Test Description
The data that used in this project is real-time data. Collection of data is done
by collect the real time trajectories from the users. In the real case, the data needed is
huge which may cause one year to collect. Therefore, to make it simple, this project
only focused on Melaka state. There are 10 users involved and each user contributed
more than ten trajectories which they travel along Melaka. Each trajectory contained
around 100 GPS coordinate.
After collect all the data, process data mine the interesting location and
classical travel sequences in a given geospatial region is done. In this process, treebased hierarchical graph (TBHG) is used to model multiple’s individual’s location
histories. Hypertext Induced Topic search (HITS) based inference model is used after
TBHG process. This model infers interest of a location depends on not only the number
of users visiting this location but also users’ travel experience.
After mining the point of interest, novel itinerary planning approach is
suggested in this project to help the user plan their itinerary based on their preferences.
65
6.4.2 Data
Sample Data is show in table 6.4.
Table 6.4: Sample Data
Latitude
2.19711
2.19705
2.19698
2.19696
2.1969
2.19684
2.19681
2.19673
2.19663
2.19656
2.19650
2.19642
2.19635
2.19628
2.19621
2.19613
2.19606
2.19598
2.1959
2.19584
2.19578
2.19566
2.19578
2.19587
2.19599
2.19609
2.19621
2.19631
2.19641
2.19650
2.19656
2.19657
2.19655
2.19658
2.19662
2.19662
Longitude
102.2487
102.2487
102.2487
102.2486
102.2486
102.2485
102.2485
102.2485
102.2484
102.2483
102.2483
102.2482
102.2482
102.2481
102.2480
102.2480
102.2479
102.2479
102.2478
102.2478
102.2477
102.2476
102.2475
102.2474
102.2473
102.2472
102.2470
102.2469
102.2468
102.2467
102.2467
102.2466
102.2467
102.2466
102.2466
102.2466
Time
4:09:22
4:09:27
4:09:32
4:09:37
4:09:42
4:09:45
4:09:47
4:09:52
4:09:57
4:10:02
4:10:07
4:10:12
4:10:15
4:10:17
4:10:22
4:10:27
4:10:32
4:10:37
4:10:42
4:10:47
4:10:52
4:10:57
4:11:02
4:11:07
4:11:12
4:11:17
4:11:22
4:11:27
4:11:32
4:11:37
4:11:42
4:11:47
4:11:52
4:11:57
4:12:02
4:12:07
66
2.19670
2.19679
2.19686
2.19679
2.19671
2.19665
2.19664
2.19661
2.19658
2.19642
2.19633
2.19630
2.19635
2.19655
2.19673
2.19674
2.19683
2.19693
2.19701
2.19710
2.19721
2.19729
2.19739
2.19748
2.19758
2.19772
2.19781
2.19784
2.19787
2.19798
2.19810
2.19833
2.19855
2.19875
2.19897
2.19909
2.19928
2.19940
2.19949
2.19958
2.19972
2.19985
2.19984
2.19982
2.19979
102.2465
102.2464
102.2464
102.2463
102.2462
102.2462
102.2462
102.2461
102.2461
102.2460
102.2459
102.2459
102.2458
102.2458
102.2458
102.2459
102.2460
102.2461
102.2461
102.2461
102.2460
102.2459
102.2459
102.2458
102.2457
102.2457
102.2458
102.2459
102.2460
102.2460
102.2461
102.2461
102.2462
102.2462
102.2463
102.2463
102.2464
102.2464
102.2465
102.2465
102.2465
102.2466
102.2466
102.2467
102.2468
4:12:12
4:12:17
4:12:22
4:12:27
4:12:32
4:12:37
4:12:42
4:12:47
4:12:52
4:12:57
4:13:02
4:13:07
4:13:12
4:13:17
4:13:22
4:13:27
4:13:32
4:13:37
4:13:42
4:13:47
4:13:52
4:13:57
4:14:02
4:14:07
4:14:12
4:14:17
4:14:22
4:14:27
4:14:32
4:14:37
4:14:42
4:14:47
4:14:52
4:14:57
4:15:02
4:15:07
4:15:12
4:15:17
4:15:22
4:15:27
4:15:32
4:15:37
4:15:42
4:15:47
4:15:52
67
2.19978
2.19976
2.19976
2.19976
2.19976
2.19976
2.19979
2.19979
2.19977
2.19976
2.19975
2.19972
2.19964
2.19954
2.19954
2.19944
2.19936
2.19929
2.19923
2.19916
2.19910
2.19906
2.19904
102.2469
102.2470
102.2471
102.2472
102.2473
102.2474
102.2475
102.2476
102.2476
102.2476
102.2476
102.2476
102.2476
102.2476
102.2476
102.2477
102.2477
102.2477
102.2477
102.2477
102.2477
102.2477
102.2478
4:15:57
4:16:02
4:16:07
4:16:12
4:16:17
4:16:22
4:16:27
4:16:32
4:16:37
4:16:42
4:16:47
4:16:52
4:16:57
4:17:02
4:17:07
4:17:12
4:17:17
4:17:22
4:17:27
4:17:32
4:17:37
4:17:42
4:17:47
6.5 Test Results and Analysis
The raw data from the GPS trajectories is converted into .gpx format. After
converted to .gpx format, the file is then analyzed and visualized. The result is shown
in figure 6.2:
68
Figure 6.2: GPS trajectories
Figure 6.3: Density based Clustering
From the figure 6.2, the user GPS trajectory is visualized in figure. The speed
of the user that used to travel that area is around 20km/h. In the next figure, density
based clustering is used to get the stay point of the user which the user like to travel.
From the figure 6.3, can conclude that points of interest are at Planetarium Melaka
(2.272, 102.287) and Zoo Melaka (2.2774, 102.299).
69
Table 6.5: Result
From the table 6.5, shows that the total paths from 10 users are 8053 and the
coordinates detected are 12799. The coordinate selected after pre-processing are 8500.
There are 357 stay point detected from total 10 users GPS trajectories. From the 357
stay points, OPTICS clustering is done and gets 14 point of interest. The 14 points of
interest are the coordinate point with most density of people that travel to that
coordinate which indicate a popular travel location.
6.6 Conclusion
This chapter discussed about testing and experiment result. In this chapter,
testing phase including test plan, test strategy and test implementation is discussed. At
the end of the testing phase, user acceptance test is carrying out.
The first section of this chapter is about test plan. All the plans regarding testing
phase is documented. Test plan is designed to perform test. The flow of testing phase
is to ensure all the module in application is tested systematically and correctly.
70
Next section is the test strategy. In this section the strategy used by developer
to perform test is recorded as test case. The techniques that are used in the test case are
bottom up approach, white box testing, and black box testing.
After that, test data and data analysis is discussed. The GPS trajectories data is
process and the result is tested. The analysis of the data is carrying out and documented.
The test result of all test performed is recorded. If the result is fail, the module
need to be edit and modified. After that, the test case is carrying out again to ensure
there is no major error. After fixed the error and the test case is run smoothly, user
acceptance testing is carrying out which involve 10 users. Improvement is done by
getting user comments.
After analysis and test data, the point of interest of 10 users is recorded. Density
based clustering method is used to get the point of interests. The coordinate of point
of interest is store in the database and when user view the application, the map with
point of interest is shown. Refer figure 6.4.
Figure 6.4: Point of interest
GeoTravel Application function by auto detected the user location. If the user
wishes to travel other place, he can use the search menu to search the location or place
71
he wish to travel. He can enter the place name or the coordinate to search the place.
Refer figure to see the detail.
Figure 6.5: Search Location
If he wishes to know the point of interest around him, he can click the point of
interest button. This module will direct the user to the map and show the point of
interest around that area. Refer figure 6.6.
Figure 6.6: Place of Interest
72
After getting the point of interest, if the user wishes to know the traffic allow
the point of interest, he can click the traffic button at the upper page. The traffic
analysis is show. Refer figure. The green colour indicates fluent of traffic, and red
colour indicates traffic jam.
Figure 6.7: Traffic Analysis
If the user wants to know the detail about the point of interest, he can click
the marker. After the user click, the marker will show the name of place and simple
description. Refer figure 6.8. If the user wishes to know more, he can click the box
above the marker and the application will direct to the page that describe the point of
interest in detail. Refer figure.
73
Figure 6.8: Description of POI
Figure 6.9: Detail of POI
The last module of this application is about distance and duration. If the user
wishes to know the distance and duration between two points, he can just click two
point of interest on the map. The system will calculate the shorter path and show the
74
distance with duration on the screen. This can help the user in plan their trip so that
they use their time accurately. Refer figure 6.10.
Figure 6.10: Distance and Duration
75
CHAPTER VII
PROJECT CONCLUSION
7.1 Introduction
Project Conclusion is the last chapter of this project. In this chapter, the
conclusion of the whole project is discussed. The strengths and the weaknesses of
GeoTravel application is observed and the suggestion of improvement is discussed so
that the system can become better.
In the first section of this chapter, strengths and weaknesses of the application
are discussed. Every system or application must have strength and weakness. To have
a better application, developer must maintain the strength and improve the weakness.
The strength and weakness include in architecture, algorithm, user interface and
database. Limitation of GeoTravel application will be discussed too.
Next section is about improvement of the system based on the limitation. This
section discussed the improvement that can be done to enhance the system.
Contribution of the system that can be made is also discussed in this chapter. The
contribution of GPS trajectories and GeoTravel application is recorded.
76
7.1 Observation on Weaknesses and Strengths
7.1.1 Strengths in GeoTravel System
Strength of GeoTravel System includes it consists of web-based and android
application. This feature gives another choice for the user. The android application is
light compare to web-based, therefore it is easier to use.
Besides that, point of interest of GeoTravel System is based on mining of GPS
trajectories. It also included the live event which many systems does not include. The
live event that held in a place is important for a travelers because some of the traveler
especially backpacker may want to join local event to gain more experience. By mining
of GPS trajectories, the point of interest that suggest is the popular place. This can give
an idea to people who are not familiar with the places.
Other than this, GeoTravel System also included a multiday itineraries plan.
User can choose place to visit based on their preferences and the system will plan the
itineraries for them.
7.1.2 Weakness in GeoTravel System
The weakness in GeoTravel System is there is current application was
developed for state of Melaka. This is because data collections of real GPS trajectory
take a lot of time. To obtain more point of interest, it requires more GPS trajectory.
Besides that, GeoTravel application required internet connection to work. This
included the web-based or android version. This is because checking user location and
getting information from the map required internet connection. Without internet
connection, most of the task cannot be done.
The GPS trajectories data are taken from Garmin GPS device. The limitation
of this is the data that use to suggest the point of interest is just based on Garmin GPS
77
user. Data from other GPS device is not used because there is only Garmin provided
GPS trajectories and this may causes the data only depend on Garmin GPS device.
Other than this, this application do not recorded user trajectory. By record user
trajectory, the point of interest may update always based on user travel sequence so
that the data is up to date.
7.2 Propositions for Improvement
There are strengths and weaknesses in all of the application. If there are
weaknesses, then improvement must be made so that the application becomes better.
The improvements that can be done on GeoTravel application are:
1. Improve the system so that it support more state or country
2. Improve the code structure and algorithm of the sytem
3. Collect data from more GPS device
4. Enhance the application so that it record user trajectory
5. Develop application that supported other than Android
7.3 Contribution
GeoTravel System acts as a platform that provides convenience for traveler and
backer. It suggests point of interests based on the GPS trajectories. GeoTravel systems
not only contain web system, it also contains android application. This allows user to
access the system anytime and anywhere when there is internet connection.
GPS trajectories from various users contain a lot of information. From the
information, it helps users to understand the surrounding location and enable travel
recommendation. Backpacker needs an efficient and economic trip plan application.
78
The live event is included so that travellers have more choice. GeoTravel system also
included multi-day itineraries plan.
7.4 Conclusion
In this chapter, strengths and weaknesses of GeoTravel system is discussed.
Strengths of GeoTravel application includes it consists of web-based and android
application that suggest point of interest based on GPS trajectories. This feature gives
another choice for the user. The android application is light compare to web-based,
therefore it is easier to use.
In this chapter, improvement which can be done based on the weaknesses are
suggested and discussed. The improvement on server and client side is suggested. This
application should support platform other than Android in the future.
In conclusion, this application is better than other travel application is that the
point of interest is suggested based on other user GPS trajectories. This mean that only
the popular point of interest which most of the users visiting are show and suggested
to user.
79
REFERENCES
1.
Stefanidis, A. Crooks, J. GeoJournal (2012). Harvesting
Geospatial Information from Socialmedia Feeds .
Ambient
2.
Zheng, Y. Xie, X. Ma, W. (2010). “GeoLife: A Collaborative Social Networking
Service among User, Location and Trajectory.” Microsoft
3.
Huang, L. Li, Q. Yue, Y. (2010) “Activity Identification from GPS
Trajectories Using Spatial Temporal POIs’ Attractiveness.” 2nd ACM
SIGSPATIAL International Workshop on Location Based Social Networks 2730.
4.
Zheng, Y. Zhang, L. Xie, X. Ma, W. (2009) “Mining Interesting Locations and
Travel Sequences from GPS trajectories.” Spain: Mandrid
5.
Chen, M. Xu, M. Franti, P. (2012) “Compression of GPS Trajectories.” 2012
Data Compression Conference
6.
Daulamis, A. Pelekis, N. Theodoridis, Y. (2012) “Easy Traker: An Android
application for capturing mobility behavior.” 16th Panhellenic Conference on
Informatics
7.
Chen, G. Wu, S. Zhou, J. Anthony, K. Tung. (2014) “Automatic Itinerary
Planning for Traveling Service.” IEEE Transactions on Knowledge and Data
Engineering. VOL.26, No.3. Singapore
8.
Lee, W. (2011). “Beginning Android Tablet Application Development.” Indiana:
Indianapolis
9.
Smith, D. Friesen, J. (2012). “Android Recipes: A problem-Solution Approach.”
USA: New York
10.
Muhammad, S. Young, K. Lee, S. (2013) “Dynamicity in Social Trends towards
Trajectory Based Location Recommendation.”
80
APPENDIX 1
Flow Chart and Grantt Chart
81
Appendix
Flow Chart of Project Activities
Start
Briefing to the student
Selection of supervisor and student
Proposal of the title
Identify the objectives, Literature review
and Methodology
Writing of Project Porposal
Improve
Fail
Evaluation of
proposal
Pass
Methodology State
Analysis State
Design State
Implementation State
Integration State
Testing State
Integration State
Final Presentation
Improve
Fail
Evaluation
Pass
Report submission
End
82
Gantt Chart of Project Activities
1
Week
Task
PSM Proposal
Introduction
Methodology
stage
Analysis stage
Design stage
Implementation
stage
Integration stage
Testing stage
System
Demonstration
Presentation
Final report
2 3
4
5
6
7
8
9
10
11
12
13
14
83
APPENDIX 2
USER MANUAL
84
USER MANUAL
Follow the below steps to use the application. GeoTravel application does not required
user to login.
1.
Choose the GeoTravel application in your device.
2. Click the welcome button at the first page.
85
3. User can choose to search the location by enter name of the place.
4. User can also see the suggested point of interest that around the user by choose
the button Point of interest
86
5. The point of interest is show in the map.
6. User can view the traffic by click the button traffic at top.
87
7. User can view the detail by click the marker.
8. Direction and Distance is show when user clicks the button at menu.