1
USER MANUAL FOR BIOFLYER DATABASE
David William Allen
aCAS
Virginia Center for Autonomous Systems
Virginia Polytechnic Institute & State University
Blacksburg, VA 24060
www.unmanned.vt.edu
November 30, 2015
Technical Report No. VaCAS-2015-02
c 2015
Copyright Summary
In order to compare the results of the new integrated morphology and gait optimization to diverse
examples from biology, a comprehensive and easily accessible database is required. Unfortunately,
no such database is publicly available, so one was developed. This database includes data from
various sources. In addition, a text-based interface that utilizes MATLAB was developed that
allows for easy access and editing the database. Additionally this interface can be used to create
plots. These plots allow for the data to be sorted so that trends can be observed. These trends
can be used to identify trends that form commonalities between diverse species as well trends that
show difference between different flight strategies.
i
Contents
1 Introduction
1
1.1
System Requirements . . . . . . . . . . . . . . . . . . . . . . . . . . . . . . . . . . .
1
1.2
File Structure . . . . . . . . . . . . . . . . . . . . . . . . . . . . . . . . . . . . . . .
1
1.3
Included Data . . . . . . . . . . . . . . . . . . . . . . . . . . . . . . . . . . . . . . .
2
2 Operation
3
2.1
Initializing the Database . . . . . . . . . . . . . . . . . . . . . . . . . . . . . . . . .
3
2.2
Interacting with the Database . . . . . . . . . . . . . . . . . . . . . . . . . . . . . .
4
3 Known Issues
16
ii
List of Figures
1
An example plot made by the animal database. . . . . . . . . . . . . . . . . . . . .
iii
15
List of Tables
1
Files required for the Animal Database . . . . . . . . . . . . . . . . . . . . . . . . .
iv
2
David William Allen
1
Introduction
Although there are numerous sources for the physical characteristics of flying animals (see section
1.3 for a few examples), there are no data sets that are both publicly available and easily accessible.
To remedy this situation, a database of various physical properties of flying animals were developed.
1.1
System Requirements
From the start this database was designed to be as platform agnostic as possible. It has been tested
on Windows (7, 8, and 8.1), Max OSX (Mavericks and Yosemite), and Linux (Elementary OS 0.3
Freya, an Ubuntu 14.04 LST derivative). It requires MATLAB 2014b, or later. This database will
NOT run on MATLAB 2014a or earlier, due to a change in how graphics are handled∗ .
1.2
File Structure
All of the files are attached to this PDF in a single zip archive. The files included are protected
MATLAB files (p-files). Since they are p-files, they cannot be editted, but they can be run. Download this archive and extract it to a single directory. This directory should contain all of the files
contained in Table 1. All of the files required to run the database are attached to this document.
Most modern PDF readers can download these files. Save the Zip archive to your computer, then
extract to a convenient location.
∗
The only issue with earlier versions is when it comes to switching the axes to semi-log or log-log. The rest of
the program should work and will produce a plot without logarithmic axes. The axes can be change to log-log or
semi-log manually using plot tools.
Page 1
Virginia Center for Autonomous Systems Report No. 2015-02
David William Allen
Filename
AnimalDatabase.p
AnimalData v3.mat
appendEntry.p
accessEntry.p
addToEntry.p
editEntry.p
extract2Ddata.p
create2DPlot.p
1.3
Table 1: Files required for the Animal Database
Description
This is the primary script for interacting with the animal database. When
run, it prompts the user for input and provides on-screen instructions in
the command window.
This file contains all of the animal data.
If you choose to,
AnimalDatabase.p will modify the contents this database, but by default changes will not be saved. The “v3” refers to modifications made in
order to improve the formatting of the database. There are no functional
differences, so previous versions are not included.
This function is called by AnimalDatabase.p and is used to add an additional entry to the database. This entry is added to the end of the
database.
This function is called by AnimalDatabase.p and is used to display all
of the data for a chosen entry. This does not change the entry, merely
displays all of the data. Also includes a list of data not contained in the
entry,
This function is called by AnimalDatabase.p and is used to add data to
an already extant entry. Cannot edit data already in the entry.
This function is called by AnimalDatabase.p and is used to edit the data
in an already extant entry. Cannot add missing data to an entry.
This function is called by AnimalDatabase.p and is used to extract data
from the database. It sorts the data according to the parameters chosen
by the user. Can exclude data based on type or taxonomical class.
This function is called by AnimalDatabase.p and is used to create a 2D
plot. This function calls extract2Ddata.p to sort the data. Prompts user
for type of plot (linear, semi-log, or log-log).
Included Data
The data comes from several sources, which were chosen to attempt to get a sufficient diversity of
data. This database is not a complete database and should be updated in the future. All of the
data was found in tables and copied, by hand, into a database. A few obvious errors in the original
(e.g. a misplace decimal point) were corrected, but there may be unidentified errors. Fortunately
the size of the database is large enough that any minor errors should not affect overall trends. One
possible source of error is that some sources average data over several animals in the same species
while other sources include only individual animals. Furthermore, there is not a way to separate
male from female (or sexless in the case for some insects) animals.
To identify the source of the data, a “Source” is listed with a number identifying the source of the
data. The numbers refer to the following sources
Page 2
Virginia Center for Autonomous Systems Report No. 2015-02
David William Allen
[1]
Jepsen, G. L., Baker, R. J., Vaughan, T. A., Orr, R. T., Griffin, D. R., Davis, W. H.,
Rosenbaum, R. M. (1970). Biology of Bats: Volume I. (W. A. Wimsatt, Ed.) (1st ed.). New
York, New York, USA: Academic Press.
[2] Greenwalt,
C. H. (1962).
Dimensional Relationships for Flying Animals.
Smithsonian Miscellaneous Collections, 144(2), 146.
Retrieved from
http://www.biodiversitylibrary.org/item/79674
[3] Hazlehurst, G. A., & Rayner, J. M. V. (1992). Flight Characteristics of Triassic and Jurassic
Pterosauria: An Appraisal Based on Wing Shape. Paleobiology, 18(4), 447463. Retrieved
from http://www.jstor.org/stable/2400829
[4] Norberg, U. M., Allometry of Bat Wings and Legs and Comparison with Bird Wings, Philosophical Transactions of the Royal Society B: Biological Sciences, vol. 292, Jun. 1981, pp.
359398.
[5] Warham, J., Wing loadings, wing shapes, and flight capabilities of procellariiformes, New
Zealand Journal of Zoology, vol. 4, Mar. 1977, pp. 7383.
[6] Farney, J., and Fleharty, E. D., Aspect Ratio, Loading, Wing Span, and Membrane Areas
of Bats, Journal of Mammalogy, vol. 50, May 1969, pp. 362367.
As previously stated, each of these sources were chosen to attempt to increase the diversity of
data. The majority of the data comes from Source 2, which was a similarly motivated publication,
although, given its publication date, it is not particularly accessible by modern standards.
2
Operation
The purpose of this chapter is to describe how to operate the database. It starts with basic set-up
and continues through on interact with the database and extract data and plots from the database.
Additionally, it will be demonstrated how to add data to the database.
2.1
Initializing the Database
Before beginning, ensure that all of the files listed in Table 1 are in the current directory. To start
the database, enter “AnimalDatabase” into the command window (or run the file any other way)
and the following message appears:
This is the interface for the animal database. The purpose of this interface is
to enable rapid access and analysis of the animal database, primarily focusing
on plotting the data and discovering trends. Please answer the following questions
for intialization. Please answer "Y" or "N" (without quotes). If something is
entered other than "Y" or "N" the answer is assumed to be "N".
You will then be asked a series of questions about initializing the script. These questions are:
Do you wish to clear your worksapce (recommened)? (Y/N)
Do you wish to close your figures (recommened)? (Y/N)
Do you wish to save changes to the database (NOT recommened)? (Y/N)
Page 3
Virginia Center for Autonomous Systems Report No. 2015-02
David William Allen
Respond to these questions by entering “Y” or “N”. If an unrecognized character is entered, the
recommended choice is selected, i.e. the workspace is cleared, figures are closed, and changes will
not be saved. After the database is initialized, a menu of operations is presented. It should be
noted that “saving” refers to saving data to the permanent database, a temporary data structured
(called DATA) will be in the workspace after the database is closed, which includes all of the changes
that were made while accessing the database.
2.2
Interacting with the Database
The primary means of interacting with the database is by entering numbers corresponding to options
in various menus. This section will describe the purpose of every option in the menu.
2.2.1
Main Menu
This menu calls the other functions to perform requested tasks. After the other tasks are complete,
you are return to this menu. If you choose not to save changes, the main menu appears as†
Please choose from the following options:
0: Exit
1: Access entry
2: Edit entry
3: Add data to entry
4: Append entry to database
5: Extract a 2D dataset
6: Create 2D plot
Choose task:
To choose an operation, simply enter the number corresponding the desired operation. When you
are done, enter “0” to exit. Upon exit you will receive confirmation that the database was closed
successfully (and that data was/wasn’t saved, if applicable).
2.2.2
Access Entry
If the user desires to view a particular entry in the database, he/she will select option “1” at the
main menu. This does not allow the editting of the entry, merely access. This presents the user
with a prompt asking
Which entry do you wish to access (0 to cancel)?
The number here corresponds to a particular entry in the database. These entries are not sorted
in any particular order. If “0” is entered, the user is immediately returned to the main menu. If
†
If you did choose to save changes to the database, the first option will instead appear as “0:
-1 to exit without saving”.
Page 4
Virginia Center for Autonomous Systems Report No. 2015-02
Exit and save.
David William Allen
an entry number is entered that is not in the database‡ , the database returns “Selected entry
outside of range” and prompts the user to press any key to continue back to the main menu.
When a valid entry is requested, the database returns all of the data in the desired entry, as well as
a listing of data not included for the particular entry. For more information about the data, refer to
section 1.3. For the sake of example, if the user requests entry “1066” (a house wren) the database
will display
Data Summary for entry 1066
ID: 1066
Source: 2
Latin Name: Troglodytes a. aedon
Common Name: House wren
Sex: m
Table Number: 14
Table Comments: Wing length measurements from different sources
Phylum: Chordata
Superclass/ Subphylum: Tetrapoda
Class: Aves
Order: Passeriformes
Family: Troglodytidae
Common Name of Type of Animal: Passerines
Mass, mg: 11000
Mass, g: 11
Wing Length, mm: 50.7
Wing Length, cm: 5.07
Wing Area, mm2: 4840
Wing Area, cm2: 48.4
Wing Loading, mg/mm2: 2.2727
Wing Loading, g/cm2: 0.22727
Missing Data:
Comments
Suborder/ Subclade
Wing Model from source 3
Flight Mode
Flight Mode (French)
Primary Food Source
Wing-beat Rate, Hz
Hind Wing Length, mm
Length of both wings, mm
Length of both wings, cm
Wing Mass, mg
Wing Mass, g
Percent Wing Weight
‡
As of November 30, 2015, there are 1655 entries.
Page 5
Virginia Center for Autonomous Systems Report No. 2015-02
David William Allen
Moment of Inertia of Wings, mg*mm2
Wing Span, mm
Wing Span, cm
Wing Span, m
Mass of muscle, mg
Mass of muscle, g
Percent Muscle Mass
Large Pectoral Muscle Mass, g
Percent Large Pectoral Mass
Small Pectoral Muscle Mass, g
Percent Small Pectoral Mass
Ratio Large/Small Pectoral
Mass of heart, mg
Mass of heart, g
Percent Heart Mass
Aspect Ratio
Press any key to continue
Press any key to return to the main menu. This operation makes no changes to the database.
2.2.3
Edit Entry
Choosing option “2: Edit entry” at the main menu allows you to access one particular entry for
editing. The database will prompt you for the entry number that you want to edit. For example,
if “1066” is chosen, the output will database will display
Editing data for entry 1066
This operation is for editing and deleting extant data only. Use the "Add Data to
entry" operation to add data to a missing category.
What would you like to edit?
1) Source; Current Value: 2
2) Latin Name; Current Value: Troglodytes a. aedon
3) Common Name; Current Value: House wren
4) Sex; Current Value: m
5) Table Number; Current Value: 14
6) Table Comments; Current Value: Wing length measurements from different sources
7) Phylum; Current Value: Chordata
8) Superclass/ Subphylum; Current Value: Tetrapoda
9) Class; Current Value: Aves
10) Order; Current Value: Passeriformes
11) Family; Current Value: Troglodytidae
12) Common Name of Type of Animal; Current Value: Passerines
13) Mass, mg; Current Value: 11000
Page 6
Virginia Center for Autonomous Systems Report No. 2015-02
David William Allen
14) Mass, g; Current Value: 11
15) Wing Length, mm; Current Value: 50.7
16) Wing Length, cm; Current Value: 5.07
17) Wing Area, mm2; Current Value: 4840
18) Wing Area, cm2; Current Value: 48.4
19) Wing Loading, mg/mm2; Current Value: 2.2727
20) Wing Loading, g/cm2; Current Value: 0.22727
Enter number of data you want to edit (0 to exit):
Entering “0” returns to main menu and entering the number corresponding to the value you wish
to change brings up the following (“10) Order; Current Value: Passeriformes” is chosen as
an example)
Editing "Order"
Entry Instructions:
10) Order; Current Value: This is a testChange:
Cancel:
Enter 0
Delete:
Enter -1
Enter a new value (must be same data
Current Value: Passeriformes
New Value:
There are three options for entry: if “0” is entered, the entry will not change and you will be back
to the editting menu, −1 deletes value§ , and if a value is entered, the new value replaces the old
value. For example if “This is a test” is entered at the prompt above, the database will replace
“Passeriformes” with “This is a test” and display
What would you like to edit?
1) Source; Current Value: 2
2) Latin Name; Current Value: Troglodytes a. aedon
3) Common Name; Current Value: House wren
4) Sex; Current Value: m
5) Table Number; Current Value: 14
6) Table Comments; Current Value: Wing length measurements from different sources
7) Phylum; Current Value: Chordata
8) Superclass/ Subphylum; Current Value: Tetrapoda
9) Class; Current Value: Aves
10) Order; Current Value: This is a test
11) Family; Current Value: Troglodytidae
12) Common Name of Type of Animal; Current Value: Passerines
13) Mass, mg; Current Value: 11000
14) Mass, g; Current Value: 11
15) Wing Length, mm; Current Value: 50.7
16) Wing Length, cm; Current Value: 5.07
§
One caveat is if the value is deleted, it can no longer be editted. To add a value to the (now nonexistent) entry
use the process described in section 2.2.4.
Page 7
Virginia Center for Autonomous Systems Report No. 2015-02
David William Allen
17) Wing Area, mm2; Current Value: 4840
18) Wing Area, cm2; Current Value: 48.4
19) Wing Loading, mg/mm2; Current Value: 2.2727
20) Wing Loading, g/cm2; Current Value: 0.22727
Enter number of data you want to edit (0 to exit):
Notice that the tenth entry not reads “10) Order; Current Value: This is a test”. You can
continue to edit this entry by repeating the previous process, or you can enter “0” to return to the
main menu.
2.2.4
Add data to entry
Choosing option “3: Add data to entry” at the main menu allows data that is currently missing
from an entry. For example, if entry “1066” is selected, the following is displayed,
Adding data to entry 1066
This operation is for adding absent data only. Use the "Edit Data" operation to edit
or delete extant data in the database. This program will accept either text or
numbers.
What would you like to add?
1) Comments
2) Suborder/ Subclade
3) Wing Model from source 3
4) Flight Mode
5) Flight Mode (French)
6) Primary Food Source
7) Wing-beat Rate, Hz
8) Hind Wing Length, mm
9) Length of both wings, mm
10) Length of both wings, cm
11) Wing Mass, mg
12) Wing Mass, g
13) Percent Wing Weight
14) Moment of Inertia of Wings, mg*mm2
15) Wing Span, mm
16) Wing Span, cm
17) Wing Span, m
18) Mass of muscle, mg
19) Mass of muscle, g
20) Percent Muscle Mass
21) Large Pectoral Muscle Mass, g
22) Percent Large Pectoral Mass
23) Small Pectoral Muscle Mass, g
24) Percent Small Pectoral Mass
25) Ratio Large/Small Pectoral
Page 8
Virginia Center for Autonomous Systems Report No. 2015-02
David William Allen
26) Mass of heart, mg
27) Mass of heart, g
28) Percent Heart Mass
29) Aspect Ratio
Select data you want to add (0 to exit):
Selecting one of the missing entries (for example 10) brings up the following menu
Adding "Length of both wings, cm"
Entry Instructions:
Add:
Enter a new value
Cancel: Enter 0
New Value:
Entering “0” returns the user to the previous menu and entering a value adds the data to the
database¶ . For example, if “100” is entered, the database returns
What would you like to add?
1) Comments
2) Suborder/ Subclade
3) Wing Model from source 3
4) Flight Mode
5) Flight Mode (French)
6) Primary Food Source
7) Wing-beat Rate, Hz
8) Hind Wing Length, mm
9) Length of both wings, mm
10) Wing Mass, mg
11) Wing Mass, g
12) Percent Wing Weight
13) Moment of Inertia of Wings, mg*mm2
14) Wing Span, mm
15) Wing Span, cm
16) Wing Span, m
17) Mass of muscle, mg
18) Mass of muscle, g
19) Percent Muscle Mass
20) Large Pectoral Muscle Mass, g
21) Percent Large Pectoral Mass
22) Small Pectoral Muscle Mass, g
23) Percent Small Pectoral Mass
24) Ratio Large/Small Pectoral
25) Mass of heart, mg
¶
This accepts both strings and numbers. It is highly recommended that you only enter numbers where appropriate. Failure to do so may lead to errors when plotting or extracting data.
Page 9
Virginia Center for Autonomous Systems Report No. 2015-02
David William Allen
26) Mass of heart, g
27) Percent Heart Mass
28) Aspect Ratio
Select data you want to add (0 to exit):
Notice that option 10 is now “10) Wing Mass, mg” and the option “Length of both wings, cm”
is no longer present. The value entered can now be accessed or editted as previously describedk .
2.2.5
Append entry to database
Choosing option 4 adds a new entry to the database. This entry will be added to the end of the
database. Selecting this operation brings up the following menu
This function will append a new entry to the database. This entry can either be left
blank or populated with data. In either case, the entry can be edited later using
the other database tools.
Options:
0) Cancel
1) Create blank entry
2) Create and populate entry
What would you like to do?
Enter “0” to return to the main menu, “1” to append a new entry to the end of the database, but
return to the main menu without populating it∗∗ , and “2” creates a new entry and immediately
redirects the user to the “Add data to Entry” operation†† .
2.2.6
Extract a 2D dataset
Selecting the option “5: Extract a 2D dataset” will extract a set of data from the database
that will be sorted as the user desires there are many options on selecting and categorizing data.
The data will be appended data structure under a new category called “extracted”. Selecting “5”
from the main menu brings up the following menu
Extracting a 2D dataset.
What 2D dataset do you wish to extract?
1) Wing-beat Rate, Hz
2) Mass, mg
3) Mass, g
k
See sections 2.2.2 and 2.2.3, respectively.
Data can be added to this entry later using the method describe in section 2.2.4.
††
See section 2.2.4 for instructions on how to add data this entry.
∗∗
Page 10
Virginia Center for Autonomous Systems Report No. 2015-02
David William Allen
4) Wing Length, mm
5) Wing Length, cm
6) Hind Wing Length, mm
7) Length of both wings, mm
8) Length of both wings, cm
9) Wing Area, mm2
10) Wing Area, cm2
11) Wing Mass, mg
12) Wing Mass, g
13) Percent Wing Weight
14) Moment of Inertia of Wings, mg*mm2
15) Wing Span, mm
16) Wing Span, cm
17) Wing Span, m
18) Mass of muscle, mg
19) Mass of muscle, g
20) Percent Muscle Mass
21) Large Pectoral Muscle Mass, g
22) Percent Large Pectoral Mass
23) Small Pectoral Muscle Mass, g
24) Percent Small Pectoral Mass
25) Ratio Large/Small Pectoral
26) Mass of heart, mg
27) Mass of heart, g
28) Percent Heart Mass
29) Aspect Ratio
30) Wing Loading, mg/mm2
31) Wing Loading, g/cm2
Desired x data:
The user first chooses what data will be on the x-axis (option “2” is chosen in this example), which
brings up the following prompt
Desired y data:
The user will now enter what number corresponding to the data on the y-axis (option “4” is chosen
for this example). The program will extract the 2D data automatically and return a menu similar
to
Collecting Data. This may take a few moments.
Collection Complete. There are 997 entries with the desired data.
How would you like to categorize the data?
0) Cancel (and exit)
1) Do not categorize
2) Class (e.g. avians or insects)
Page 11
Virginia Center for Autonomous Systems Report No. 2015-02
David William Allen
3) Type
(e.g. butterflies or albatrosses)
Enter the number corresponding to the desired categorization:
Notice that it informs the user of the number of data points that include the requisite data. This
prompt is asking the user how they want data categorized, which will determine what is include in
the legend. For this example, option “2” is selected. This brings up the following prompt
Do you wish to exclude data based on class? (Y/N)
If the user enters “Y”, they will be prompted with all of the classes included in the extracted data
and ask whether they want to be included. For this example, only insects, birds, and bats will be
included, which is done through the following inputs
Do you wish to exclude data based on class? (Y/N) Y
For the following classes enter 1 to include or 0 to exclude.
Insecta: 1
Mammalia: 1
Actinopterygii: 0
Aves: 1
Notice that the user is not asked whether to include reptiles (pterosaurs) because the database does
not include reptiles with the requisite data. They user is then prompted if they wish to exclude
data based on type by the prompt
Do you wish to exclude data based on type? (Y/N)
For this example, I will not exclude based on type, but the process is identical to excluding data
based on type.
The data is now extracted and the user is prompted to enter any key to return to the main menu.
It should be noted that there is not any data return to the user through this operation, nor is there
a plot a generated. The change appears in the data structure itself. A new entry in the structure
is created, which contains all of the extracted datasets as part of a cell array of separated data
structures. This data can then be used offline for further analysis. Accessing the structure displays
(for the options chosen previously) yield
xDataLabel: ’Mass, mg’
yDataLabel:
categorizationCriteria:
Classes:
Types:
all:
grouped:
’Wing Length, mm’
’Class’
[1x1 struct]
[1x1 struct]
[1x1 struct]
{[1x1 struct] [1x1 struct]
[1x1 struct]}
where “Classes” and “Types contains lists of all of the included and excluded classes and types,
respectively, “all” contains arrays of the chosen x and y data along with lists of the class and
type of each data entry, and “grouped” contains separate data structures for each of the included
categories. The “grouped” data structures include a string identifying the categorization as well as
arrays containing the desired x and y data.
Page 12
Virginia Center for Autonomous Systems Report No. 2015-02
David William Allen
2.2.7
Create a 2D plot
Selecting the option “6: Create 2D plot” will create a plot with user selected data. This operation utilizes the same structure as extracting a 2D dataset, described in section 2.2.6. Entering “6”
brings up the following menu
This operation creates a 2D plot of user selected data. Using this operation, the
user chooses what data to categorize the data by and MATLAB will separate and plot
the chosen data.
Extracting a 2D dataset.
What 2D dataset do you wish to extract?
1) Wing-beat Rate, Hz
2) Mass, mg
3) Mass, g
4) Wing Length, mm
5) Wing Length, cm
6) Hind Wing Length, mm
7) Length of both wings, mm
8) Length of both wings, cm
9) Wing Area, mm2
10) Wing Area, cm2
11) Wing Mass, mg
12) Wing Mass, g
13) Percent Wing Weight
14) Moment of Inertia of Wings, mg*mm2
15) Wing Span, mm
16) Wing Span, cm
17) Wing Span, m
18) Mass of muscle, mg
19) Mass of muscle, g
20) Percent Muscle Mass
21) Large Pectoral Muscle Mass, g
22) Percent Large Pectoral Mass
23) Small Pectoral Muscle Mass, g
24) Percent Small Pectoral Mass
25) Ratio Large/Small Pectoral
26) Mass of heart, mg
27) Mass of heart, g
28) Percent Heart Mass
29) Aspect Ratio
30) Wing Loading, mg/mm2
31) Wing Loading, g/cm2
Desired x data:
Page 13
Virginia Center for Autonomous Systems Report No. 2015-02
David William Allen
The user first chooses what data will be on the x-axis (option “2” is chosen in this example), which
brings up the following prompt
Desired y data:
The user will now enter what number corresponding to the data on the y-axis (option “4” is chosen
for this example). The program will extract the 2D data automatically and return a menu similar
to
Collecting Data. This may take a few moments.
Collection Complete. There are 997 entries with the desired data.
How would you like to categorize the data?
0) Cancel (and exit)
1) Do not categorize
2) Class (e.g. avians or insects)
3) Type (e.g. butterflies or albatrosses)
Enter the number corresponding to the desired categorization:
Notice that it informs the user of the number of data points that include the requisite data. This
prompt is asking the user how they want data categorized, which will determine what is include in
the legend. For this example, option “2” is selected. This brings up the following prompt
Do you wish to exclude data based on class? (Y/N)
If the user enters “Y”, they will be prompted with all of the classes included in the extracted data
and ask whether they want to be included. For this example, only insects, birds, and bats will be
included, which is done through the following inputs
Do you wish to exclude data based on class? (Y/N) Y
For the following classes enter 1 to include or 0 to exclude.
Insecta: 1
Mammalia: 1
Actinopterygii: 0
Aves: 1
Notice that the user is not asked whether to include reptiles (pterosaurs) because the database does
not include reptiles with the requisite data. They user is then prompted if they wish to exclude
data based on type by the prompt
Do you wish to exclude data based on type? (Y/N)
For this example, I will not exclude based on type, but the process is identical to excluding data
based on type. Now that the final dataset has been extracted, a plot can be made. The user is
prompted what type of plot they wish to generate with the following prompt
Page 14
Virginia Center for Autonomous Systems Report No. 2015-02
David William Allen
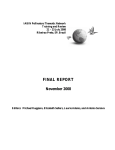
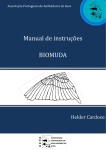
Wing Length, mm
10 3
10 2
10 1
Insecta
Mammalia
Aves
10 0
10 0
10 2
10 4
10 6
Mass, mg
Figure 1: An example plot made by the animal database.
What type of plot do you wish to create?
1) Linear
2) Semi-Log x
3) Semi-Log y
4) Log-Log
Plot type:
For this example, option “4” (a log-log) plot is chosen. This generates the following plot shown in
figure 1.
Page 15
Virginia Center for Autonomous Systems Report No. 2015-02
David William Allen
3
Known Issues
The following is a list of known issues as of November 30, 2015.
Issue
Solution/Work Around
Entering a value of “0” or No solution proposed, limita“−1” not possible while edit- tion of structure of database.
ing the data in an entry
This is not considered to be an
important issue as the physical
parameters cannot have values
of “−1” or “0”, so the only
concern is that such a value
may want to be entered as
a comment. Simply adding
comma (or any other character) after the value will allow
it to be entered.
When excluding by class or No solution. A try catch structype, if all data is excluded, ture may be added in a future
the program will crash. Any release to improve error hanchanges will be lost.
dling. Since this operation is
not part of normal operation,
it is not a major issue.
Status
No planned change
Solution known. Will be implemented in the future.
References
[1] G. L. Jepsen, R. J. Baker, T. A. Vaughan, R. T. Orr, D. R. Griffin, W. H. Davis, C. P. Lyman,
and R. M. Rosenbaum, Biology of Bats: Volume I. New York, New York, USA: Academic Press,
1 ed., 1970.
[2] C. H. Greenewalt, “Dimensional Relationships for Flying Animals,” Smithsonian miscellaneous
collections, vol. 144, no. 2, pp. 1–46, 1962.
[3] G. A. Hazlehurst and J. M. V. Rayner, “Flight Characteristics of Triassic and Jurassic
Pterosauria: An Appraisal Based on Wing Shape,” Paleobiology, vol. 18, no. 4, pp. 447–463,
1992.
[4] U. M. Norberg, “Allometry of Bat Wings and Legs and Comparison with Bird Wings,” Philosophical Transactions of the Royal Society B: Biological Sciences, vol. 292, pp. 359–398, June
1981.
[5] J. Warham, “Wing loadings, wing shapes, and flight capabilities of procellariiformes,” New
Zealand Journal of Zoology, vol. 4, pp. 73–83, Mar. 1977.
[6] J. Farney and E. D. Fleharty, “Aspect Ratio, Loading, Wing Span, and Membrane Areas of
Bats,” Journal of Mammalogy, vol. 50, pp. 362–367, May 1969.
Page 16
Virginia Center for Autonomous Systems Report No. 2015-02