1
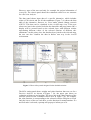
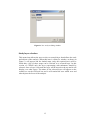
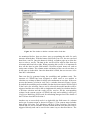
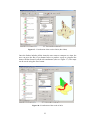
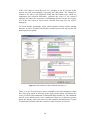
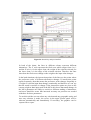
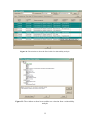
The MCA results panel (see Figure 7 (c)) enables the visualisation of
calculation results of an MCA. It allows the user to select arbitrary
combinations among different scenarios, management measures and criteria
(including categories and the overall multi-criteria value) for comparison. The
user should ensure that logical combinations of results are selected for
interpretation. There are two types of maps available for displaying the results:
One is bar chart and the other is status map. Bar chart is good for comparison
among different combination items within one geographical entity, while
status map gives an image of spatial pattern of a specific item. All these maps
are displayed in the map view window and all existing tools in the ArcGIS
platform can be used to work with them. The Animation button allows the user
to create and play an animation with the selected map layers and the Summary
button enables the user to explore the whole catchment information and to
contrast it with that of individual sub-catchments.
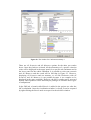
This kind of information retrieval from the DSS tab to the dockable window is
allowed to shift from one analysis to another and this makes it possible to
compare among different decision analyses.
5. Working with decision analyses
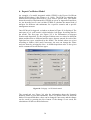
Start a new Decision Analysis
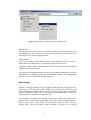
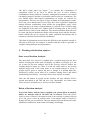
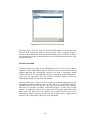
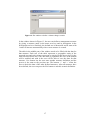
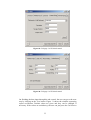
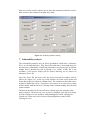
The menu item ew Analysis is enabled after a required map layer has been
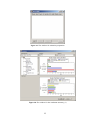
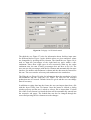
loaded. Selecting the menu item will display a window (see Figure 8) to ask
for a name for the new analysis and in the Existing Analyses listbox, the
existing analyses names are listed to avoid the same name as an existing
analysis being used. If the same name as an existing analysis is given, a
prompt will be given to request the user to change it. A default name like
AnalysisN is always given, where N is a number starting from 1 and which
automatically increases by 1 each time when a new analysis is created.
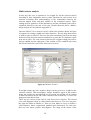
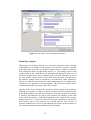
After the OK button is pressed on the window, the new analysis will be
created and added to the DSS tab tree view. Meanwhile, two menu items
Delete Analysis and Study Layer Selection will be enabled.
Delete a Decision Analysis
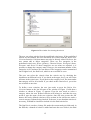
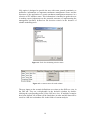
Even if the Delete Analysis item is enabled, you cannot delete an analysis
unless an analysis node in the DSS tab is selected. When the Delete
Analysis item is clicked, if an analysis node is not selected, a prompt will pop
up to ask you to select an analysis node. If an analysis node is selected, a
prompt will ask you to confirm it. Once an analysis has been deleted, the states
(disabled or enabled) of menu items will change accordingly.
12