1
StarKeeper II NMS
Graphics System Guide
255-114-762
Issue 1
Release 10.0
Copyright © 1998 Lucent Technologies
All Rights Reserved
Printed in USA
CommKit, Datakit and StarKeeper are registered trademarks of Lucent Technologies.
HP, HP-UX, HP VUE, DeskJet, LaserJet, and PaintJet are registered trademarks of
Hewlett-Packard Systems Division.
Postscript is a registered trademark of Adobe, Inc.
XGRAPH software is a registered trademark of the University of California.
Motif, Open Software Foundation, OSF/Motif, and OSF are trademarks of Open Software
Foundation, Inc.
HyperHelp is a trademark of Bristol Technology Inc.
X Window System is a trademark of the Massachusetts Institute of Technology.
The information in this document is subject to change without notice.
Lucent Technologies assumes no responsibility for any errors that may appear in this document.
This document was produced by Customer Training and Information Products (CTIP).
Contents
Preface
■
Purpose of the Document
■
Organization
■
Document Conventions
xli
■
What’s New in This Document for Release 10.0
xlii
■
Screen Displays
xlii
■
Recommended Prerequisites
xlii
■
Supported Products
xliii
■
Related Documentation
xliv
■
1
xxxvii
xxxviii
xxxix
StarKeeper® II NMS Documents
xliv
Hewlett-Packard Documents
xliv
BNS-2000 VCS Documents
xliv
BNS-2000 Documents
xliv
Additional Copies
xlv
Training
StarKeeper II NMS Graphics System Overview
xlv
1-1
■
Year 2000 Compliance
1-1
■
Graphics System Platform
1-2
■
Graphics System Platform Features
1-2
Bulletin Board
1-2
Workstation Administration
1-3
Cut-Through
1-3
Graphics System Platform Window Architecture
1-4
Bulletin Board Control Window
1-6
Workstation Administration Control Window
1-6
Cut-Through Control Window
1-8
Where Do You Go From Here?
1-9
Network Builder
Network Builder Features
Supported Products
StarKeeper II NMS Graphics System Guide R10.0, Issue 1
1-9
1-9
1-12
iii
Contents
■
■
2
iv
Network Builder Window Architecture
1-12
Where Do You Go From Here?
1-14
Network Monitor
1-15
Network Monitor Features
1-15
Supported Products
1-17
Network Monitor Window Architecture
1-17
Where Do You Go From Here?
1-22
Performance Reporter
1-23
Performance Reporter Features
1-23
Supported Products
1-26
Performance Reporter Window Architecture
1-27
Report Categories
1-28
Graphical Options
1-30
Where Do You Go From Here?
1-31
Administering the Graphics System
2-1
■
Adding HP-UX Logins
2-1
■
Adding Graphics System Users
2-1
■
Removing Graphics System Users
2-3
■
Removing Graphics System Applications Software
2-3
■
Verifying Graphics System Applications Software
2-4
■
Starting the Graphics System
2-5
■
Stopping the Graphics System
2-5
■
Core and Graphics System Communications
2-5
Administer Local Machine Parameters
2-6
Administering Connections
2-8
Verify Connection Status
2-10
Troubleshooting Failed Connections
2-10
Synchronizing Connections Data
2-12
Troubleshooting Connection Synchronization Failures
2-12
Additional Help
2-13
dkcu Error Messages
2-13
StarKeeper II NMS Graphics System Guide R10.0, Issue 1
Contents
■
3
2-13
The Host Server
2-14
Netstation Name
2-14
Network Level Addressing
2-15
Link Level Addressing
2-15
Administration on the Host Server
2-15
Administration on the Netstation
2-17
Changing your Startup Host
2-19
Using your 720/730 as a Netstation
2-19
Using the StarKeeper II NMS Graphics System
3-1
■
Starting Graphics Applications
3-1
■
Accessing The OS Environment
3-4
■
Printing
3-4
Capturing Images
3-4
Printing XwdCapture Files
3-5
■
Accessing Your Directory
3-5
■
Logging Off
3-5
■
Special HP VUE and Motif Capabilities
3-5
■
4
Netstation Administration
Style Manager
3-5
Workspaces
3-6
Using Scales
3-7
Keyboard Shortcuts
3-7
Graphics System Applications HyperHelp
Using the Bulletin Board Application
3-8
4-1
■
Starting the Bulletin Board Application
4-1
■
The Bulletin Board Control Window
4-2
■
Reading Bulletin Board Messages
4-3
■
Checking the EVENTLOG
4-3
StarKeeper II NMS Graphics System Guide R10.0, Issue 1
v
Contents
5
Using the Workstation Administration Application
■
Starting Workstation Administration
5-1
■
The Workstation Administration Control Window
5-2
The Administer Menu
■
6
5-3
Adding, Deleting, or Modifying Connections
5-3
Synchronizing Connection Data
5-6
Modifying Local Connection Parameters
5-6
The Disk Cleaner Administration Window
5-8
■
The Cut-Through Administration Window
5-11
■
Viewing Connection Status
5-13
Using the Cut-Through Application
6-1
■
Starting the Cut-Through Application
6-1
■
The Cut-Through Control Window
6-2
The File Menu
6-3
The Connect Button
6-3
The Authorize Button
6-4
The Computers Scrolling List
6-4
The Cut-Through Application Connection Window
6-4
The Cut-Through Authorization Window and Automatic Login
6-5
Dismissing Connection and Authorization Windows
6-7
The Add-On Computers Window
6-7
Administering Network Builder
7-1
■
vi
SK II Connections Administration
5-2
■
■
7
5-1
■
Adding Users
7-1
■
Removing Users
7-1
■
Network Builder Tuning
7-1
StarKeeper II NMS Graphics System Guide R10.0, Issue 1
Contents
8
Using Network Builder to Configure Your Network
■
Starting Network Builder for Configuration
Configuration Activity Log
■
■
■
■
■
■
8-1
8-3
8-3
The Configuration Form Base Window
8-5
Control Area Menus and Buttons
8-6
Configuration Forms
8-10
Key and Data Panes
8-11
Message Area
8-12
Notices
8-14
Configuration Work Flow
8-14
The New Operation, to Add a Network Element
8-15
The Load Operation, to View or Modify an Existing
Database Record
8-19
The Delete Operation
8-22
Canceling a Task
8-24
Operator Tips
8-24
Verifying Data before Deleting
8-24
Using Current Data (the Defaults Control)
8-25
The Copy Feature
8-25
The Move (Trunk) Feature
8-25
Using the Configuration Activity Log to Access Forms
8-26
Resubmitting Failed Tasks
8-26
Choose Command Windows
8-27
Cut-Through
8-29
List Editing Controls
8-29
Configuring StarKeeper II NMS Connections
8-31
Background Information
8-31
Task Notes
8-33
NMS Connection Parameters
8-34
Special Considerations
8-35
Configuring Nodes
8-37
Background Information
8-37
Task Notes
8-38
StarKeeper II NMS Graphics System Guide R10.0, Issue 1
vii
Contents
■
■
■
■
■
■
viii
Node Parameters
8-40
Node Reports
8-47
Special Considerations
8-48
Configuring Trunks
8-51
Background Information
8-51
Task Notes
8-52
Trunk Parameters
8-54
Trunk Reports
8-57
Trunk Trouble Recovery Procedures
8-58
Special Considerations
8-61
Configuring Groups
8-63
Background Information
8-63
Group Parameters
8-64
Special Considerations
8-64
Configuring Service Addresses
8-65
Background Information
8-65
Security Mechanisms
8-67
Task Notes
8-68
Service Address Parameters
8-68
Generating Node Reroute Tables
8-71
Background Information
8-72
Task Notes
8-73
NRT Parameters
8-73
NRT Generation Report
8-74
NRT Trouble Recovery Procedures
8-74
Special Considerations
8-75
Configuring SNIs
8-77
Background Information
8-77
Task Notes
8-78
SNI Parameters
8-79
SNI Reports
8-82
SNI Trouble Recovery Procedures
8-86
Special Considerations
8-88
Configuring ICI Carriers
8-91
StarKeeper II NMS Graphics System Guide R10.0, Issue 1
Contents
■
■
■
9
Background Information
8-92
Task Notes
8-93
ICI Carrier Parameters
8-94
ICI Carrier Reports
8-94
Special Considerations
8-94
Configuring ICI Prefixes
8-97
Background Information
8-98
Task Notes
8-99
ICI Prefix Parameters
8-100
ICI Prefix Reports
8-100
Special Considerations
8-101
Configuring ICI Group Addresses
8-103
Background Information
8-104
Task Notes
8-105
ICI Group Address Parameters
8-105
ICI Group Address Reports
8-106
Special Considerations
8-108
Configuring Frame Relay Service
8-109
Using Existing Configuration Data
8-109
Administering Custom IDs
8-111
Reports
8-114
Special Considerations
8-115
General Trouble Recovery Procedure
8-116
Configuring FRM and FRM-M2 Frame Relay Modules
8-117
Configuring Frame Relay Ports
8-122
Configuring Frame Relay Multicast DLCIs
8-134
Configuring Frame Relay PVCs
8-135
Using Network Builder to Analyze Your Network
9-1
■
Overall Functions
9-1
■
Connectivity Analysis
9-2
Designs
StarKeeper II NMS Graphics System Guide R10.0, Issue 1
9-3
ix
Contents
Network Structure
9-3
Topology Evaluation
9-4
Routing Evaluation
9-5
Differences Between Topology Evaluation and
Routing Evaluation
9-6
Path Analysis
9-6
■
Session Maintenance Simulation Tool
9-8
■
Using the Connectivity Analysis Tools
9-8
Constraints
Connectivity Analysis User Interface Controls
■
■
■
Connectivity Analysis Procedures
9-10
9-21
Starting Network Builder for Connectivity Analysis
9-22
Analyze a New Network
9-23
Analyze an Existing Network
9-35
Perform ''What If...'' Analysis
9-39
Connectivity Analysis Input and Output Data
9-43
Input Reports
9-43
Output Reports
9-47
Input and Output Report Data Fields
9-59
Using the Session Maintenance Simulation Tool
Session Maintenance Simulation User Interface Controls
9-62
9-62
■
Session Maintenance Simulation Procedure
9-64
■
Session Maintenance Simulation Output Reports
9-69
■
x
9-8
Summary Report
9-70
Detailed Report
9-74
Engineering Data Report
9-76
Connectivity Analysis Example
9-78
The net_2000 Network
9-78
The Network Topology
9-79
Initial Routing
9-80
Initial Topology Evaluation
9-80
Performing ''What If ...'' Analysis
9-85
StarKeeper II NMS Graphics System Guide R10.0, Issue 1
Contents
10
Administering Network Monitor
10-1
■
Adding Users
10-1
■
Removing Users
10-1
■
Tutorial on Map Hierarchy
10-2
■
Map Hierarchy Principles
10-3
■
Map Hierarchy Definition
10-3
Hierarchical Addressing
10-4
Trickle-Up
10-4
Highest Severity Alarm(s)
10-6
Phase I: Planning a Map Hierarchy on Paper
Step 1: Identify Network Equipment
■
■
■
10-7
10-7
Step 2: Place All Equipment on A Paper Map
10-10
Step 3: Decide on Equipment Grouping
10-13
Step 4: Plan for Scratch Pad Information
10-16
Step 5: Decide on Detailed Maps
10-16
Step 6: Decide on Shelf Maps
10-18
Step 7: Sketch the Map Hierarchy
10-19
Phase II: Building a Map Hierarchy with Network Monitor
10-22
Step 1: Setting Up Connections to StarKeeper II NMS
10-23
Step 2: Synchronizing the Database(s)
10-23
Step 3: Starting Network Monitor
10-24
Step 4: Starting the Map Editor
10-24
Step 5: Creating the Top Map
10-26
Step 6: Setting the Top Map Parameter
10-38
Step 7: Editing a Regional Map
10-39
Step 8: Editing a Detailed Map of tx3 Node
10-48
Step 9: Editing a Detailed Map for TrkAggr1
10-51
Step 10 Generating Shelf Maps
10-52
Step 11: Testing Maps Checklist
10-55
Defining User Notices
10-56
Defining User Notices for BNS-2000 Messages
10-58
Using Wildcards in Network Addressing
10-58
Specifying Alarm Filters
StarKeeper II NMS Graphics System Guide R10.0, Issue 1
10-60
xi
Contents
11
10-60
Synchronizing Alarms
10-62
■
Updating Maps
10-63
■
Distributing Maps to Other Graphics Systems
10-63
Using Network Monitor
11-1
■
Tutorial on Monitoring the Network
11-2
■
Generic Monitoring Guidelines
11-4
■
Step 1: Accessing StarKeeper II NMS
11-5
■
Step 2: Starting Network Monitor
11-6
■
Step 3: Starting to Monitor the Network
11-6
■
Example I: A Host Computer Problem
11-7
■
■
xii
Editing the Alarm Filter File
Step 1: Check Network Status Window
11-8
Step 2: Check Top Map
11-9
Step 3: Display Regional Map
11-9
Step 4: Display Detailed Map of tx3 Node
11-11
Step 5: Display Shelf Level Map
11-12
Step 6: Display List Alarms Window
11-13
Step 7: Determine the Problem
11-14
Step 8: Clear Alarms
11-14
Example II: A Trunk Problem
11-15
Step 1: Check Network Status Window
11-15
Step 2: Check Top Map
11-16
Step 3: Display List Alarms Window
11-16
Step 4: Display Textual Detail for an Alarm
11-16
Step 5: Display Alarm Help
11-17
Step 6: Run Diagnostics
11-18
Step 7: Clear Alarms
11-21
Night Fold-Down
11-21
Activate Connections
11-22
Deactivate Connections
11-22
Network Maps and Night Fold-Down
11-22
StarKeeper II NMS Graphics System Guide R10.0, Issue 1
Contents
12
Network Monitor User Reference
12-1
■
Window Architecture
12-1
■
Control Window
12-2
■
■
■
■
■
Monitor Menu
12-2
Administer Menu
12-6
Define User Notices
12-9
Using Wildcards in Network Addressing
12-10
Administer Maps
12-11
Edit Maps Window
12-14
File
12-15
Exit
12-18
Edit
12-18
Options
12-27
View Network Status Window
12-30
File
12-31
View
12-31
Options
12-32
Alarm Severity Notices
12-32
User Notices
12-32
Network Map Window
12-33
File
12-34
Commands Menu
12-34
View Menu
12-36
Options Menu
12-37
List Alarms Window
12-37
File Menu
12-38
Commands Menu
12-39
View Menu
12-40
Help Menu
12-41
Selected Alarm Help
12-42
Alarm List is Frozen/Unfrozen
12-42
Alarm Bell is On/Off
12-43
Diagnostics Window
StarKeeper II NMS Graphics System Guide R10.0, Issue 1
12-43
xiii
Contents
13
File Menu
12-43
Commands Menu
12-43
Diagnostic Window Field Descriptions
12-45
Administering Performance Reporter
■
Adding Users
13-1
■
Removing Users
13-1
■
Administering Performance Data on the Core System
13-1
■
Administering the Threshold Feature
13-1
■
■
Activating the Thresholding Feature
13-2
Deactivating the Thresholding Feature
13-3
Setting Threshold Values
xiv
13-5
Changing Threshold Values
13-5
Including or Excluding Items from Exception Reports
13-7
Updating Configuration Data
Updating Configuration Data Via a Cron File
14
13-1
13-8
13-9
■
Specifying the Retention Period for Filed Reports
13-11
■
Troubleshooting Performance Reporter
13-12
Using Performance Reporter for Routine Performance
Assurance
14-1
■
The Performance Reporter Control Window
14-2
■
Accessing Exception Reports
14-2
Daily Exception Report - Summary
14-2
Daily Exception Report - Detail
14-5
■
Requesting On-demand Reports
14-7
■
Troubleshooting Performance Problems
14-12
■
Fixing Performance Problems
14-13
■
Examples
14-14
Error Free Transmission (EFT) Thresholds
14-14
Peak and Average Trunk Utilization Thresholds
14-15
StarKeeper II NMS Graphics System Guide R10.0, Issue 1
Contents
15
Contention Failure Thresholds
14-15
Security Failure Thresholds
14-16
Peak Connection Utilization Thresholds
14-16
Frame Relay Thresholds
14-17
Using Performance Reporter for Long-Term Traffic
Engineering
■
The Performance Reporter Control Window
15-2
■
Requesting Scheduled Reports (Bandwidth Utilization Link)
15-2
■
Scenario
15-7
■
Examples
15-7
Bandwidth Utilization Trunk/Link
15-8
Bandwidth Utilization Node
15-8
Port Capacity Utilization
15-9
Network Availability Trunk/Node
16
Managing Performance Reporter Files and Requests
■
■
17
15-1
Managing Filed Reports
■
16-1
16-1
Managing On-demand Filed Reports
16-2
Managing Scheduled Filed Reports
16-4
Managing Report Requests
Performance Reporter: Report Examples and
Interpretation
■
15-10
Report Types
16-5
17-1
17-2
Tabular reports:
17-2
Graphical Reports
17-3
Report Categories
Bandwidth Utilization
StarKeeper II NMS Graphics System Guide R10.0, Issue 1
17-5
17-5
xv
Contents
■
■
■
Connection Utilization
17-6
Port Capacity Utilization
17-7
Network Availability
17-7
Module Performance
17-7
Bandwidth Utilization Reports
Bandwidth Utilization Trunk Report
17-8
Bandwidth Utilization Link Report
17-9
Bandwidth Utilization Node Report
17-10
Bandwidth Utilization Shelf Report
17-11
Connection Utilization Reports
■
17-13
Connection Utilization Receiving Group Report
17-14
Connection Utilization Trunk Group Report
17-16
Connection Utilization X.25 Report
17-17
Connection Utilization Node Report
17-18
Port Capacity Utilization Reports
Frame Relay Report
■
17-8
Network Availability Reports
17-20
17-20
17-25
Network Availability Node Report
17-25
Network Availability Trunk Report
17-26
Module Performance Reports
Module Performance Frame Relay Report
17-28
17-28
A
Manual Pages
A-1
B
Graphics System Platform Error Messages
B-1
C
Network Monitor Error Messages
C-1
xvi
■
How to Read the Error Messages
C-1
■
How Error Messages Are Displayed
C-2
StarKeeper II NMS Graphics System Guide R10.0, Issue 1
Contents
Notice Windows
C-2
Bulletin Board
C-2
System EVENTLOG
C-2
■
Network Monitor Processes
C-2
■
Recommended Actions
C-4
■
Error Messages from the Network Monitor Control Window
C-8
■
Error Messages from the Network Status and Network
Map Windows
C-11
■
Error Messages from the List Alarms Window
C-13
■
Error Messages from the Diagnostics Window
C-16
■
Error Messages from the Display Info Window
C-18
■
Error Messages from the Edit Maps Window
C-19
■
Error Messages from the Alarm Collector Process
C-21
■
Error Messages from the Clear Alarms Process
C-24
■
Error Messages from the Shelf Map Generation Process
C-25
■
Table of HP-UX System Error Codes
C-28
■
Table of SCP Error Codes
C-30
D
Performance Reporter Error Messages
GL
Glossary
IN
Index
StarKeeper II NMS Graphics System Guide R10.0, Issue 1
D-1
GL-1
Index-1
xvii
Contents
xviii
StarKeeper II NMS Graphics System Guide R10.0, Issue 1
Figures
1
StarKeeper II NMS Graphics System Overview
Figure 1-1.
Graphics System Platform Window Architecture
Figure 1-2.
Network Builder Window Architecture
1-13
Figure 1-3.
Network Monitor Window Architecture
1-18
Figure 1-4.
Performance Reporter Window Architecture
1-27
2
Administering the Graphics System
Figure 2-1.
Administered Connections in a Network
9
Using Network Builder to Analyze Your Network
Figure 9-1.
Example Network Layout
10
Administering Network Monitor
Figure 10-1.
Window Architecture
10-2
Figure 10-2.
Symbols Point Down to Lower-Level Maps
10-5
Figure 10-3.
Alarms Trickle up to Symbols on Higher-Level Maps
10-5
Figure 10-4.
Planning Background of Top Map
10-11
Figure 10-5.
Planning the Top Map
10-12
Figure 10-6.
Planned Top Map
10-14
Figure 10-7.
Planned Regional Maps
10-15
Figure 10-8.
Planned Detailed Map for Node tx3
10-17
Figure 10-9.
Planned Detailed Map for Trunk Aggregate Symbol
10-18
Figure 10-10.
Planned Map Hierarchy
10-20
StarKeeper II NMS Graphics System Guide R10.0, Issue 1
1-5
2-9
9-78
xix
Figures
11
Figure 11-1.
Using Network Monitor
Window Architecture
12
Network Monitor User Reference
Figure 12-1.
Window Architecture
xx
11-2
12-1
StarKeeper II NMS Graphics System Guide R10.0, Issue 1
Tables
1
StarKeeper II NMS Graphics System Overview
Table 1-1.
Alarm Colors
2
Administering the Graphics System
Table 2-1.
StarKeeper II NMS Machine Parameters
8
Using Network Builder to Configure Your Network
Table 8-1.
The File Menu, Operations
9
Using Network Builder to Analyze Your Network
Table 9-1.
Differences Between Topology Evaluation and Routing Evaluation
Table 9-2.
Error Conditions Listed in Database Validation Report
9-26
Table 9-3.
Input and Output Report Data Fields
9-59
Table 9-4.
Session Maintenance Simulation Summary Report Fields
9-73
Table 9-5.
Session Maintenance Simulation Detailed Report Fields
9-75
Table 9-6.
Session Maintenance Simulation Engineering Data Report Fields
9-77
10
Administering Network Monitor
Table 10-1.
Phase I: Planning a Map Hierarchy on Paper
10-7
Table 10-2.
Nodes and Systems in Sample Network
10-8
Table 10-3.
Trunks in Sample Network
10-9
Table 10-4.
Concentrators/SAMs in Sample Network
10-10
Table 10-5.
Connections to Other Systems in Sample Network
10-10
Table 10-6.
Phase II: Steps for Building a Map Hierarchy
10-22
Table 10-7.
Steps for Testing Map Hierarchy
10-55
StarKeeper II NMS Graphics System Guide R10.0, Issue 1
1-20
2-7
8-8
9-6
xxi
Tables
11
Using Network Monitor
Table 11-1.
Steps for Monitoring a Network
11-3
Table 11-2.
Generic Monitoring Guidelines
11-4
12
Network Monitor User Reference
Table 12-1.
Network Address Examples
Table 12-2.
Message ID Examples
12-11
Table 12-3.
Editor Legend Symbol Explanation
12-26
Table 12-4.
Alarm Colors
12-32
17
Performance Reporter: Report Examples and Interpretation
Table 17-1.
Report Types
C
Network Monitor Error Messages
Table C-1.
Network Monitor Processes
C-3
Table C-2.
Recommended Actions
C-4
Table C-3.
Error Messages from the Network Monitor Control Window
C-8
Table C-4.
Error Messages from Network Status and Network Map Windows
C-11
Table C-5.
Error Messages from the List Alarms Window
C-13
Table C-6.
Error Messages from the Diagnostics Window
C-16
Table C-7.
Error Messages from the Display Info Window
C-18
Table C-8.
Error Messages from the Edit Maps Window
C-19
Table C-9.
Error Messages from the Alarm Collector Process
C-21
Table C-10.
Error Messages from the Clear Alarms Process
C-24
Table C-11.
Error Messages from the Shelf Map Generation Process
C-25
Table C-12.
HP-UX System Error Codes
C-28
Table C-13.
SCP Error Codes
C-30
xxii
12-4
17-2
StarKeeper II NMS Graphics System Guide R10.0, Issue 1
Procedures
2
Administering the Graphics System
Procedure 2-1.
Procedure 2-2.
Procedure 2-3.
Procedure 2-4.
Procedure 2-5.
Procedure 2-6.
Procedure 2-7.
Procedure 2-8.
Procedure 2-9.
Adding Graphics System Users
Removing Graphics System Users
Removing Graphics System Software
Verifying Graphics System Software
Adding a Netstation to a Host Server
Removing a Netstation From a Host Server
Administering a Netstation
Changing Your Startup Host
Using Your 720/730 as a Netstation
3
Using the StarKeeper II NMS Graphics System
Procedure 3-1.
Procedure 3-2.
Using the Capture Screen Utility
Printing a File
4
Using the Bulletin Board Application
Procedure 4-1.
Procedure 4-2.
Procedure 4-3.
Procedure 4-4.
Starting Bulletin Board from the HP VUE Front Panel
Starting Bulletin Board from the StarKeeper II NMS Subpanel
Reading Bulletin Board Messages
Checking the EVENTLOG
5
Using the Workstation Administration Application
Procedure 5-1.
Procedure 5-2.
Procedure 5-3.
Procedure 5-4.
Procedure 5-5.
Starting Workstation Administration
Using the Modify Connections Data Window
Using the Modify Local Parameters Window
Using the Disk Cleaner Administration Window
Using the Cut-Through Administration Window
StarKeeper II NMS Graphics System Guide R10.0, Issue 1
2-2
2-3
2-4
2-4
2-15
2-17
2-17
2-19
2-19
3-4
3-5
4-1
4-1
4-3
4-4
5-1
5-5
5-8
5-10
5-12
xxiii
Procedures
6
Using the Cut-Through Application
Procedure 6-1.
Procedure 6-2.
Procedure 6-3.
Procedure 6-4.
Procedure 6-5.
Starting Cut-Through
Using the Connection Window
Automatic Login Procedure
Dismissing Connection and Authorization Windows
from a Window
Using the Add-On Computers Window
7
Administering Network Builder
Procedure 7-1.
Setting Network Builder Tunable Parameters
8
Using Network Builder to Configure Your Network
Procedure 8-1.
Procedure 8-2.
Procedure 8-3.
Procedure 8-4.
Procedure 8-5.
Procedure 8-8.
Procedure 8-9.
Existing Trunk Configuration Failure
New Trunk Configuration Failure
Nodes Failed, or Trunks to the Nodes Failed
Node Database Update for the NRT Failed
StarKeeper II NMS Core System Database Update
for the NRT Failed
SNI Trouble Recovery Scenario 1: Node Update Failure
SNI Trouble Recovery Scenario 2: Incomplete
Node/NMS Updates
SNI Trouble Recovery Scenario 3: New SNI Failure
SNI Trouble Recovery Scenario 4: Unknown Node Data Loss
9
Using Network Builder to Analyze Your Network
Procedure 9-1.
Procedure 9-2.
Procedure 9-3.
Starting Network Builder for Connectivity Analysis
Analyze a New Network
Analyze an Existing Network
Procedure 8-6.
Procedure 8-7.
xxiv
6-1
6-4
6-6
6-7
6-9
7-2
8-58
8-59
8-75
8-75
8-75
8-87
8-87
8-88
8-88
9-22
9-23
9-36
StarKeeper II NMS Graphics System Guide R10.0, Issue 1
Procedures
Procedure 9-4.
Procedure 9-5.
Perform ''What If...'' Analysis
Run Session Maintenance Simulation
10
Administering Network Monitor
Procedure 10-1.
Procedure 10-2.
Procedure 10-3.
Procedure 10-4.
Procedure 10-5.
Procedure 10-6.
Procedure 10-7.
Procedure 10-8.
Procedure 10-9.
Procedure 10-10.
Procedure 10-11.
Procedure 10-12.
Procedure 10-13.
Procedure 10-14.
Procedure 10-15.
Procedure 10-16.
Procedure 10-17.
Procedure 10-18.
Procedure 10-19.
Procedure 10-20.
Procedure 10-21.
Procedure 10-22.
Procedure 10-23.
Procedure 10-24.
Procedure 10-25.
Procedure 10-26.
Procedure 10-27.
Procedure 10-28.
Procedure 10-29.
Procedure 10-30.
Starting the Map Editor
Adding Background for Top Map
Adding Aggregate Location Symbols
Setting the Map Pointer for Texas Aggregate Location Symbol
Adding the Label for Texas Aggregate Location Symbol
Adding StarKeeper II NMS Symbols
Adding Trunks
Moving a Label
Adding the Trunk Aggregate Symbol
Setting the Map Pointer for Trunk Aggregate Symbol
Setting the Map Title for Top Map
Saving the Top Map
Setting Top Map Parameter
Loading a Regional Map
Adding Background for Regional Map
Adding Nodes
Adding Other Systems
Adding a Concentrator/SAM
Adding a Concentrator/SAM Link
Adding Other Connecting Symbols
Adding Scratch Pad Information
Setting the Map Pointer for a Node Symbol
Setting the Map Title for Texas Regional Map
Saving the Regional Map
Loading a Regional Map of tx3 Node
Adding Unmonitored Objects
Loading a Detailed Map of TRKAggr1
Generating Shelf Maps for All Nodes
Generating Shelf Maps for Selected Nodes
Generating Shelf Maps for All Concentrator/SAMs
StarKeeper II NMS Graphics System Guide R10.0, Issue 1
9-40
9-65
10-24
10-26
10-27
10-29
10-30
10-31
10-33
10-35
10-35
10-36
10-37
10-38
10-38
10-39
10-39
10-40
10-41
10-42
10-44
10-45
10-46
10-47
10-47
10-48
10-48
10-49
10-51
10-52
10-53
10-53
xxv
Procedures
Procedure 10-31.
Procedure 10-32.
Procedure 10-33.
Procedure 10-34.
Procedure 10-35.
Generating Shelf Maps for Selected Concentrators/SAMs
Defining User Notices
Specifying Alarm Filters
Synchronizing Alarms
Distributing All Maps
11
Using Network Monitor
Procedure 11-1.
Procedure 11-2.
Procedure 11-3.
Procedure 11-4.
Procedure 11-5.
Starting to Monitor the Network
Display Regional Map in a New Network Map Window
Display List Alarms Window
Clearing Alarms
Using Diagnose for a Trunk
12
Network Monitor User Reference
Procedure 12-1.
Selecting Multiple Ranges in Lists
13
Administering Performance Reporter
Procedure 13-1.
Procedure 13-2.
Procedure 13-3.
Procedure 13-4.
Procedure 13-5.
Procedure 13-6.
Activating the Thresholding Feature
Deactivating the Thresholding Feature
Changing Threshold Values
Including or Excluding Items from Exception Reports
Updating Configuration Data
Updating Configuration Data via a Cron File
14
Procedure 14-1.
Procedure 14-2.
Procedure 14-3.
xxvi
10-54
10-56
10-61
10-62
10-64
11-6
11-10
11-13
11-14
11-21
12-5
13-2
13-4
13-5
13-7
13-8
13-10
Using Performance Reporter for Routine Performance
Assurance
Accessing a Daily Exception Report - Summary
Accessing a Daily Exception Report - Detail
Requesting On-demand Reports
14-2
14-5
14-7
StarKeeper II NMS Graphics System Guide R10.0, Issue 1
Procedures
15
Using Performance Reporter for Long-Term Traffic
Engineering
Procedure 15-1.
Requesting Scheduled Reports (Link Bandwidth Utilization)
16
Managing Performance Reporter Files and Requests
Procedure 16-1.
Procedure 16-2.
Procedure 16-3.
Managing On-demand Filed Reports
Managing Scheduled Filed Reports
Managing Report Requests
StarKeeper II NMS Graphics System Guide R10.0, Issue 1
15-2
16-2
16-4
16-6
xxvii
Procedures
xxviii
StarKeeper II NMS Graphics System Guide R10.0, Issue 1
Screens
3
Using the StarKeeper II NMS Graphics System
Screen 3-1.
Screen 3-2.
Screen 3-3.
Screen 3-4.
Screen 3-5.
Screen 3-6.
HP VUE Front Panel
StarKeeper II NMS Graphics System Control
StarKeeper II NMS Graphics System Subpanel
Style Manager Control
Scale Example
Help Facility Menu
4
Using the Bulletin Board Application
Screen 4-1.
The Bulletin Board Control Window
5
Using the Workstation Administration Application
Screen 5-1.
Screen 5-2.
Screen 5-3.
Screen 5-4.
Screen 5-5.
Screen 5-6.
Screen 5-7.
Workstation Administration Control Window
Administer Menu
Add/Delete/Modify Connections Window
Modify Local Parameters Window
Disk Cleaner Administration Window
Cut-Through Administration Window
Connection Status Window
6
Using the Cut-Through Application
Screen 6-1.
Screen 6-2.
Screen 6-3.
Screen 6-4.
Screen 6-5.
Cut-Through Control Window
Cut-Through Control Window with File Option
Connection Window
Authorization Window
Add-On Computers Window
StarKeeper II NMS Graphics System Guide R10.0, Issue 1
3-1
3-2
3-3
3-6
3-7
3-8
4-2
5-2
5-2
5-4
5-7
5-9
5-11
5-13
6-2
6-3
6-5
6-6
6-8
xxix
Screens
7
Administering Network Builder
Screen 7-1.
Network Builder Administer Window
8
Using Network Builder to Configure Your Network
Screen 8-1.
Screen 8-2.
Screen 8-3.
Screen 8-4.
Screen 8-5.
Screen 8-6.
Screen 8-7.
Screen 8-8.
Screen 8-9.
Screen 8-10.
Screen 8-11.
Screen 8-12.
Screen 8-13.
Screen 8-14.
Screen 8-15.
Screen 8-16.
Screen 8-17.
Screen 8-18.
Screen 8-19.
Screen 8-20.
Screen 8-21.
Screen 8-22.
Screen 8-23.
Screen 8-24.
Screen 8-25.
Screen 8-26.
Screen 8-27.
Screen 8-28.
Screen 8-29.
Network Builder Control Window
An Example Configuration Activity Log
Configure Menu
The Group Configuration Base Window (Initial Appearance)
The File Menu
Sample Task Log
Key and Data Panes
Sample Confirmation Notice (for an unsubmitted update)
New Command Window
Submit Command Window
Load Command Window
Delete Command Window
Accessing a Choose Command Window
Choose Command Window
NMS Connections Configuration Form
Node Configuration Form, Node Info Pane
Trunk Configuration Form, End Node Pane
Group Configuration Form
Service Address Configuration Form
NRT Configuration Form
An Example NRT Generation Report
SNI Configuration Form
Configuration Report
Group Members Report
ICI Carrier Configuration Form
ICI Prefixes Configuration Form
ICI Prefix Configuration Report
ICI Group Addresses Configuration Form
ICI Group Address Configuration Report
xxx
7-2
8-3
8-4
8-5
8-6
8-7
8-10
8-12
8-14
8-16
8-18
8-21
8-23
8-27
8-28
8-34
8-38
8-54
8-63
8-66
8-72
8-74
8-78
8-85
8-86
8-92
8-98
8-100
8-104
8-107
StarKeeper II NMS Graphics System Guide R10.0, Issue 1
Screens
Screen 8-30.
Screen 8-31.
Screen 8-32.
Screen 8-33.
Screen 8-34.
Screen 8-35.
Screen 8-36.
M1 Frame Relay Module Configuration Form (cht1)
M2 Frame Relay Module Configuration Form (cht1)
M1 Frame Relay Port Configuration Form (che1)
M2 Frame Relay Physical Port Configuration Form (cht1)
M2 Frame Relay Virtual Port Configuration Form (cht1)
Frame Relay Multicast DLCI Configuration Form
Frame Relay PVC Configuration Form (PVC Pane)
9
Using Network Builder to Analyze Your Network
Screen 9-1.
Screen 9-2.
Screen 9-3.
Screen 9-4.
Screen 9-5.
Screen 9-6.
Screen 9-7.
Screen 9-8.
Screen 9-9.
Screen 9-10.
Screen 9-11.
Screen 9-12.
Screen 9-13.
Screen 9-14.
Screen 9-15.
Screen 9-16.
Screen 9-17.
Connectivity Analysis Base Window Controls
Report Viewing Window
Node Address Input Data Pane
Topology Input Data Pane
Routing Input Data Pane
New Design Command Window
Run Topology Evaluation Command Window
Run Path Analysis Command Window
File: Save Design Command Window
Save Design Notice
Run Routing Evaluation Command Window
Node Address and Topology Input Report
Routing Input Report
Database Validation Report
Topology Evaluation Report: Destination Routing
Topology Evaluation Report: Trunk Group Use
Topology Evaluation Report: Extended Routing
Recommendations
Topology Evaluation Report: Source Routing
Routing Evaluation Report: Routing Errors
Routing Evaluation Report: Destination Routing
Routing Evaluation Report: Source Routing
Path Analysis Summary Report
Path Analysis Detailed Report
Session Maintenance Simulation Tool: Control Area
Session Maintenance Base Window after Load
Screen 9-18.
Screen 9-19.
Screen 9-20.
Screen 9-21.
Screen 9-22.
Screen 9-23.
Screen 9-24.
Screen 9-25.
StarKeeper II NMS Graphics System Guide R10.0, Issue 1
8-118
8-121
8-123
8-127
8-130
8-134
8-137
9-10
9-14
9-17
9-18
9-20
9-24
9-29
9-32
9-34
9-34
9-37
9-44
9-45
9-46
9-48
9-49
9-50
9-51
9-53
9-55
9-56
9-57
9-58
9-62
9-67
xxxi
Screens
Screen 9-26.
Screen 9-27.
Screen 9-28.
Screen 9-29.
Screen 9-30.
Screen 9-31.
Screen 9-32.
Screen 9-33.
Screen 9-34.
Screen 9-35.
Screen 9-36.
Screen 9-37.
Screen 9-38.
Screen 9-39.
Summary Report (Sequential, ALL)
Summary Report (Sequential, List)
Summary Report (Concurrent)
Summary Report (Overlap)
View: Detailed Report
View: Engineering Data Report
Node Address & Topology Input Report
Initial Routing Input Report
Destination Routing Report Shows Errors
Source Routing Report Gives Error-Free Routing
Path Analysis Report Shows Blocked Paths
Destination Routing Report with Node Diversity
Destination Routing Report with Error-Free Routing
Path Analysis Report with Node-Diverse Routing
10
Administering Network Monitor
Screen 10-1.
Screen 10-2.
Screen 10-3.
Screen 10-4.
Screen 10-5.
Screen 10-6.
Screen 10-7.
Screen 10-8.
Screen 10-9.
Screen 10-10.
Screen 10-11.
Screen 10-12.
Screen 10-13.
Screen 10-14.
Screen 10-15.
Screen 10-16.
Screen 10-17.
Network Monitor Control Window
Edit Maps Window
Choosing Background
Adding Background for Top Map
Editor Legend
Adding Aggregate Location Symbols
Setting a Map Pointer for an Aggregate Location Symbol
Adding Label for Texas Aggregate Location Symbol
Picking Equipment from a List
Picking Trunks from a List
Adding Trunks and Trunk Aggregate Symbols
Adding Nodes
Adding Other Systems
Adding Trunks and Labels
Adding Scratch Pad Information
Adding Unmonitored Objects and Connections
Adding Trunks to a Detailed Map of TrkAggr1
xxxii
9-70
9-71
9-72
9-73
9-74
9-76
9-79
9-80
9-81
9-82
9-83
9-84
9-85
9-86
10-24
10-25
10-26
10-27
10-28
10-29
10-30
10-31
10-32
10-34
10-37
10-40
10-42
10-44
10-46
10-50
10-51
StarKeeper II NMS Graphics System Guide R10.0, Issue 1
Screens
Screen 10-18.
Screen 10-19.
Define User Notices Window
Alarm Filters File
11
Using Network Monitor
Screen 11-1.
Screen 11-2.
Screen 11-3.
Screen 11-4.
Screen 11-5.
Screen 11-6.
Screen 11-7.
Screen 11-8.
Screen 11-9.
Screen 11-10.
Screen 11-11.
Screen 11-12.
Screen 11-13.
Screen 11-14.
HP VUE Control Window
Network Status Window and Network Map Window
Network Status Window with Alarms
Network Map Window with Major Alarm
Regional Map of Texas with Major Alarm
Detailed Map of Node USA/TX/Austin/tx3
Shelf Level Map: Series M1 and M2 Shelves
List Alarms Window
Network Status Window with Major Trunk Alarms
Network Status Window, Choosing Trunks User Notice
List Alarms Window, Display Detail
List Alarms Window, Help
Diagnostics Window
Output Window for the Dstat Command
12
Network Monitor User Reference
Screen 12-1.
Screen 12-2.
Screen 12-3.
Screen 12-4.
Screen 12-5.
Screen 12-6.
Screen 12-7.
Screen 12-8.
Screen 12-9.
Screen 12-10.
Screen 12-11.
Screen 12-12.
Network Monitor Control Window
Monitor Menu, List Alarms Selection Criteria
Administer Menu, Set Alarm List Preferences
Administer Menu, Define User Notices Window
Generate Shelf Maps, Selected Nodes
Administer Map, Set Top Map
Edit Maps Window
Edit Maps Window, Save
List of Maps
Edit Maps Window, Edit
Add Labels Window
Edit Labels Window
StarKeeper II NMS Graphics System Guide R10.0, Issue 1
10-57
10-62
11-5
11-7
11-8
11-9
11-10
11-11
11-12
11-13
11-15
11-16
11-17
11-18
11-19
11-20
12-2
12-3
12-7
12-9
12-12
12-13
12-14
12-15
12-16
12-18
12-20
12-21
xxxiii
Screens
Screen 12-13.
Screen 12-14.
Screen 12-15.
Screen 12-16.
Screen 12-17.
Screen 12-18.
Screen 12-19.
Screen 12-20.
Screen 12-21.
Screen 12-22.
Screen 12-23.
Screen 12-24.
Screen 12-25.
Screen 12-26.
Screen 12-27.
Screen 12-28.
Screen 12-29.
Screen 12-30.
Screen 12-31.
Edit Maps Window, Set Background
Picking Equipment from a List
List of Concentrators/SAMs
Picking Trunks from a List
Background Text, Add Background Text
Background Text, Edit Background Text
Properties, Scratch Pad Text
Properties, Set Network Address
Properties, Set Map Pointer
Edit Maps Window, Set Title
Network Status Window
Network Map Window
Network Map Window, Display Info
List Alarms Window
File, Save
Commands, Display Detail
Help, Any Alarm
List Alarms, Commands, Help
Diagnostics Window
13
Administering Performance Reporter
Screen 13-1.
Screen 13-2.
Screen 13-3.
Screen 13-4.
Screen 13-5.
Screen 13-6.
Performance Reporter Control Window
Set Threshold Status Window
Set Threshold Status Window
Threshold Values for Bandwidth Receive Utilization Window
Update Configuration Data Notice Window
Database Bulletin Board Message
14
Screen 14-1.
Screen 14-2.
xxxiv
12-22
12-23
12-24
12-25
12-27
12-27
12-28
12-29
12-29
12-30
12-31
12-33
12-35
12-37
12-38
12-39
12-41
12-42
12-44
13-2
13-3
13-4
13-6
13-8
13-9
Using Performance Reporter for Routine Performance
Assurance
Performance Reporter Control Window
Exception Reports Pop-Up Window
14-2
14-3
StarKeeper II NMS Graphics System Guide R10.0, Issue 1
Screens
Screen 14-3.
Screen 14-4.
Screen 14-5.
Screen 14-6.
Screen 14-7.
Screen 14-8.
15
Exception Reports: Daily Summary Report
Exception Reports Pop-Up Window Redrawn
Exception Reports: Daily Detail Report
Bandwidth Utilization - Trunk Form
Bandwidth Utilization - Trunk Form, Completed
Daily Exception Report Example
14-4
14-5
14-6
14-7
14-10
14-14
Using Performance Reporter for Long-Term Traffic
Engineering
Screen 15-1.
Screen 15-2.
Screen 15-3.
Performance Reporter Control Window
Scheduled Report Link Bandwidth Utilization Form
Scheduled Report Link Bandwidth Utilization Form Completed
16
Managing Performance Reporter Files and Requests
Screen 16-1.
Screen 16-2.
Screen 16-3.
Screen 16-4.
Performance Reporter Control Window
On-demand Reports Pop-Up Window
Scheduled Reports Pop-Up Window
List Report Requests Pop-Up Window
17
Performance Reporter: Report Examples and Interpretation
Screen 17-1.
Screen 17-2.
Screen 17-3.
Screen 17-4.
Screen 17-5.
Screen 17-6.
Sample Bandwidth Utilization Link Graphical Report
Sample Bandwidth Utilization Trunk Report
Sample Bandwidth Utilization Link Report
Sample Bandwidth Utilization Node Report
Sample Bandwidth Utilization Shelf Report
Sample Connection Utilization Receiving Group
Report - Summary
Sample Connection Utilization Receiving Group
Report - Detail
Sample Connection Utilization Trunk Group
Report - Summary
Screen 17-7.
Screen 17-8.
StarKeeper II NMS Graphics System Guide R10.0, Issue 1
15-2
15-3
15-5
16-1
16-2
16-4
16-6
17-4
17-8
17-9
17-10
17-11
17-14
17-15
17-16
xxxv
Screens
Screen 17-9.
Screen 17-10.
Screen 17-11.
Screen 17-12.
Screen 17-13.
Screen 17-14.
Screen 17-15.
xxxvi
Sample Connection Utilization X.25 Report
Sample Connection Utilization Node Report - Summary
Sample Port Capacity Utilization Frame Relay Report
Sample Port Capacity Utilization Frame Relay Graphical Report
Sample Network Availability Node Report
Sample Network Availability Trunk Report
Sample Module Performance Frame Relay Report
17-17
17-18
17-20
17-23
17-25
17-26
17-28
StarKeeper II NMS Graphics System Guide R10.0, Issue 1
0
Preface
StarKeeper ® II NMS manages, controls, and diagnoses the complete line of
BNS-2000 and BNS-2000 VCS nodes as well as concentrators, servers, bridges,
routers, gateways, and other network elements. StarKeeper II NMS collects alarm
information, billing data, and performance measurements from the network and
generates reports on request. Two-way communication between StarKeeper II
NMS and the network allows one centrally located administrator to manage
equipment at many locations.
StarKeeper II NMS architecture consists of one or more Core Systems optionally
connected to one or more Graphics Systems running various graphics
applications. The Core Systems maintain network connectivity and databases,
and perform basic network management functions. The StarKeeper II NMS SNMP
Proxy Agent is a Core System application which may be optionally installed.
The StarKeeper II NMS Graphics System is an 8-user system. It consists of the
following software packages:
■
StarKeeper II NMS Graphics System Platform, including
— Bulletin Board
— Cut-Through
— Workstation Administration
■
StarKeeper II NMS Network Builder
■
StarKeeper II NMS Network Monitor
■
StarKeeper II NMS Performance Reporter
The Graphics System Platform provides you with the basic services that are
necessary to administer a StarKeeper II NMS Graphics System. The platform
comprises several applications: The Bulletin Board displays alarms from
StarKeeper II NMS applications and Graphics System software. Workstation
Administration provides you with the ability to administer the network
management-related aspects of your Graphics System, such as establishing
connections between your Graphics System and one or more Core Systems.
StarKeeper II NMS Graphics System Guide, R10.0, Issue 1
xxxvii
StarKeeper II NMS Graphics System Overview
Finally, Cut-Through allows you to establish login sessions on host computers,
such as a StarKeeper II NMS Core System.
Network Builder provides user-friendly and task-oriented windows for
configuration and analysis of your network. It also allows you to configure and
analyze a network from one, centralized location — populating supported node
databases and StarKeeper II NMS Core System databases in one operation.
Network Builder provides complete configuration support for the Frame Relay
service. Network Builder is required if you want to implement the network's
Session Maintenance feature and support for Frame Relay. Network Builder is
also required for configuring nodes, SNIs, and the Inter-Carrier Interface (ICI) for
Switched Multimegabit Data Service (SMDS) networks. It is also used to establish
and maintain optimal network routing. Analysis reports are also available.
Network Monitor provides user-friendly and task oriented windows for alarm
monitoring and BNS-2000 VCS and BNS-2000 diagnostics.
Performance Reporter is a user-friendly and task oriented windows interface that
provides several features to enhance the basic StarKeeper II NMS reporting
capabilities. Some reports are available in graphical format via XGRAPH
software.
Netstations can be connected to the Graphics System host machine, allowing
multiple users to access the Graphics System software. For small networks, the
Graphics System software can reside on the same host machine as the Core
System. For large networks, multiple Core Systems can divide the load either
geographically or functionally.
Purpose of the Document
This guide presents complete instructions for the administration and use of the
Graphics System Platform and the Network Builder, Network Monitor, and
Performance Reporter applications.
You need to read this guide if you will be performing any of these tasks:
xxxviii
■
administering the Graphics System
■
utilizing Network Builder, Network Monitor, or Performance Reporter
■
configuring Frame Relay service
■
configuring SMDS networks
■
analyzing real and proposed network routing
■
generating Node Reroute Tables, in support of the Session Maintenance
feature
StarKeeper II NMS Graphics System Guide, R10.0, Issue 1
StarKeeper II NMS Graphics System Overview
■
using the Session Maintenance simulator, in support of the Session
Maintenance feature
■
creating and generating network maps
■
troubleshooting network problems
■
scheduling and running performance reports
Refer to the StarKeeper II NMS Core System Guide for instructions on software
installation and printer configuration.
Organization
This guide is divided into the following chapters.
Chapter 1
provides an overview of the major features of the software packages that
are available on a Graphics System, including the Graphics System
Platform, Network Builder, Network Monitor and Performance Reporter.
Chapter 2
refers to the StarKeeper II NMS Core System Guide for information on
installing the Graphics System software and for physically connecting your
Graphics System to the network. This chapter also provides instructions
related to the utilization of the Graphics System including adding and
removing Graphics System users, starting and stopping the Graphics
System, and establishing communications between the Graphics System
and Core Systems in order to logically connect your Graphics System to the
network. It also contains information related to administering
your netstation.
Chapter 3
provides information on using the Graphics System including starting
Graphics System applications, accessing the OS environment, printing,
HyperHelp capabilities and HP VUE features such as the Style Manager.
Chapter 4
provides information on using the Bulletin Board application along with
information on checking the EVENTLOG.
Chapter 5
describes the Workstation Administration component of the Graphics
System Platform, including configuring and monitoring communications
between the Graphics System and Core Systems, synchronizing the
Graphics System with the databases on the connected Core Systems,
adding host computers that can be accessed by Cut-Through, and
managing the disk files used by the Graphics System applications.
Chapter 6
describes the Cut-Through component of the Graphics System Platform,
including how to connect to host computers, utilizing the automatic login
capability, and customizing the list of host computers that can be accessed
by Cut-Through.
Chapter 7
provides instructions related to the utilization of the Network Builder
application including tuning Network Builder system parameters.
StarKeeper II NMS Graphics System Guide, R10.0, Issue 1
xxxix
StarKeeper II NMS Graphics System Overview
xl
Chapter 8
describes how to configure physical and logical resources in your network
using Network Builder. The chapter contains a discussion on how to use
Network Builder as well as information related to configuring network
elements including nodes, trunks, groups, service addresses, NMS
connections, node reroute tables and the Frame Relay and SMDS data
services.
Chapter 9
describes how to perform network analysis using Network Builder. The
chapter contains information related to the Connectivity Analysis and
Session Maintenance simulation tools, including how to use the tools,
constraints and limitations, input and output, examples and troubleshooting.
Chapter 10
provides instructions related to the utilization of the Network Monitor
application. The chapter explains the relationship between network maps
and alarms, and contains a step-by-step tutorial describing how to plan a
map hierarchy and how to create maps using Network Monitor. The chapter
also contains instructions for defining user notices, specifying alarm filters,
updating maps and distributing maps to other Graphics Systems.
Chapter 11
contains two step-by-step tutorials describing how to monitor a network for
faults using Network Monitor. It also describes how to use Network Monitor
in an environment where the network monitoring responsibility transfers
from one location to another.
Chapter 12
is the Network Monitor user reference section. The chapter describes each
of the windows, menus and fields used in the Network Monitor application.
Network Addressing and Editor Legend Symbols are also discussed in this
chapter.
Chapter 13
provides instructions related to the utilization of the Performance Reporter
application including administration of thresholding, updating configuration
data and specifying filed report retention intervals.
Chapter 14
describes how to use Performance Reporter to perform Routine
Performance Assurance, the daily monitoring of key performance
measurements in the network. The chapter shows how Performance
Reporter is used to identify and troubleshoot service-affecting conditions in
the network, including how to access exception reports and on-demand
performance measurements.
Chapter 15
describes how to use Performance Reporter to perform Long-term Traffic
Engineering, the task of engineering the network to keep it running
optimally. The chapter shows how to use Performance Reporter to aid in
this task, including scheduling measurement reports and interpreting the
report output.
Chapter 16
provides instructions related to the maintenance of the Performance
Reporter application including managing filed reports and report requests,
and troubleshooting Performance Reports.
Chapter 17
shows examples of tabular and graphical reports generated by
Performance Reporter, and provides descriptions of the fields used in the
reports.
Appendix A
provides manual pages for some commands used in this guide.
Appendix B
contains a listing of Graphics System Platform error messages.
StarKeeper II NMS Graphics System Guide, R10.0, Issue 1
StarKeeper II NMS Graphics System Overview
Appendix C
contains information related to troubleshooting Network Monitor, including a
list of the error messages produced by the Network Monitor application and
the recommended course of action. The chapter contains a list of Network
Monitor software processes and their related Network Monitor window, if
any. The chapter also includes a list of HP-UX error numbers.
Appendix D
contains the error messages from Performance Reporter including a brief
explanation and recommended course of action.
Glossary
contains definitions of acronyms and terms used in this guide.
Index
contains a listing of indexed terms that appear in this guide.
Document Conventions
Certain conventions are used in this document to help make it more usable.
■
Some screen displays are boxed:
This is a screen display
■
Messages that appear on the screen (for example, system responses,
alarms, prompts, and so forth) are printed as follows: device for
printer_name: io_port
■
User input instructions appear in bold italic font: Type /usr/bin.
■
Command names, menu items and field names are shown in bold font:
help, View, Display Info.
■
Directory and file names are shown in italic font: $CNMS_DBS/ahp/
alarm_log.
■
Variable information, either entered from the keyboard or displayed on the
screen, is enclosed in angle brackets: <name>.
■
Keys that you press are shown in a box:
Enter
.
If two keys are shown, press them together. For example, Ctrl q means
to press (and hold) the Ctrl key and then enter a q; once both keys are
depressed, you release them both.
■
Procedural steps are marked by consecutive step numbers.
■
Buttons that are to be selected on some StarKeeper II NMS screens by
using the mouse appear like this: Button
StarKeeper II NMS Graphics System Guide, R10.0, Issue 1
xli
StarKeeper II NMS Graphics System Overview
What’s New in This Document for
Release 10.0
0
This document is reissued because of changes and additions made since
Release 8.0 of StarKeeper II NMS. The following list details these changes:
■
Support for BNS-2000 Release 5.0
■
Support for BNS-2000 VCS R6.0
■
Network Monitor Call Trace feature
■
Year 2000 Compliance. StarKeeper II NMS R10.0 provides Year 2000
Compliance through the support of four-digit years in most date fields; twodigit years are also supported in an unambiguous way (refer to Chapter 1
of this guide for more details).
Screen Displays
This guide shows many screens that appear on your terminal; in some cases only
a portion of the screen is shown. However, in every instance, this document
shows the portion of the screen necessary to complete the task described.
Recommended Prerequisites
Using Network Builder, Network Monitor, and Performance Reporter requires that
users be familiar with administration of their data network. For example, a Network
Builder user must know the meaning of the various parameters associated with
the components (e.g. node, trunk, address) which are configured by Network
Builder. Familiarity with the items listed below is recommended:
xlii
■
HP-UX Operating System
■
OSF/Motif user environment
■
HP VUE
■
StarKeeper or StarKeeper II NMS
■
Datakit VCS or BNS-2000 VCS
■
BNS-2000
StarKeeper II NMS Graphics System Guide, R10.0, Issue 1
StarKeeper II NMS Graphics System Overview
Supported Products
This version of the Graphics System supports BNS-2000 Release 5.0 and BNS2000 VCS R6.0. See the StarKeeper II NMS Planning Guide for a complete listing
of supported products.
☞ IMPORTANT:
Support for a number of systems—including BNS-1000, ISN, and other previously
supported nodes—has been discontinued. Prompts for unsupported node equipment might appear on the console screen and in screen captures that appear in
this document. They are to be disregarded. If they are used, the results will be
undefined. In addition, text references to BNS-2000 VCS refer to Datakit II VCS,
unless Datakit II VCS is specifically mentioned in instances of interworking.
Screen captures that refer to Datakit II VCS refer to BNS-2000 VCS and/or Datakit
II VCS, depending on the product that reflects that particular software release.
In some instances the Graphics System may refer to or query you for input
relating to currently unsupported products. Be aware that entry of responses
related to these unsupported products should be avoided since they may yield
unpredictable results.
StarKeeper II NMS Graphics System Guide, R10.0, Issue 1
xliii
StarKeeper II NMS Graphics System Overview
Related Documentation
StarKeeper® II NMS Documents
■
StarKeeper II NMS Core System Guide
■
StarKeeper II NMS Planning Guide
■
StarKeeper II NMS SNMP Proxy Agent Guide
Hewlett-Packard Documents
■
HP Visual User Environment 3.0 Quick Start
■
Using Your HP Workstation
■
Hewlett-Packard DeskJet 560C Printer User's Guide
■
Hewlett-Packard LaserJet IIP Printer User's Manual
■
Hewlett-Packard LaserJet IIIP Printer User's Manual
■
Hewlett-Packard LaserJet 4 and 4M Printer User's Manual
■
Hewlett-Packard PaintJet Color Graphics Printer User's Guide
■
HP ENVIZEX Station User’s Guide
■
HP ENVIZEX Station Installation Guide
■
HP 700/RX Netstation User’s Guide
■
System Administration Tasks Manual
■
Upgrading from HP-UX 9.x to 10.0
■
Installing HP-UX 10.20 and Updating from HP-UX 10.0x to 10.20
BNS-2000 VCS Documents
Refer to the Datakit II VCS Publications brochure for information on BNS-2000
VCS and Data Networking Products documentation.
BNS-2000 Documents
Refer to the BNS-2000 Publications brochure for information on BNS-2000
documentation.
xliv
StarKeeper II NMS Graphics System Guide, R10.0, Issue 1
StarKeeper II NMS Graphics System Overview
Additional Copies
If you need to order additional copies of documentation
■
contact your Lucent Technologies account representative
■
call the Customer Information Center at 1--888-LUCENT8, or
■
write to the Customer Information Center, Commercial Sales, P.O. Box
19901, Indianapolis, IN 46219.
Training
To get information about training courses and schedules
■
In the U.S.A., call the Customer Information Center at 1-888-LUCENT8,
Option 2.
■
In Europe, contact the Customer Assistance Contact in your country
■
In other global locations, contact an International Enrollment Coordinator at
+1-407-767-2798.
Customers may also obtain training information by accessing the World Wide Web
at:
www.lucent.product-training.com/catalog
StarKeeper II NMS Graphics System Guide, R10.0, Issue 1
xlv
StarKeeper II NMS Graphics System Overview
xlvi
StarKeeper II NMS Graphics System Guide, R10.0, Issue 1
StarKeeper II NMS Graphics
System Overview
0
1
This chapter provides an overview of the components of a Graphics System: the
StarKeeper II NMS Graphics System Platform, and the StarKeeper II NMS Network Builder, StarKeeper II NMS Network Monitor, and StarKeeper II NMS Performance Reporter applications.
Together, the platform and applications provide:
■
simplified administration and operation of your network management
system
■
simplified configuration and provisioning of network elements
■
simplified fault detection and management
■
simplified traffic and performance measurement and analysis
■
a menu/forms interface based on the Motif Graphical User Interface
■
on-line help for the interface
■
easy access to non-graphical capabilities
The platform and applications are accessed from the StarKeeper II subpanel on
the HP VUE Front Panel of your Netstation.
Year 2000 Compliance
StarKeeper II NMS R10.0 supports the use of four-digit years in most user-specified date fields. Two-digit years are also supported, with the following assumptions:
■
If a two-digit year, XX, is entered that is between 00 and 70 (inclusive), the
four-digit year 20XX will be used
■
If a two-digit year, YY, is entered that is greater than 70, the four-digit year
19YY will be used
StarKeeper II NMS Graphics System Guide, R10.0, Issue 1
1-1
StarKeeper II NMS Graphics System Overview
Some report headings will continue to use two-digit years in the date field. These
will represent the appropriate year and should not be ambiguous to the user.
Graphics System Platform
The Graphics System Platform provides you with the basic services that are necessary to administer a StarKeeper II NMS Graphics System and monitor its performance. Built on the Motif Graphical User Interface, the Graphics System
Platform consists of several components. Each component consists of one or
more task-oriented windows, which together provide a simplified interface for
administering the Graphics System.
Graphics System Platform Features
The Graphics System Platform consists of the following three components:
■
Bulletin Board
■
Workstation Administration
■
Cut-Through
Each component is described in the following subsections.
Bulletin Board
The Bulletin Board application is used to retrieve and display messages from the
Graphics System applications and software. As such, it provides an important tool
in monitoring the health of the Graphics System. Messages posted to the Bulletin
Board identify exceptions, alerts or informational notices, and are grouped into the
following classes:
■
Graphics System host computer resources
■
Graphics System file system resources
■
Graphics System to Core System communications
■
Graphics System application database access
Often, messages posted to the Bulletin Board will require the intervention of the
network administrator. The Bulletin Board application is launched from the StarKeeper II subpanel on the HP VUE Front Panel.
1-2
StarKeeper II NMS Graphics System Guide, R10.0, Issue 1
StarKeeper II NMS Graphics System Overview
Workstation Administration
Workstation Administration provides you with a simplified way of performing
administration and maintenance of the Graphics System environment. This application is accessible from the StarKeeper II subpanel on the HP VUE Front Panel.
Workstation Administration provides procedures for establishing and removing
connections between the Graphics System and one or more StarKeeper II NMS
Core Systems. This allows for an integrated, end-to-end approach to the management of networks containing more than one StarKeeper II NMS system. In addition, Workstation Administration allows you to continually monitor the status of the
connections between the Graphics System and the Core Systems connected to it.
Workstation Administration provides procedures for maintaining consistency
between the Graphics System and the Core Systems connected to it.
In particular, Workstation Administration is used to configure certain local
machine connection parameters necessary for the applications on the Graphics
System to have access to data server processes on the Core Systems connected
to it.
Workstation Administration is also used when there is a need to synchronize the
Graphics System with the databases on the Core Systems connected to it. This is
necessary in order for the applications on the Graphics System to have access to
latest information available in the databases on the Core Systems.
Workstation Administration also provides procedures for managing the disk files
created by the applications on the Graphics System. You can also use Workstation Administration to add, delete or modify the list of host computers that is made
available to all Graphics System users who utilize Cut-Through.
Cut-Through
The Cut-Through application provides you with a simplified way of accessing the
HP-UX ASCII environment on the Graphics System or on a host computer connected to the Graphics System. This application is accessible from the StarKeeper II subpanel on the HP VUE Front Panel.
Cut-Through allows you to access a list of host computers. From this list, you
select the name of the computer to which you want to connect. Cut-Through sets
up a call to this processor and establishes a connection so that you can begin to
execute your commands. For instance, if you need to access the console of a
node monitored by a Core System connected to your Graphics System, you would
use Cut-Through to log into the Core System, then access the node from there.
StarKeeper II NMS Graphics System Guide, R10.0, Issue 1
1-3
StarKeeper II NMS Graphics System Overview
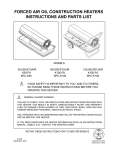
Graphics System Platform Window Architecture
This section provides a brief description of the Graphics System Platform's window architecture.
As Figure 1-1 illustrates, the Graphics System Platform consists of three Control
Windows, corresponding to each of the Graphics System Platform applications.
In addition, several other windows are available from the Workstation Administration Control Window. The Graphics System Platform applications are launched
from the StarKeeper II subpanel on the HP VUE Front Panel.
1-4
StarKeeper II NMS Graphics System Guide, R10.0, Issue 1
StarKeeper II NMS Graphics System Overview
HP VUE
StarKeeper II
Subpanel
Bulletin
Board
Control Window
Workstation
Administration
Control Window
Cut-Through
Control
Window
Administer
Modify
Connections
Data Window
Disk Cleaner
Administration
Window
View
Cut-Through
Administration
Window
Connection
Status
Window
Synchronize
Connections
Window
Modify Local
Parameters
Window
Figure 1-1.
Graphics System Platform Window Architecture
StarKeeper II NMS Graphics System Guide, R10.0, Issue 1
1-5
StarKeeper II NMS Graphics System Overview
The Graphics System Platform window architecture consists of the following windows:
■
Bulletin Board Control Window
■
Workstation Administration Control Window
— Add/Delete/Modify Data Window
— Synchronize Connections Window
— Modify Local Parameters Window
— Disk Cleaner Administration Window
— Cut-Through Administration Window
— Connection Status Window
■
Cut-Through Control Window
— Add-On Computers
Bulletin Board Control Window
The Bulletin Board Control Window is used to retrieve and display informational
and error messages from the Graphics System applications and software. The
window contains the login id of the user and the name of the host computer on
which the Graphics System is running. Whenever a message is posted to the Bulletin Board, a glyph is displayed for that message in the message bar of the base
window. Selection of the glyph will raise another window. This window will display
the message associated with the glyph. Occasionally, more than one message will
be displayed. There is one glyph for each of the four classes of messages,
described earlier in this section.
Workstation Administration Control Window
The Workstation Administration Control Window is used to launch several other
windows that are used to perform system-wide Graphics System administration
related to network management.
Add/Delete/Modify Data Window
0
This window is available from the Administer menu of the Workstation Administration Control Window. You use this window to establish connections between the
Graphics System and one or more host computers each containing a Core System. You can add and remove a Core System from the list, specify the system
name and listener address of the remote host, and activate or inactivate the connection between the Graphics System and a Core System.
1-6
StarKeeper II NMS Graphics System Guide, R10.0, Issue 1
StarKeeper II NMS Graphics System Overview
Synchronize Connections Window
0
This window is available from the Administer menu of the Workstation Administration Control Window. Raising this window results in the automatic synchronization of the Graphics System with the databases on the connected Core Systems.
Status messages will show the outcome of the synchronization process for each
connected Core System. In general, you invoke the Synchronize Connections
Window whenever you manually activate or inactivate a connection between the
Graphics System and a Core System, whenever you add or remove a node from
your network, or whenever you change the Core System that is actively monitoring a node.
Modify Local Parameters Window
0
This window is available from the Administer menu of the Workstation Administration Control Window. You use this window to establish several parameters that
apply only to your local host, but that must be made known to each Core System
connected to your Graphics System. These parameters consist of an identifier
unique to the Graphics System within the network consisting of all interconnected
StarKeeper II NMS Graphics Systems and Core Systems, and the dial strings of
the service address and listener address for the local host on which the Graphics
System is running.
Administration of these local parameters is necessary so that processes associated with the Graphics System applications can communicate with processes on
remote Core Systems that provide data services to the Graphics System applications such as StarKeeper II NMS and node configuration database access, alarm
occurrence access and performance measurement data access.
Disk Cleaner Administration Window
0
This window is available from the Administer menu of the Workstation Administration Control Window. This window allows you to control the consumption of the
disk resource on your Graphics System. You use this window to specify a list of
files and directories whose contents are to be deleted after a specified number of
days.
Cut-Through Administration Window
0
This window is available from the Administer menu of the Workstation Administration Control Window. You use this window to administer a list of computers that
can be accessed from the Cut-Through Control Window. This list is made available to all users on the Graphics System. Additional computers can be added on a
per-user basis by using the Cut-Through Control Window, Add-on Computers.
StarKeeper II NMS Graphics System Guide, R10.0, Issue 1
1-7
StarKeeper II NMS Graphics System Overview
0
Connection Status Window
This window is available from the View menu of the Workstation Administration
Control Window. You can use this window to examine or monitor the status of the
connections between the Graphics System and each connected Core System.
The status is updated in real-time.
Cut-Through Control Window
The Cut-Through Control Window is used to establish a login session with a host
computer connected to the computer on which the Graphics Systems is running. It
can also be used to obtain a window on the local host. The Cut-Through Control
Window contains a list of computers that have been configured for Cut-Through.
This list consists of those computers that have been configured system-wide by
using Workstation Administration, plus those computers that have been added on
a per-user basis by using the "Add-On Computers" capability available from the
File menu of the Cut-Through Control Window.
To establish a Cut-Through session, select a computer from the list and then
select Connect . The Control window also contains an Authorize menu item for
activating the automatic login capability the first time you Cut-Through to a computer.
Add-On Computers Window
0
The Add-On Computers Window provides the capability to modify a local set of
computers for your login. You will not be able to modify any computer administered centrally by the Workstation Administrator. You can add new computers,
delete computers, change the dialstrings and login protocols associated with computers, or rearrange the order of the list.
1-8
StarKeeper II NMS Graphics System Guide, R10.0, Issue 1
StarKeeper II NMS Graphics System Overview
Where Do You Go From Here?
Situation
Reference
Installing the Graphics System Platform
StarKeeper II NMS Core System Guide
How to use HP VUE
Using Your HP Workstation
How to use the Motif Graphical User Interface
Using Your HP Workstation
Adding and removing Graphics System users
Chapter 2
Starting and stopping the Graphics System
Chapter 2
Provisioning Graphics System to Core System communications
Chapter 2
Using the Bulletin Board application
Chapter 4
Using Workstation Administration
Chapter 5
Using the Cut-Through application
Chapter 6
Network Builder
Network Builder is a graphics-based, software application that allows an
administrator to configure and analyze a network from one, centralized location —
populating supported node databases and StarKeeper II NMS Core System
databases in one operation. Network Builder is required if you want to implement
data services, such as SMDS. Network Builder is also used to establish and
maintain optimal network routing via analysis reports.
All of the user's input to perform Network Builder configuration and analysis tasks
is entered with a unified menu/forms interface. All commands and choices are
readily made using the Graphic User Interface.
Network Builder Features
Built on the Motif Graphical User Interface, Network Builder simplifies the
population of configuration databases in supported nodes and in the StarKeeper II
NMS Core System database. In addition to providing a vehicle for database
entries and changes, Network Builder performs analysis and generates analysis
reports. Network Builder is required for administering Session Maintenance and
SMDS services in your network.
From a central location, Network Builder generates Node Reroute Tables,
required by nodes supporting the Session Maintenance feature. This networkwide view of NRTs ensures a consistent implementation of Session Maintenance.
Refer to the node's Session Maintenance Guide for information on planning and
operating Session Maintenance.
StarKeeper II NMS Graphics System Guide, R10.0, Issue 1
1-9
StarKeeper II NMS Graphics System Overview
Network Builder supports BNS-2000 nodes in an SMDS network by providing SNI
and ICI configuration facilities. Refer to the node’s SMDS Guide for information on
planning and operating SMDS networks.
The features of Network Builder fall into these two categories:
■
configuration
■
analysis
0
Configuration
Using the configuration facilities of Network Builder you can enter, verify, change,
and delete network elements. Some additional features of the configuration
facilities of Network Builder are briefly discussed below.
■
perform updates immediately, place them on hold, or consider them as
proposed data only
■
validate input field entries against the StarKeeper II NMS Core System
database
■
provide default values based on previously input data
■
confirm node and StarKeeper II NMS Core System database changes
■
provide log of Network Builder activities
■
perform retries for failed activities (for example, communication errors)
■
provide on-line help
The network elements configured by Network Builder are briefly discussed below
in approximately the order in which you would configure them:
1-10
of
StarKeeper
NMS Connections
Provides configuration
connections to nodes.
II
NMS
Node
Provides node configuration.
Group
Provides complete group configuration. Direct access
to the group form is also provided from trunk and
service address forms.
Service Address
Provides complete service address configuration
including mnemonic and X.121 numeric addresses.
Trunk
Provides complete trunk configuration. Complete trunk
configuration consists of updating the node databases
at both end nodes and the StarKeeper II NMS Core
System database(s).
StarKeeper II NMS Graphics System Guide, R10.0, Issue 1
StarKeeper II NMS Graphics System Overview
Node Reroute Tables
Generates and supports editing of Node Reroute
Tables to facilitate Session Maintenance for the entire
network.
SNI
Provides Subscriber Network Interface (SNI)
configuration for support of Switched Multimegabit
Data Services (SMDS) networks.
ICI Carrier
Provides Inter-Carrier
configuration.
ICI Prefix
Provides ICI address prefix configuration.
ICI Group Address
Provides ICI group address configuration.
Frame Relay
Provides configuration of Frame Relay modules, ports,
PVCs and DLCIs.
Interface
(ICI)
carrier
0
Analysis
The analysis features of Network Builder greatly assist users in engineering and
planning networks. The analysis features are listed below.
■
evaluate network topology
■
evaluate existing routing tables
■
identify topological deficiencies
■
generate error-free routing patterns
■
recommend routing solutions
■
recommend extended routing feature assignments
■
perform "what if" routing scenarios
■
analyze network routing paths
■
simulate Session Maintenance trunk failures
Using the analysis features of Network Builder you can perform evaluations and
analysis of network resources, and run simulations of trunk failures to evaluate the
Session Maintenance feature. The four analysis operations are briefly discussed
StarKeeper II NMS Graphics System Guide, R10.0, Issue 1
1-11
StarKeeper II NMS Graphics System Overview
next; the first three operations are connectivity checks and the last is the
simulation. This analysis tool applies only to connection oriented traffic.
Routing
Evaluation
Evaluates the routing tables, node by node, for all the
destination nodes in a network. Checks are made for loops,
dead-end paths, minimum number of hops, etc.; reports are
generated and "what-if" scenarios can be performed.
Topology
Evaluation
Evaluates the network topology to determine if the network
has adequate connectivity to support alternate routes for all
the nodes in a network. Generates error-free utility (any node
to any node) network routing tables.
Path Analysis
Performs an analysis of specified endpoints in a network in
normal and failure scenarios. All paths for any single node
failure can be identified. Alternatively, or in addition, all paths
for a single trunk group failure or any combination of two trunk
group failures can be identified. The user can identify the worst
path in terms of the number of hops, the number of failures,
the type of failure, etc.
Session
Maintenance
Simulation
Simulates network behavior for single or multiple Session
Maintenance trunk failures. The Session Maintenance reroute
algorithm is modeled for each node to analyze the effect of a
failure. The overall performance of Session Maintenance in a
given network topology can then be reported.
Supported Products
Network Builder populates databases for StarKeeper II NMS Core Systems and
network nodes. It also analyzes trunking schemes for networks comprised of
supported nodes.
Network Builder is required for configuring Session Maintenance and SMDS.
Network Builder Window Architecture
This section gives a high-level description of Network Builder window architecture.
1-12
StarKeeper II NMS Graphics System Guide, R10.0, Issue 1
StarKeeper II NMS Graphics System Overview
The window architecture for Network Builder is shown in Figure 1-2. From the
Network Builder Control Window you can access all of the features of Network
Builder.
Network Builder Control Window
Configure
Analyze
Configuration
Forms
Figure 1-2.
Analysis
Forms
View
Options
Configuration
Activity Log
Administer
Window
Help
Network Builder Window Architecture
The following describes the features that are available from the Network Builder
Control Window.
■
The Configure menu provides access to configuration forms for network
elements:
— Frame Relay
— FRM
— FRM-M2
— PVC
— Group
— ICI
— Carrier
— Group Address
— Prefix
— NMS Connections
— Node
— Node Reroute Tables
— Service Address
— SNI
StarKeeper II NMS Graphics System Guide, R10.0, Issue 1
1-13
StarKeeper II NMS Graphics System Overview
— Trunk
Choosing one of the above calls the appropriate configuration form base
window (see Chapter 8 for a complete discussion).
■
The Analyze menu provides access to analysis forms, which are:
— Network Connectivity
— Session Maintenance Simulation
Choosing one of the above calls the appropriate analysis form base
window (see Chapters 8 and 9 for a complete discussion).
■
The View menu provides access to the Configuration Activity Log
containing a listing of outstanding tasks. Direct access to forms associated
with a selected task is provided. This window is fully described in
Chapter 8.
■
The Options menu provides access to the Administer Window, used to
specify certain Network Builder parameter values. This window is fully
described in Chapter 7.
■
The Help menu provides access to on-line help.
Where Do You Go From Here?
Your first step in Network Builder operation depends on the availability of the
application and your experience. Refer to the following table for your particular
situation.
Situation
1-14
Reference
Installing Network Builder
StarKeeper II NMS Core System
Guide
How to use HP VUE
Using Your HP Workstation
Adding and removing Network Builder users
Chapter 2
Administer Network Builder (change retry
parameters and change file cleanup schedule)
Chapter 7
Configure network elements
Chapter 8
Implement and maintain Session Maintenance
Chapters 8 and 9
Analyze network topology and routing for the
network
Chapter 9
StarKeeper II NMS Graphics System Guide, R10.0, Issue 1
StarKeeper II NMS Graphics System Overview
Network Monitor
Network Monitor is a sophisticated fault management package that provides userfriendly access to alarm handling and diagnostics capabilities from a central
location. Network Monitor is a graphics-oriented application that is used in
conjunction with StarKeeper II NMS to support nodes, servers and routers in the
product line, as well as certain Element Management Systems (EMSs).
Network Monitor Features
The Network Monitor application continuously receives alarm information from
one or more StarKeeper II NMS systems that may be monitoring your network
equipment. Network Monitor is designed to present this information in an easy
and usable form. Network Monitor also provides easy access to all the nodes in
your network, from which you can initiate fault management commands.
Built on the Motif Graphical User Interface, Network Monitor provides multiple
task-oriented windows. These windows provide simultaneous access to network
maps that show the status of the network, provide alarm lists with detailed
information about outstanding alarms, diagnostics commands and other alarmrelated commands, and configuration information.
The features of Network Monitor fall into one of these three categories:
■
interactive bit-mapped graphical displays
■
interactive lists of alarm information
■
fault diagnosing
Interactive Bit-Mapped Graphical Displays
0
Network Monitor offers bit-mapped graphical displays that provide a customized
network view. Various optional backgrounds and an extensive array of symbols
are available to create your network maps. These maps are created in varying
levels of detail to depict the equipment in your network.
An easy-to-use editor allows you to place objects on maps and link them together
to achieve the network representation that best suits your needs. Additionally,
Network Monitor lets you request the automatic generation of shelf maps that
display a cabinet view of any node or concentrator monitored by a StarKeeper II
NMS.
Alarms that occur in the network are immediately reflected on your maps, which
are color-coded by severity.
StarKeeper II NMS Graphics System Guide, R10.0, Issue 1
1-15
StarKeeper II NMS Graphics System Overview
Interactive Lists of Alarm Information
0
Alarms from network equipment can be displayed in textual form in a List Alarms
Window. Multiple List Alarms Windows can be used simultaneously. Each List
Alarm Window has its own criteria that is used to limit the list to a subset of the
total alarms in the network. This allows you to concentrate on a particular network
problem. The criteria used to determine alarm types collected include network
addresses, alarm severities, module types and message identifiers.
The alarms in a List Alarms Window can be scrolled through — both up and
down—and selected. Commands can easily be issued on the selected alarms.
Such commands allow you to clear alarms, obtain help on alarms and to display
more detail about an alarm. Short-cuts are available to quickly access the
corresponding Network Map Window or Diagnostics Window. Various list formats
and sorting options are available both dynamically and as an individual user
preference when a list is invoked.
0
Fault Diagnosing
Network Monitor enables you to diagnose most equipment anywhere in your
network from a central location. You also have the ability to diagnose multiple
pieces of equipment to assist in solving network problems.
Supported Node Commands
Diagnostic commands are provided to identify problems that may occur on any
node. The supported diagnostic commands are:
1-16
■
verify
■
remove
■
restore
■
display conn
■
dstat
■
dmeas
■
diagnose
■
display EIA
■
display traffic
■
nping
■
route
■
smeas
■
tmeas
StarKeeper II NMS Graphics System Guide, R10.0, Issue 1
0
StarKeeper II NMS Graphics System Overview
0
Commands Pre-formatted and Sent to a Node
Network Monitor provides a user-friendly interface to the node diagnostic
commands by supplying the various parameters required to properly format
commands for different equipment types. You do not need to know the exact
syntax of the node diagnostic commands. You simply determine the equipment
you wish to diagnose from a map or an alarm on an alarm list and then choose the
appropriate diagnostic task.
Supported Products
Please see the StarKeeper II NMS Planning Guide for a list of all nodes, servers,
routers, and systems that can be used with Network Monitor. Supported product
version numbers are also provided.
Network Monitor Window Architecture
This section provides a brief description of Network Monitor's window
architecture.
As the following figure illustrates, Network Monitor uses six basic types of
windows, each geared to facilitate performing a particular task. The six windows
are:
■
Network Monitor Control Window
■
Edit Maps Window
■
Network Status Window
■
Network Map Window
■
List Alarms Window
■
Diagnostics Window
StarKeeper II NMS Graphics System Guide, R10.0, Issue 1
1-17
StarKeeper II NMS Graphics System Overview
.
Network Monitor Control Window
Network
Status
Window
Edit
Maps
Window
List
Alarms
Window
Network
Map
Window
Diagnostics
Window
Figure 1-3.
Network Monitor Window Architecture
The remainder of this section provides a high-level description of some of the
features available in each window.
Network Monitor Control Window
0
The Network Monitor Control Window has two main functions:
■
to provide access for monitoring the network
■
to administer the Network Monitor application
Administration tasks include:
■
setting alarm list preferences
■
defining user notices (see the Network Status Window section)
■
creating and linking maps via the map editor
■
requesting the automatic generation of shelf maps for nodes and
concentrators to show the modules that have been configured
■
setting the Top Map
See Chapter 10 and Chapter 12 for more information on the Network Monitor
Control Window.
1-18
StarKeeper II NMS Graphics System Guide, R10.0, Issue 1
StarKeeper II NMS Graphics System Overview
Edit Maps Window
0
The main function of the Edit Maps Window is to create bit-mapped graphic maps
that represent your network. Characteristics of the map editor are:
■
easy placement of symbols on maps using lists of equipment obtained from
the StarKeeper II NMS database
■
an editor legend for placing symbols and manually assigning network
addresses
■
optional geographical backgrounds to display the location of your
equipment (for example, a map of the USA)
The following are characteristics of the maps you can create with the map editor:
■
a top map can represent your entire network via aggregate location
symbols, with each representing a group of equipment
■
regional maps can represent individual portions of your network
■
detailed maps can represent equipment associated with a particular node
(for example, concentrators associated with a BNS-2000 VCS node)
NOTE:
Shelf maps are created independently of the map editor and are considered
the lowest level in a map hierarchy.
The various types of maps can be linked together in a top-down fashion to form a
map hierarchy, starting with a very high-level view (that is, the top map) and
ending with a close-up view of specific network equipment. See Chapter 10 and
Chapter 12 for more information on the Edit Maps Window.
Network Status Window
0
The Network Status Window provides a status-at-a-glance feature via:
■
alarm severity notices—these display a count of alarms in the entire
network, color-coded by severity.
■
user notices—these display a count of alarms highlighting user-defined
important events (for example, trunk alarms). User notices can be defined
to match alarms based on network address and/or module type and/or
message identifiers.
Alarm lists associated with each of the alarm severity notices and user notices
can be easily obtained by clicking on the Alarm Severity Notice or User Notice.
StarKeeper II NMS Graphics System Guide, R10.0, Issue 1
1-19
StarKeeper II NMS Graphics System Overview
NOTE:
As Figure 1-3 indicates, the Network Status Window and the Network Map
Window are invoked together from the Control Window. Additional Network
Map Windows can be invoked from the Network Status Window, the
Network Map Window or the List Alarms Window.
See Chapter 11 and Chapter 12 for more information on the Network Status
Window.
0
Network Map Window
The Network Map Window is used to display the bit-mapped graphical maps
created with the map editor, as well as the automatically generated shelf maps for
nodes and concentrators. Characteristics of the Network Map Window are:
■
when the Network Map Window is invoked, the top map is automatically
displayed along with the Network Status Window
■
a navigation feature allows you to maneuver up and down the map
hierarchy
■
multiple maps can be simultaneously displayed, allowing you to scrutinize
various portions of a network
■
map symbols change color to reflect the status of the equipment they
represent. In general, the status is normal, alarmed, or unmonitored.
Unmonitored status means the equipment is not monitored by a
StarKeeper II NMS.
The following table lists the various colors a symbol can have with their associated
meaning.
Table 1-1.
Alarm Colors
Color
Meaning
red
A critical alarm has occurred
yellow
A major alarm has occurred
blue
A minor alarm has occurred
green
No alarms (normal)
white
The equipment represented by the symbol is unmonitored (for example, a host
computer)
See Chapter 11 and Chapter 12 for more information on the Network Map
Window.
1-20
StarKeeper II NMS Graphics System Guide, R10.0, Issue 1
StarKeeper II NMS Graphics System Overview
List Alarms Window
0
The primary function of the List Alarms Window is to display textual alarm
information. Characteristics of the List Alarms Window are:
■
lists of alarms can be requested by network address and/or alarm
severities
■
the display detail feature can be used to display an extended version of an
individual alarm in a list to view the recommended action and other
information not shown in the multi-line format
■
the find map feature can be used to locate and directly access the map
where the equipment associated with a particular alarm is represented
■
the clear alarms feature can be used to clear an alarm or set of alarms
■
the diagnostic feature can be used to perform diagnostics on the selected
alarm
■
on-line help is available for any alarm or message identifier
■
lists of alarms can be displayed by using one of two formats—a single line
per alarm or multiple lines per alarm. The multi-line format includes the
alarm message text. The format can be changed dynamically.
■
lists of alarms can be sorted by date and time, severity, and network
address
■
the freeze feature can be used to temporarily suppress new alarms from
being displayed while a particular alarm is being investigated
■
an audible alarm option is provided for newly received alarms in the
Network Status Window as well as in other List Alarms windows
NOTE:
As Figure 1-3 indicates, the List Alarms Window can be invoked from one
of three places—the Control Window, the Network Status Window, or the
Network Map Window. Multiple List Alarm Windows can be invoked
simultaneously.
See Chapter 11 and Chapter 12 for more information on the List Alarms Window.
StarKeeper II NMS Graphics System Guide, R10.0, Issue 1
1-21
StarKeeper II NMS Graphics System Overview
0
Diagnostics Window
The primary function of the Diagnostics Window is to perform diagnostics on a
particular piece of equipment. The following are characteristics of the Diagnostics
Window:
■
a user-friendly interface to the node diagnostic commands. This eliminates
the need for remembering and entering parameters required to format
commands for different equipment types; you merely need to select an
object on a map or an alarm from a list and choose the desired diagnostics
task
■
the ability to compare the output of multiple diagnostic commands on a
piece of equipment
■
the ability to simultaneously access and diagnose different pieces of
equipment to assist in fault isolation
NOTE:
As seen in Figure 1-3, the Diagnostics Window is invoked from either the
Network Map Window or List Alarms Window.
See Chapter 11 and Chapter 12 for more information on the Diagnostics
Window.
Where Do You Go From Here?
Your first step in Network Monitor operation depends on the availability of the
application and your experience. Refer to the following table for your particular
situation.
Situation
1-22
Reference
Installing Network Monitor
StarKeeper II NMS Core System Guide
How to use HP VUE
Using Your HP Workstation
Adding and removing Network Monitor users
Chapter 2
You need to plan your map hierarchy
Chapter 10
Create and generate maps
Chapter 10
Define user notices
Chapter 10
Specify alarm filters
Chapter 10
Distribute maps to workstations
Chapter 10
Monitor your network
Chapter 11
StarKeeper II NMS Graphics System Guide, R10.0, Issue 1
StarKeeper II NMS Graphics System Overview
Performance Reporter
Performance Reporter is a network measurement package that provides
user-friendly, menu-based access to performance reports. These performance
reports are used to evaluate the performance of network resources — both physical and logical. Network nodes transmit raw performance data to StarKeeper II
NMS via a designated performance connection. Only nodes with an active performance connection can be supported by the performance management capabilities of StarKeeper II NMS and Performance Reporter.
Performance Reporter is an optional, graphics-oriented application that makes
use of the data collection, summarization, and storage capabilities of StarKeeper
II NMS. While StarKeeper II NMS does provide basic reporting capabilities, Performance Reporter adds value in terms of the user interface and features that are
specifically geared to two performance management tasks: routine performance
assurance and long-term engineering.
Performance Reporter Features
This section provides a high-level discussion of the major features available
through Performance Reporter. Performance Reporter is based on the Motif
Graphical User Interface.
The features of Performance Reporter fall into one of the following three categories:
■
routine performance assurance
■
long-term engineering
■
administration and maintenance
Routine Performance Assurance
0
Routine performance assurance is the daily monitoring of performance measurements in the network. The purpose is to identify service-affecting or potentially
service-affecting conditions in the network. Since performance problems can be
related to network alarms, troubleshooting a performance problem will often
require checking alarms or alarm history. While it is not always possible to solve a
performance problem as it occurs, it is important that the System Administrator, in
the role of pro-actively managing a network, be aware of these conditions as they
occur.
StarKeeper II NMS Graphics System Guide, R10.0, Issue 1
1-23
StarKeeper II NMS Graphics System Overview
The following lists the features that Performance Reporter has available for routine
performance assurance.
■
Thresholding
This is a feature that can be manually activated if routine performance
assurance is part of the operation. Thresholding helps the System Administrator to identify problem areas. Performance measurements, peak trunk
utilization, and node availability, for example, have threshold values associated with them. Factory set default values are provided but can easily be
changed. When the threshold value has been crossed during an interval,
that interval is flagged as an exception, and will appear on the Daily Exception Report.
■
Daily Exception Reports
This feature is activated as part of the thresholding feature. The Daily
Exception Report is automatically generated and filed at the end of each
day. Two formats are available: a detailed view of all the exceptions and a
summary of exceptions per resource. The report shows the previous day’s
problem areas. The System Administrator will decide which problems to
troubleshoot. The first step in troubleshooting is to check the current day’s
reports for a recurrence of the problem.
■
On-demand reports
Daily performance reports are available for hourly intervals of the past several days according to the data retention period that was set on the StarKeeper II NMS Core System (see Chapter 13). Most often, these reports
are specified up to the last hour of the current day. The reports are organized by categories: Bandwidth Utilization, Connection Utilization, Port
Capacity Utilization, Network Availability and Module Performance. They
are accessed via menus and forms. These reports, available in tabular or
graphical form, can be displayed to the screen, sent to a printer or saved to
a file. Performance measurements are included in the reports so that the
System Administrator can see what the values are today and compare
them to yesterday’s Daily Exception Report. Performance measurements
that have crossed threshold settings will be identified on the reports. If a
performance problem persists, the System Administrator can follow it up by
checking the other lower-level reports, or by checking other applications.
For example, you could look for related alarms in Network Monitor or check
the configuration data in Network Builder.
1-24
StarKeeper II NMS Graphics System Guide, R10.0, Issue 1
StarKeeper II NMS Graphics System Overview
Long-term Engineering
0
Long-term engineering is the ongoing identification of network performance needs
and planning involved to meet those needs. There are several sources of network
performance needs: chronic service-affecting conditions, trends in usage, weekly
and monthly report summaries, and user feedback. Long-term engineering provides a history of performance-related information that can be used to design an
optimal network. This information must be used together with growth plans to
arrive at an optimal network design.
The following lists the features that Performance Reporter has available for longterm engineering.
■
Scheduled report requests
It is important that the System Administrator be able to set up schedules for
running measurement reports, especially when those reports will be run
repeatedly. The System Administrator will decide which reports are needed
and when they are to be run. The scheduled reports are requested via the
same forms interface as the on-demand reports. Scheduled reports can be
run on a daily, weekly, or monthly basis. These reports, available in tabular
and graphical form can be sent to a printer for viewing at a later date. Performance measurements that have crossed threshold settings will be identified on graphical reports.
■
Weekly and monthly measurement reports
The reports relevant to long-term engineering are the weekly and monthly
summary reports. The reports are organized by categories: Bandwidth Utilization, Connection Utilization, Port Capacity Utilization, Network Availability and Module Performance. Some reports are available in both tabular
and graphical form. These reports can be saved to a file and be available
for printing at a later date. When it is time to review and compare the
reports, the System Administrator will look at the performance measurements, noting any changes, specifically changes in relation to threshold
values.
■
Weekly and monthly exception reports
The weekly and monthly exception reports will be automatically generated
and sent to files. These reports are summary reports that show the frequency of performance problems per resource. The System Administrator
has the option to print the report and use that report in identifying chronic
performance problems that should be resolved by an engineering change.
StarKeeper II NMS Graphics System Guide, R10.0, Issue 1
1-25
StarKeeper II NMS Graphics System Overview
Administration and Maintenance
0
Administration and maintenance is the support of activities that ensure the application is set up appropriately and continues to work properly.
A menu and forms interface accesses the administrative features of Performance
Reporter. Those features are:
■
activating/deactivating the threshold feature
■
entering a threshold value to replace the factory set value
■
updating configuration information
■
displaying the report request schedule, with the option to change or delete
a request
■
displaying the list of filed reports, with the option to display, print, or delete
a report
Supported Products
Please see the StarKeeper II NMS Planning Guide for a list of all nodes that can
be used with Performance Reporter. Supported product version numbers are also
provided.
Various products transmit performance data to StarKeeper II NMS via a designated performance connection. Only products with a configured, active performance connection can be supported by the performance management
capabilities of StarKeeper II NMS and Performance Reporter.
1-26
StarKeeper II NMS Graphics System Guide, R10.0, Issue 1
StarKeeper II NMS Graphics System Overview
Performance Reporter Window Architecture
This section gives a high-level description of the Performance Reporter window
architecture. The window architecture for Performance Reporter is shown in the
following figure. From the Performance Reporter Control Window you can access
all of the features of this application.
Performance Reporter
Control Window
Request
Report
Report
Generation
Forms
List
Exception
Reports
Filed
Reports
Administer
Update
Configuration
Data
Set
Threshold
Status
Report
Requests
Figure 1-4.
Help
View/Change
Threshold
Values
Performance Reporter Window Architecture
The following describes the windows that are available from the Performance
Reporter Control Window.
■
The Request Report menu provides access to report generation forms,
organized by report categories. Selection of a report category will bring up
a form, where you enter your report request. The report request is made up
of report selection criteria, such as, resource name, report type (i.e., daily,
weekly, monthly), interval, and scheduling information.
This button is used for both requesting on-demand measurement reports
and scheduling measurement reports to be run later. When you request an
on-demand report, the report output can be directed to the screen, a
StarKeeper II NMS Graphics System Guide, R10.0, Issue 1
1-27
StarKeeper II NMS Graphics System Overview
printer, or saved to a file. A scheduled report can be sent to a file or to a
printer. The reports can be obtained in either tabular or in some cases
graphical format.
■
The List menu provides access to report information that has been
previously entered. You can view a list of measurement reports that have
been run and filed, a list of exception reports that have been run and filed,
or a list of report requests that have been scheduled. By selecting the list
item, you can display the corresponding report or report schedule.
■
The Administer menu provides access to Performance Reporter functions
which are important in administering the application. You can activate the
thresholding feature by changing its status. Once thresholding is active,
you can view and change the threshold values for each performance
measurement. You can also update configuration information.
■
The Help menu provides access to on-line help.
Report Categories
There are five report categories for both on-demand and scheduled performance
reports. This section summarizes each of these categories.
0
Bandwidth Utilization
Bandwidth Utilization reports represent the utilization of the main physical components in a network. The main physical components in a network are: nodes,
trunks, links, and M1 shelves. They are high-level reports that are expected to be
run daily, weekly, and monthly. Error counts are not included in this high-level
report; they are found in the Module Performance reports.
Bandwidth Utilization reports show how much capacity is being used. Trunk utilization is the usage of facilities between nodes. Link utilization is the usage of facilities between nodes and other products, such as, concentrators, multiplexers,
hosts and servers. Node utilization is the usage of the node backplane.
Trunk Utilization Report
0
These reports identify both ends of the trunk (node name and group), and show
utilization data from both ends.
Link Utilization Report
These reports show utilization data for Multipurpose Concentrators, SAMs and
CPMML servers.
1-28
StarKeeper II NMS Graphics System Guide, R10.0, Issue 1
0
StarKeeper II NMS Graphics System Overview
0
Node Backplane Utilization Report
These reports show the usage of the node backplane. Usage is defined as the
number of packets/segments switched across the backplane expressed as a percentage of the backplane capacity. A summary report and a detail report are provided. The detail report gives module specific information of the traffic contribution
to the BNS-2000 node backplane.
This report shows what percentage of the backplane is being used, which indicates how close a node backplane is to its maximum data transfer rate. This measurement is important in deciding whether or not a node can support more
concentrators or multiplexers.
0
M1 Shelf Utilization Report
This report shows the aggregate usage of M1 shelves in the BNS-2000 node by
displaying the percentage of the M1 shelf that is being used. Usage is defined as
the traffic carried as a percentage of the shelf capacity. The higher the percentage, the closer the shelf is coming to its maximum data transfer rate.
Connection Utilization
0
Connection Utilization reports represent the percentage of connections of logical
components in your network, X.25 channels, and the node. There are two levels of
these reports. The summary report shows the channel (trunk groups) or port
(receiving groups) utilization, call success rate, and a failed call indication. The
detail report shows the breakdown of failed calls listed by cause, such as contention conflict or a security problem.
Logical components are the trunk groups and receiving groups that you have set
up to route calls. By looking at the data in these reports, you can determine if the
groups can handle the call traffic effectively, or if the groups should be reconfigured.
X.25 reports show the utilization of X.25 channels that are allocated to X.25 ports.
By looking at the data in these reports, you can determine if the number of channels can handle the call traffic effectively. The summary report shows the channel
utilization and call success rate. If the call success rate is less than 100%, it indicates that there were failed calls.
Node reports show the percentage of backplane connections, which indicates
how close a node backplane is to its maximum data transfer rate. This measurement is important in deciding whether or not a node can support more concentrators or multiplexers.
StarKeeper II NMS Graphics System Guide, R10.0, Issue 1
1-29
StarKeeper II NMS Graphics System Overview
Port Capacity Utilization
0
Port Capacity Utilization reports show the port utilization for access modules in
the backplane. Ports in access modules are connected via facilities to other
devices and therefore are similar to other transmission facilities; for example,
trunks and links. These reports are usually run on a daily, weekly, and monthly
basis.
Network Availability
0
Network Availability reports show the percent availability of nodes and trunks.
Availability is calculated from a centralized network management perspective.
Both node and trunk availability are based on alarms coming from the node via
the console connection. They are calculated daily by StarKeeper II NMS. The percentage is the average daily availability. If the console connection is down for any
reason, the percentage in the report will be less than 100%.
Module Performance
0
Module Performance reports show the traffic loading and error summary information for low level physical components. You can select from module, port, channel,
or facility level information, depending on what you need. These reports are available for all types of modules. These reports are used to troubleshoot specific
problems (on a module or port) that have been identified in either an exception
report, a high level report, or via customer feedback. An example of a high level
report is a Bandwidth Utilization report.
Graphical Options
All types of usage and performance reports, described above, are available in tabular form. Some reports are also available in graphical format.
The following reports can be requested in graphical format.
■
Bandwidth Utilization: Link: Module address
■
Bandwidth Utilization: Trunk: Module address or Trunk name
■
Port Capacity Utilization: Module address
When requesting the above graphical format reports, be aware that all is not a
valid option. Individual node names must be selected for the Port Capacity Utilization: Module address, Bandwidth Utilization Trunk: Module address, and Bandwidth Utilization Link: Module address reports. An individual trunk name must be
selected for the Bandwidth Utilization Trunk: Trunk name report.
1-30
StarKeeper II NMS Graphics System Guide, R10.0, Issue 1
StarKeeper II NMS Graphics System Overview
Where Do You Go From Here?
Your first step in using Performance Reporter depends on the availability of the
application and your experience. Refer to the following table for your particular situation.
Situation
Reference
Installing Performance Reporter
StarKeeper II NMS Core System
Guide
How to use HP VUE
Using Your HP Workstation
Adding and removing Performance Reporter users
Chapter 2
Administer Performance Reporter (activate thresholding, change threshold values, update configuration data)
Chapter 14
Check status of performance connections to nodes
StarKeeper II NMS Core System
Guide
Schedule performance data collection on nodes
StarKeeper II NMS Core System
Guide
Access exception reports
Chapter 14
Run on-demand performance reports
Chapter 14
Schedule performance reports
Chapter 15
Maintain report files and schedules
Chapter 16
StarKeeper II NMS Graphics System Guide, R10.0, Issue 1
1-31
StarKeeper II NMS Graphics System Overview
1-32
StarKeeper II NMS Graphics System Guide, R10.0, Issue 1
Administering the Graphics
System
0
2
We assume that you have completed the installation of your StarKeeper II NMS
software. If you have not yet done so, please refer to the StarKeeper II NMS Core
System Guide for instructions on how to install the software. The procedures in
this chapter may be executed only after the software has been installed.
Before beginning administration procedures, you must first have an HP-UX login
and have superuser privilege.
Adding HP-UX Logins
Before a user can access the Graphics System, the user must have a valid
HP-UX login. To obtain an HP-UX login for a user, run the System Administration
Manager (SAM) on your HP host computer. See the HP System Administration
Tasks Manual for more information.
Adding Graphics System Users
The adduser command allows a user to access the Graphics System. When you
run adduser, you specify which applications a user is authorized to access. You
are presented with the following options:
■
Graphics System Platform - allows the user to access the Bulletin Board
and Cut-Through applications of the Graphics System Platform.
■
Workstation Administration - allows the user to access the Workstation
Administration application of the Graphics System Platform. Note that as a
workstation administrator, a user is granted special privileges, including the
following:
— the user can start and stop the Graphics System
— the user can activate and inactivate connections between the
Graphics System and Core Systems
— the user can set various administrative parameters for the Graphics
System
StarKeeper II NMS Graphics System Guide, R10.0, Issue 1
2-1
Administering the Graphics System
See Chapter 5 for a complete discussion of the Workstation Administration
application.
■
Network Monitor - allows the user to access the Network Monitor
application.
■
Performance Reporter - allows the user to access the Performance
Reporter application.
■
Network Builder - allows the user to access the Network Builder
application. You specify whether the user has read-only permission, or
configure (read-and-write) permission. If the user has read-only
permission, they may perform the Network Builder Load operation in order
to view configuration data, but they cannot Submit a loaded task for
update, nor can they perform Network Builder New or Delete operations.
You may specify any combination of the above. If you specify any one of Network
Monitor, Performance Reporter or Network Builder, the user is automatically
authorized to access the Graphics System Platform (Bulletin Board and CutThrough).
The adduser command will also establish an HP VUE environment for the user
and will add an icon and menu mark for the StarKeeper II NMS subpanel to the
user's HP VUE Front Panel. Each Graphics System application that you
authorized for the user when you ran the adduser command will be displayed as
an icon in the StarKeeper II NMS subpanel.
NOTE:
The adduser command should not be run for a user when that user is
logged onto the system. If the user is logged onto the system, changes
made by the adduser command may not be properly saved when the user
logs off. Make sure the user is not logged onto the system before running
adduser.
Procedure 2-1.
Adding Graphics System Users
To add a Graphics System user, do the following:
1. Log in as root.
2. Enter . /usr/share/lib/pub/AP_ROOT
3. Enter $AP_ROOT/bin/adduser
You will be prompted to enter the login ID for the user you wish to authorize, and
you will be asked to select the application(s) for which you would like the user
authorized. When you are finished authorizing users, enter q to quit the adduser
command.
2-2
StarKeeper II NMS Graphics System Guide, R10.0, Issue 1
Administering the Graphics System
Removing Graphics System Users
The remuser command allows you to deny a user access to the Graphics System
or any of its applications previously granted by the adduser command.
NOTE:
The remuser command should not be run for a user when that user is
logged onto the system. If the user is logged onto the system, changes
made by the remuser command may not be properly saved when the user
logs off. Make sure the user is not logged onto the system before running
remuser.
Procedure 2-2.
Removing Graphics System Users
To remove a Graphics System user, do the following:
1. Log in as root
2. Enter . /usr/share/lib/pub/AP_ROOT
3. Enter $AP_ROOT/bin/remuser
You will be prompted to enter the login ID for the user. You will then be presented
with a numbered list of Graphics System applications for which the user was
authorized to access by the adduser command. Enter the applications to which
the user should be denied access.
You may specify any combination of applications assigned to the user. However, if
you specify the Graphics System Platform as one of the applications to remove,
then all other applications assigned to the user will be removed as well.
Removing Graphics System
Applications Software
This section describes the procedure to remove the software for any of the
Graphics System applications. Use this procedure when you want to remove
software from the system completely.
NOTE:
It is not necessary to remove the software when you are installing a new
version of the software. The new software will be installed in place of the old
software.
StarKeeper II NMS Graphics System Guide, R10.0, Issue 1
2-3
Administering the Graphics System
NOTE:
You must stop the Graphics System from running before removing Graphics
System software. (See the section Stopping the Graphics System later in
this chapter).
Procedure 2-3.
Removing Graphics System Software
To remove Graphics System applications software, do the following:
1.
Log in as root
2.
Stop the Graphics System. (See the section Stopping the Graphics
System later in this chapter). Wait for the system to display a message
telling you that StarKeeper II NMS has been shut down.
3.
Enter . /usr/share/lib/pub/AP_ROOT
4.
Enter $AP_ROOT/bin/Remove
You will then be presented with a numbered list of Graphics System applications
that have been installed on the system. Enter the applications you wish to remove.
You will receive a confirmation message for each application that is removed.
When you are finished, you may restart the Graphics System. (See the section
Starting the Graphics System later in this chapter).
Verifying Graphics System
Applications Software
To view the list of Graphics System application software and supporting software
currently installed on the system, do the following:
Procedure 2-4.
Verifying Graphics System Software
1.
Log in as root
2.
Enter . /usr/share/lib/pub/AP_ROOT
3.
Enter $AP_ROOT/bin/Display -i
In addition to the -i option, other options are available for the Display command.
To view a list of these options and see what they do, run the command using the
-h option.
2-4
StarKeeper II NMS Graphics System Guide, R10.0, Issue 1
Administering the Graphics System
Starting the Graphics System
The Graphics System software should be running. However, if you are not sure,
enter the command startws at the system prompt. The startws command starts
all Graphics System processes. If the Graphics System is running, the message
StarKeeper II NMS Workstation Software is already running.
To terminate, enter "stopws".
is output. If you have a need to start the Graphics System, use this command.
Before you use this command, you must be authorized as a Workstation Administration user, obtained by using the adduser command. Also, the Bulletin Board
should be up when you use this command, or you should run the “Display -g”
command to see if other users are present before shutting down the workstation.
To start a Co-resident system, use the SKsh command at the SK prompt. The
system displays the SKsh main menu. From there, select SYSADM to display the
SYSADM sub-menu, then select STARTSK, and respond y to the continue
prompt. Refer to the StarKeeper II NMS Core System Guide for further information on the SKsh command.
Stopping the Graphics System
The stopws -k command terminates the Graphics System software as well as all
users’ graphics applications. Use the Display -g command to check for other
users before shutting down the software.
The stopws -k command is entered at the system prompt. You must be
recognized as a Workstation Administration user by using the adduser command
before you can use stopws.
To terminate a Co-resident system, use the SKsh command at the SK prompt.
The system displays the SKsh main menu. From there, select SYSADM to display
the SYSADM sub-menu, then select SHUTSK, and respond y to the continue
prompt. Refer to the StarKeeper II NMS Core System Guide for further information on the SKsh command.
Core and Graphics System
Communications
Before Core Systems and Graphics Systems can communicate with each other,
several administrative tasks must be performed. The following lists the steps you
must take.
StarKeeper II NMS Graphics System Guide, R10.0, Issue 1
2-5
Administering the Graphics System
1. Administer Local Machine Parameters on all Core Systems and Graphics
Systems within your StarKeeper II NMS network.
2. Administer connections from the Graphics Systems to the Core Systems.
3. Verify all connections are successful.
4. Synchronize the Graphics Systems with the Core System node connection
data.
You might encounter problems during some of these steps. This section describes
troubleshooting procedures that can be used to isolate problems.
For a more in-depth analysis of some of the concepts discussed in this section,
see Chapter 2, Host Interface Installation and Administration, and Chapter 4, System Administration in the StarKeeper II NMS Core System Guide.
Administer Local Machine Parameters
The following three parameters must be defined on each machine.
■
Local Machine ID
The Local Machine ID is an integer between 1 and 100, inclusive, and must
be unique among other StarKeeper II NMS machines within the StarKeeper
II NMS network. Thus, the assignment of the local machine ID must be
made with consideration of the machine IDs that are assigned to the other
StarKeeper II NMS Core Systems and Graphics Systems that comprise the
network.
■
Local Service Address
The local service address must be the fully qualified service address for the
local machine. This service address must be entered into the node that
provides network connectivity for the local machine. A service address may
contain up to four levels, with each level containing up to eight characters
or digits. This address is the service address used by the dkserver process
and by convention the right most portion is typically the uname of the
machine.
■
Local Listener Address
The local listener address is the address that the listener process on the
local machine responds to when a remote StarKeeper II NMS attempts to
establish a connection to the local machine. The listener address must be
fully qualified and entered as a service address in the node that provides
network connectivity for the local machine. A listener address consists of
up to four levels, with each level containing up to eight characters or digits.
By convention, the lowest level of the listener address is the uname of the
2-6
StarKeeper II NMS Graphics System Guide, R10.0, Issue 1
Administering the Graphics System
local machine in all capital letters. The StarKeeper II NMS installation
process will automatically set the listener address for you using this
convention.
NOTE:
A fully qualified address is the complete path of the service address such
as network/area/exch/localname or area/exch/localname. For example, the
Local Service Address for the machine whose uname is bear might be usa/
nj/town/bear. The Local Listener Address for the same machine may be
usa/nj/town/BEAR.
You will administer these parameters when installing your StarKeeper II NMS software. You can also modify this information any time after installation on the
Graphics System via the Modify Local Parameters window, available from Workstation Administration.
The following table can be used to keep track of the parameters assigned to your
StarKeeper II NMS Core Systems and Graphics Systems.
Table 2-1.
StarKeeper II NMS Machine Parameters
Starkeeper II NMS Machine Parameters
Machine Uname
Machine ID
Local Service Address
StarKeeper II NMS Graphics System Guide, R10.0, Issue 1
Local Listener Address
2-7
Administering the Graphics System
Table 2-1.
StarKeeper II NMS Machine Parameters—Continued
Starkeeper II NMS Machine Parameters
Machine Uname
Machine ID
Local Service Address
Local Listener Address
To guide you, we will be using a sample StarKeeper II NMS network that consists
of two Core Systems and two Graphics Systems. We will call these machines
skcore1, skcore2, ws1, and ws2.
The following machine parameters are assigned to these machines.
Starkeeper II NMS Machine Parameters
Machine Uname
Machine ID
Local Service
Address
Local Listener
Address
skcore1
1
nj/net/skcore1
nj/net/SKCORE1
skcore2
2
nj/net/skcore2
nj/net/SKCORE2
ws1
3
nj/net/ws1
nj/net/WS1
ws2
4
nj/net/ws2
nj/net/WS2
Administering Connections
After machine parameters are administered, the next step is to administer connections between Graphics Systems and Core Systems. The following diagram
shows the logical network view of how we plan to connect the Core Systems and
2-8
StarKeeper II NMS Graphics System Guide, R10.0, Issue 1
Administering the Graphics System
Graphics Systems in our example network. Physically, these connections will be
made through the nodes in the network.
ws1
Network Builder
ws2
Network Monitor &
Performance Reporter
skcore2
skcore1
Console & Admin
Connections
Figure 2-1.
Performance
Connections
Administered Connections in a Network
In the preceding diagram, the Core Systems are administered such that skcore1
has all the console and administrative connections and is used to collect alarms,
and provide passthru access to the nodes. skcore2 monitors the performance
connections for all other node types and stores their performance measurements
data. On ws1 we will install the Network Builder software and on ws2 we will
install Network Monitor and Performance Reporter. Based on the functions of the
Core Systems and the applications installed, ws1 must connect to skcore1 to
access the administrative connections. ws2 with Performance Reporter and Network Monitor must connect to both StarKeeper II NMS Core Systems.
To administer connections from the Graphics Systems to the Core Systems, use
the Add/Delete/Modify Connections window available from Workstation
Administration. This must be done on each Graphics System. The fields
required are:
■
System Name
The uname of the Core System that you are connecting to.
■
Listener Address
This is the listener address of the Core System you are connecting to.
■
Status Flag
The status of the connection, either active or inactive.
The following shows the information administered for ws1, which has one connection administered to skcore1.
System Name: skcore1
Listener Address: nj/net/SKCORE1
Status: Active
StarKeeper II NMS Graphics System Guide, R10.0, Issue 1
2-9
Administering the Graphics System
Verify Connection Status
Once the connection information is entered, the Graphics System will try to
establish a connection to all Core Systems where the Status Flag is active. Use
Workstation Administration, View, Connection Status to see the status of the
connections.
If the connection is successful (status is Connected), refer to the section Synchronizing Connections Data. If the connection is unsuccessful (status is Disconnected), continue with the following section to troubleshoot the problem.
Troubleshooting Failed Connections
If a connection is unsuccessful, inactivate and activate the connection, and the
Graphics System will try again to connect to the Core System. If the second
attempt is also unsuccessful, the problem is most likely with the listener address.
Here’s how the connection is established. The Graphics System first calls the
Core System using the listener address you specified. It also sends the Graphics
Systems local listener address (the one you defined for the Graphics System) to
the Core System. The Core System then tries to call back the Graphics System
using that listener address. The connection may fail because of one of a few reasons:
1. The listener address you specified for the Core System is not defined correctly.
2. The listener address you specified for the Core System is defined correctly,
but it may not be administered in all the nodes within the network path from
the Graphics System to the Core System, or is not in service.
3. The local listener address for the Graphics System (administered via the
Modify Local Parameters window), is not defined correctly.
4. The local listener address is not known to all the nodes within the network
path from the Core System to the Graphics System.
5. The local listener address is defined at all the nodes, but may not be in service.
6. The listener process on the Graphics System is not accepting incoming
calls.
7. The StarKeeper II NMS software is not running on the Core System.
8. The Core System machine parameters are not administered.
To isolate the problem, here are some steps you can take.
2-10
StarKeeper II NMS Graphics System Guide, R10.0, Issue 1
Administering the Graphics System
1. Verify that the local listener address is administered correctly for the Graphics System. You can do this by choosing Modify Local Parameters and
viewing how it is administered.
2. Verify that the Core System listener address is defined properly in the Add/
Delete/Modify Connections window for the failed connection.
3. Verify that a call can be established from the Graphics System to the Core
System. To do this, obtain a Cut-Through window to your Graphics System
and execute the following:
dkcu Core-System-listener-address
where Core-System-listener-address is the address defined via the Add/
Delete/Modify Connections window for this Core System connection.
For example, at ws1 you would type dkcu nj/net/SKCORE1.
If successful, the following message is displayed:
Circuit Open
Enter "~." to terminate the call and get back to the UNIX prompt.
If any error messages appear, you know there is a problem in the administration of this address for the nodes in the path from the Graphics System
to the Core System.
See the section dkcu Error Messages later in this chapter for possible
error messages and their meanings.
4. Verify that the call can be established from the Core System to the Graphics System. To do this, execute the following from the Core System.
dkcu Graphics-System-listener-address
where Graphics-System-listener-address is that defined via Modify Local
Parameters in Workstation Administration.
For example, at skcore1 type dkcu nj/net/WS1.
If successful, the following message is displayed:
Circuit Open
Enter "~." to terminate the call and get back to the UNIX prompt.
If any error messages appear, you know there is a problem in the administration of this address for the nodes in the path from the Core System to the
Graphics System.
See the section dkcu Error Messages later in this chapter for possible
error messages and their meanings.
5. Verify that the listener process is running, by executing the command:
nlsadmin -x
StarKeeper II NMS Graphics System Guide, R10.0, Issue 1
2-11
Administering the Graphics System
on both the Graphics System and Core System. If the output of this command shows INACTIVE, then the listener is not running. If the listener is
not running on either machine, you can restart it by running the following
command as user root:
nlsadmin -s mx
Once you determine the problem, inactivate and activate the connection on the
Graphics System to re-establish the connection. If it is now successful, refer to the
next section, Synchronizing Connections Data.
If you checked all the above and the problem is still not solved, please contact
your support organization.
Synchronizing Connections Data
Once the connection is successful, it is a good idea to invoke the Synchronize
Connections window via Workstation Administration, to make sure the Core
System connection information is synchronized on the Graphics System. If the
synchronization fails, run the command again. If it continues to fail, then there is
most likely a problem with the Graphic System local service address.
Troubleshooting Connection Synchronization
Failures
The Synchronize Connections window sends a message to each Core System
asking it to push all its connection information to the Graphics System.
Synchronization may fail for one of the following reasons:
a. You have incorrectly defined the local service address for the Graphics
System.
b. The local service address is not known to all the nodes within the network
path from the Core System to the Graphics System.
c. The local service address is defined at all the nodes, but may not be in service.
d. The dkserver process on the Graphics System is not accepting incoming
calls.
A good way to isolate the problem is to execute the following command from the
Core System.
dkcu Graphics-System-service-address
where Graphics-System-service-address is defined on the Graphics System via
the Modify Local Parameters window.
2-12
StarKeeper II NMS Graphics System Guide, R10.0, Issue 1
Administering the Graphics System
If successful, you will see a login: prompt.
Enter "~." to terminate the call and get back to the UNIX prompt.
If there are any errors see the section dkcu Error Messages later in this chapter
for possible error messages and their meanings.
Additional Help
If the above information does not solve your problems, additional troubleshooting
information can be found in the help file LD_SCP. You can view this file by the executing the command help LD_SCP on a Core System.
dkcu Error Messages
Possible dkcu error messages include:
—
Can’t connect to XX/XXX/XXXX: Remote Node not answering
A node within the path of this call is not available and no alternate path is
defined.
—
Can’t connect to XX/XXX/XXXX: Server not answering
This indicates the dkserver process is not running on the machine you are
calling.
—
Can’t connect to XX/XXX/XXXX: Non-assigned number
The address specified is not defined in all the nodes in the network path.
Alternately, the address is defined but is not in service.
Netstation Administration
StarKeeper II NMS supports the display of graphics applications on Netstations in
addition to the console. Using a Local Area Network (LAN), Netstations provide
multiple, simultaneous access to graphics applications. This chapter assumes the
LAN is already installed.
There are four supported Netstations for StarKeeper II NMS. They are the HP
ENVIZEX II, HP 700/RX, HP ENVIZEX a Series and HP ENVIZEX p Series
Netstations. Though the addressing concepts described in this chapter are
general, the following discussion and directions for the administration of a
Netstation are directed toward the use of this particular Netstation. See the
appropriate Netstation manual for details.
StarKeeper II NMS Graphics System Guide, R10.0, Issue 1
2-13
Administering the Graphics System
This section discusses the actions that you must do to use Netstations with your
StarKeeper II NMS application packages. These action items are
■
administer the host server
■
administer the Netstation
Because of the presence of a network (the LAN), your Netstation requires that you
configure the host and the Netstation so each knows about the presence of the
other; this is done by assigning addresses to the Netstations and to the network
hosts. Addresses can take several forms according to the type of protocol in use.
To administer your hosts and Netstations, you must:
■
add each planned Netstation to the host server (Procedure 2-5)
■
if necessary, remove unwanted Netstations (Procedure 2-6)
■
administer the Netstation (Procedure 2-7)
Instructions to complete these tasks follow.
The Host Server
When a Netstation is started, it downloads files from a host called a File Server.
You may choose any host to serve as your Netstation's File Server. You must
administer configuration data for the Netstation on the host in order for the host to
act as the File Server for the Netstation. A procedure for performing this task is
given later. In addition, you may also choose an Alternate File Server. Your
Netstation will download files from the Alternate File Server if the primary File
Server is not available.
If you choose to have an Alternate File Server, then you must also administer
configuration data for the Netstation on that host in order for the host to act as the
Alternative File Server.
Administering Netstations and Host Servers involves:
■
assigning a name for each Netstation
■
assigning a unique IP (network level) address to each of the hosts
and Netstations
■
entering the hardware (link level) address of each Netstation
Netstation Name
Each Netstation must have its own name; as an example, we are using the name
john_doe in Procedure 2-5. The name for each Netstation may contain letters or
digits up to 64 characters in length, but it must begin with a letter.
2-14
StarKeeper II NMS Graphics System Guide, R10.0, Issue 1
Administering the Graphics System
Network Level Addressing
The network software can use many different types of protocols. The HPsupported protocol is the TCP/IP protocol. The IP (Internet Protocol) uses an
Internet Address, which is software configurable, to identify the network hosts
and Netstations. This address is often referred to simply as the IP address. The IP
address is a 32-bit number that has the form: n.m.p.q, where n, m, p and q are
each decimal integers in the range 0 to 255. 135.22.40.11 is an example of an IP
address. To determine the IP address of your host and Netstation, consult your
LAN administrator.
Link Level Addressing
The Link Level address is the unique address of the Netstation. It is the address
of the LAN interface card, which has been set by the factory and cannot be
changed. You will have to determine the link level address of each Netstation you
expect to have in your network. This link level address will be used later when
configuring the Netstation on the host.
There are two ways to determine the unique link level address for your Netstation.
The first is to look for the hardware address on a shipping label that accompanied
your Netstation. At the bottom of one of these labels is a line that begins with
Ethernet Link Level Address:, which is followed by a 12-digit hexadecimal number
that starts with the sequence 0x080009. Copy down the entire sequence of 12
digits for each Netstation you expect to use. Another way to determine the link
level address is to power up your Netstation. As the Netstation boots, a line will be
displayed on the screen beginning with Hardware Address: followed by a 12-digit
hexadecimal number. Record the entire sequence of 12 digits for the Netstation.
Administration on the Host Server
Procedure 2-5.
Adding a Netstation to a Host Server
1.
On the host server, log in as root.
2.
Enter sam.
Choose the HP Netstation Administration option. Then, a menu
labeled HP NETSTATION ADMINISTRATIVE TASKS appears. At this
menu, follow the prompts and instructions on the screen until the
procedure to add a Netstation is completed. You are asked for specific
information. Note that john_doe and 135.22.40.11,35.22.40.90,
080009333333 are sample entries. Supply your own choices for names
and addresses.
StarKeeper II NMS Graphics System Guide, R10.0, Issue 1
2-15
Administering the Graphics System
Please enter Selection (default=1):
Enter 1
Continue adding a Netstation [y|n] (y):
Enter y
Please enter name of each Netstation to add,
[q|?]:
john_doe
Please enter the IP address of the Netstation in
dot notation, [q|?]:
135.22.40.11
Enter LAN hardware address of Netstation [q|?]:
80009333333
Enter subnet mask in dot notation [q|?] (none):
If you have a subnet
mask, enter it
Enter gateway IP address in dot notation [q|?]
(135.22.40.90):
Enter your gateway IP
address
Name:
john_doe
IP address:
135.22.40.11
LAN hardware address:
80009333333
Subnet mask:
none
Default gateway IP address:
135.22.40.90
Are these correct? [y|n|?] (y):
Enter y
NFS is running on this computer.
Use <machine name> as NFS server for this
netstation? [y|n|?] (y):
Enter n
Copy .xsession script to a user home directory?
[y|n|?] (y):
Enter y
Please enter user login name or q to quit and
continue: (q)
Enter your login name
Add another Netstation [y|n] (y):
Enter n
3.
Type x to exit the program.
NOTE:
Repeat this entire procedure on the primary host for each Netstation to be
added to your network. If you have a secondary host, repeat the entire
procedure on the secondary host for each Netstation to be added to your
network.
2-16
StarKeeper II NMS Graphics System Guide, R10.0, Issue 1
Administering the Graphics System
Procedure 2-6.
Removing a Netstation From a Host Server
1.
On the host server for the Netstation to be removed from the LAN, log in as
root.
2.
Enter sam.
Choose the HP Netstation Administration option. Then, a menu
labeled HP NETSTATION ADMINISTRATIVE TASKS appears. At this
menu, follow the prompts and instructions on the screen until the
procedure to remove a Netstation has been completed. You are asked for
specific information. Note that john_doe is a sample entry. Supply your
own choice of a name. You will be asked for the following:
Please enter selection (default=1):2
Please enter name of Netstation to remove
[q|?]:
Remove Netstation john_doe? [y|n|?]:
3.
Press
4.
Enter x to exit the program.
Return
Enter 2
Enter john_doe
Enter y
to return to the original menu list.
Administration on the Netstation
The following procedure provides a simple set of instructions for administering a
Netstation. If you have problems administering a Netstation, see the appropriate
HP Netstation manual. This document is included with the shipping box containing
your Netstation.
Procedure 2-7.
Administering a Netstation
1.
Ensure that the LAN interface cable is plugged into your Netstation.
2.
Power up your Netstation; the boot screen is displayed. As the station
boots, it tries to download information from the network, but since you have
not yet configured your Netstation it fails.
3.
After the boot fails, press (and hold down) the
of the keyboard for several seconds.
4.
Once the configuration window is displayed, choose the Network window.
5.
The Network window appears. On this window there are two selections:
General and Ethernet. If you click on General, you will see the following
data fields, some that are required and some that are optional. All the fields
are described in the following table, but you only need to complete the
required fields.
StarKeeper II NMS Graphics System Guide, R10.0, Issue 1
F12
function key at the top
2-17
Administering the Graphics System
Field
Description
Network Parms From
A required field. Use your mouse to select the value Enter Below. This
instructs the Netstation to download the necessary fonts only from the
file servers listed in the fields found on this form.
File Server
A required field. This is the host IP address chosen to be your primary
file server. At the right of this field use the mouse to select the value
TFTP.
Alt. File Server
An optional field. This is the host IP address chosen to be your
secondary file server. It is used if the primary file server cannot be
accessed for any reason. At the right of this field also see that TFTP is
displayed. If it is not displayed, use the mouse to choose the NFS
button to display TFTP.
Name Server
An optional field. This is the host IP address chosen to be your primary
name server. It is usually the same as the File Server but need not be.
Alt. Name Server
An optional field. This is the host IP address chosen to be your
secondary name server. It is used if the primary name server cannot be
accessed for any reason. It is usually the same as the Alt. File Server
but need not be.
Domain Name
A required field if the Name Server field is used; otherwise it is an
optional field. Enter the last 3 fields of your Netstation's IP address. For
example, 22.40.11.
Alternate NFS and TFTP
Enable box on right lower corner
Gateway
An optional field. This is the default gateway used by the netstation if it
is not on the same network as the host machine.
If you click on Ethernet, you will see the following data fields:
Field
Description
IP Address
A required field. This is the IP address of the netstation.
Subnet Mask
A required field. This is the subnet mask of the netstation.
Terminal Name
A required field. This is the name of the netstation.
6.
Using the mouse, choose the Terminal window.
7.
The Terminal window appears. Complete the field as described in the
following table.
Field
2-18
Description
File
Enter the name of the Netstation that you are administering. This field
requires a .cfg suffix to the name.
Remote Config
Enable Download.
StarKeeper II NMS Graphics System Guide, R10.0, Issue 1
Administering the Graphics System
8.
Using the mouse, choose Server.
Field
Description
Login
Choose XDMCP Direct.
Login Host
Enter the IP address of your Graphics System host.
X Server from
Enable Network (p Series only).
X Server file
Leave this field blank (p Series only).
Base Path
Enter /usr/lib/X11/700X if it is not already entered in this area
(p Series only).
9.
Choose
OK
.
Changing your Startup Host
When you initially configure your Netstation you choose a Startup Host. You may
change your Startup Host at any time. To do this, do the following:
Procedure 2-8.
Changing Your Startup Host
1.
Login to your Startup Host.
2.
Press and hold the
window.
3.
Choose Startup from the buttons at the top of the window.
4.
Enter the IP address of the new Startup Host in the Startup Host field.
5.
Exit HP VUE and when your login prompt is displayed on the screen it will
be for your new Startup Host.
F12
key until you see the Netstation configuration
Using your 720/730 as a Netstation
To use your 720/730 as a Netstation, do the following:
Procedure 2-9.
Using Your 720/730 as a Netstation
1.
From the Login screen at the View environment, choose the No Windows
option.
2.
Log in as a user.
3.
Run /usr/bin/X11/X :0 -query “name of host machine”.
4.
Log in as a netstation.
StarKeeper II NMS Graphics System Guide, R10.0, Issue 1
2-19
Administering the Graphics System
5.
To exit, type
Control
+
Shift
+
Break
.
NOTE:
The host machine must be entered in the /etc/hosts file of the 720/730
machine.
2-20
StarKeeper II NMS Graphics System Guide, R10.0, Issue 1
Using the StarKeeper II NMS
Graphics System
0
3
The StarKeeper II NMS Graphics System applications are accessed via the HP
Visual User Environment (HP VUE) Front Panel (see Screen 3-1). This chapter
will provide a brief description of how you can access these applications and other
facilities of HP VUE. Refer to the HP document that came with your system titled
Using Your HP Workstation, for detailed information regarding use of your
Graphics System workstation, including use of the Motif GUI, which is the basis of
all Graphics System applications. In addition, extensive on-line help is available in
support of HP VUE; choose the ? icon on the Front Panel to access the HP VUE
Help Manager.
The remainder of this guide assumes that you have a basic understanding of HP
VUE and Motif.
Starting Graphics Applications
After entering your login and password on the HP login screen, the HP VUE Front
Panel will be displayed on your screen.
Screen 3-1.
HP VUE Front Panel
StarKeeper II NMS Graphics System Guide, R10.0, Issue 1
3-1
Using the StarKeeper II NMS Graphics System
On the right side of the Front Panel is the StarKeeper II NMS Graphics System
control.
Screen 3-2.
StarKeeper II NMS Graphics System Control
Click on the arrow above this control to access a subpanel containing controls for
each of the Graphics System applications (see Screen 3-3).
3-2
StarKeeper II NMS Graphics System Guide, R10.0, Issue 1
Using the StarKeeper II NMS Graphics System
Clicking on the control icon itself, when a subpanel is available, will invoke the
default (top-most) application on the subpanel.
Screen 3-3.
StarKeeper II NMS Graphics System Subpanel
You can now select the desired application from this subpanel. The subpanel may
be lowered by clicking on the arrow at the base of the subpanel, or it may be
moved to a convenient location by dragging the subpanel by the title bar. Refer to
the appropriate chapters of this guide for details on using individual applications.
StarKeeper II NMS Graphics System Guide, R10.0, Issue 1
3-3
Using the StarKeeper II NMS Graphics System
Accessing The OS Environment
To gain access to the command line interface to your operating system, or to a
Co-Resident Core System on your workstation, one or more HP Term windows
can be invoked. Click on the terminal icon on the Front Panel, just below the Help
Manager control. This will bring up a window labeled hpterm which can be used
to interact with the operating system (or Core System).
Alternatively, you can use the Cut-Through Application and request a window for
the local environment (Chapter 6).
Printing
Assuming that you have administered your printers as described in Appendix D of
the StarKeeper II NMS Core System Guide, all printing from Graphics System
applications is handled by the application software. Print requests made for any
application will be directed to the appropriate printer automatically.
Capturing Images
To capture screen images for later printing use the following procedure:
Procedure 3-1.
Using the Capture Screen Utility
1.
Open the General Toolbox from the Toolbox subpanel accessed via the
Toolbox icon on the HP VUE Front Panel (just to the left of the Trash Can).
2.
Open the Utilities folder (double-click on its icon).
3.
Start the XwdCapture application (double-click on its icon).
4.
Enter the output filename and click
OK
.
NOTE:
The filename you type must end with .xwd.
5.
If you requested a window capture, click the mouse anywhere within the
window you want to capture. The screen will be saved.
Printing XwdCapture Files
To print captured screen images, use the following procedure:
3-4
StarKeeper II NMS Graphics System Guide, R10.0, Issue 1
Using the StarKeeper II NMS Graphics System
Procedure 3-2.
Printing a File
1.
Open an hpterm window.
2.
For the XwdCapture file, issue the xpr <filename>.xwd | lp command.
You may determine printing status by clicking on a Printer icon. This will bring up
the SharedPrint/UX-Manager. Refer to your HP VUE documentation for more
details regarding printing.
Accessing Your Directory
Click on the File Manager control (the file cabinet icon) on the Front Panel to
access a window containing a graphical representation of your home directory.
You can use this window to traverse your subdirectories and manipulate files and
folders. Files saved by Graphics System applications will usually be found
somewhere within your own directory structure.
Logging Off
To log off the system, use the Exit control located at the lower right of the Front
Panel. You will be asked to confirm your request. Note that any windows or
applications left up at log-off time may be retained, depending upon the settings
you choose via the Startup control on the Style Manager subpanel.
Special HP VUE and Motif
Capabilities
Although the intent of this chapter is not to provide a comprehensive presentation
of HP VUE and Motif capabilities, some of these will be highlighted below due to
their extensive use in this product or because they provide enhanced functionality
worthy of special mention.
Style Manager
The Style Manager is a set of utilities that controls the way your system looks and
operates. The Style Manager control is located just to the left of the Help Manager
icon. Clicking on this icon displays a subpanel providing access to these utilities
(see Screen 3-4). All settings are maintained on a per-user basis, so you can feel
free to customize your workspace as desired.
StarKeeper II NMS Graphics System Guide, R10.0, Issue 1
3-5
Using the StarKeeper II NMS Graphics System
NOTE:
If you set the font size to greater than 12 points, data in some windows may
be truncated.
Screen 3-4.
Style Manager Control
Workspaces
The array of six buttons in the middle of the Front Panel control which workspace
you want to use at any given time. Each workspace can be considered as an
independent work area that you may move between at any time without affecting
the contents of any of the workspaces. Workspaces may be named using the
control located just below the Style Manager icon. Windows can populate one or
more workspaces by using the appropriate item on the window menu (accessed
via the — window menu icon in the upper left corner of every window).
3-6
StarKeeper II NMS Graphics System Guide, R10.0, Issue 1
Using the StarKeeper II NMS Graphics System
Using Scales
Scales are used throughout the Graphics Systems applications for selecting
numerical values from a range. An example of a scale is shown in Screen 3-5.
Scales can be manipulated via the mouse, keyboard or a combination of the two.
These several methods of setting scale values is especially useful when dealing
with large ranges.
Screen 3-5.
Scale Example
The following table summarizes the ways you can set scale values (The SELECT
button is the left-most button on a right-handed mouse; the ADJUST button is the
middle button):
Action
Effect
Click SELECT on the scale
Moves handle in the direction of the cursor in small increments
Click SELECT on the scale with
CTRL depressed
Moves handle in the direction of the cursor in large increments
Click ADJUST on scale
Moves handle to the cursor’s location
Drag handle using SELECT
Moves handle in the direction of drag
Press left/right arrow key
Moves handle left or right in small increments
Press left/right arrow key with
depressed
CTRL
Moves handle left or right in large increments
Keyboard Shortcuts
All interaction with Graphics System applications can be accomplished via the
keyboard, without use of the mouse. For example, menus and menu items can be
accessed by using the mnemonic identified as the underlined character in the
menu or item name. Holding ALT while pressing the desired mnemonic displays
the associated menu; you can then use the menu item mnemonic (without ALT )
to execute the associated command. Also, within forms TAB will traverse the
StarKeeper II NMS Graphics System Guide, R10.0, Issue 1
3-7
Using the StarKeeper II NMS Graphics System
controls on the form; arrow keys will traverse buttons within a control;
set a button.
SPACE
will
Pop-up command windows will have a default action chosen from among the
command buttons positioned at the base of the window. The default button is
highlighted with a bold outline. You can press RETURN to execute a window's
default action.
There are many other keyboard equivalents that you may find useful; refer to your
HP documentation for full details.
Graphics System Applications
HyperHelp
The StarKeeper II NMS Graphics System provides an on-line Help facility in
support of the Graphics System applications. Help for base windows is accessed
via the Help menu at the top of each of these windows (see Screen 3-6). The
menu provides Help for the current window (On Window), a table of contents for
the current application's Help (Contents), and Help on the Help system itself (On
Help). Help "Version" lets you know what version of the application you are
running.
Screen 3-6.
Help Facility Menu
Help for pop-ups is accessed via Help at the base of each of these windows.
This option places you in the Help system at a location corresponding to the popup from which the request was made.
For all windows, including those that do not have a Help menu or button,
be used to access the Help system.
3-8
F1
can
StarKeeper II NMS Graphics System Guide, R10.0, Issue 1
Using the StarKeeper II NMS Graphics System
For More Information
0
For further information on how to use the HyperHelp function, select On Help
from the Graphics System application’s Help menu. Alternatively, whenever the
HyperHelp viewer is displayed, you can select How to Use Help from the viewer’s
Help menu.
StarKeeper II NMS Graphics System Guide, R10.0, Issue 1
3-9
Using the StarKeeper II NMS Graphics System
3-10
StarKeeper II NMS Graphics System Guide, R10.0, Issue 1
Using the Bulletin Board
Application
0
4
The Bulletin Board application is used to retrieve and display messages sent by
the Graphics System Platform software and the Graphics System applications.
Some messages are informational in content, such as those that indicate normal
status changes. Other messages indicate system problems of varying severity.
Occasionally, messages posted to the Bulletin Board will require the intervention
of the network administrator. As such, the Bulletin Board application provides an
important tool in monitoring the health of the Graphics System.
This chapter describes how to use the Bulletin Board, including how to read
Bulletin Board messages, and how to check the system EVENTLOG to retrieve
old Bulletin Board messages and other system messages.
Starting the Bulletin Board
Application
There are two ways to start the Bulletin Board application. They are given in the
following procedures.
Procedure 4-1.
1.
Starting Bulletin Board from the HP VUE Front Panel
Click on the StarKeeper II NMS icon on the HP VUE Front Panel.
Procedure 4-2.
Starting Bulletin Board from the StarKeeper II NMS
Subpanel
1.
Click on the StarKeeper II NMS menu mark on the HP VUE Front Panel.
This raises the StarKeeper II NMS subpanel.
2.
Click on the Bulletin Board icon in the StarKeeper II NMS subpanel.
Upon completion of either procedure, the Bulletin Board Control Window is
displayed.
StarKeeper II NMS Graphics System Guide, R10.0, Issue 1
4-1
Using the Bulletin Board Application
The Bulletin Board Control Window
The following screen shows the Bulletin Board Control Window.
Screen 4-1.
The Bulletin Board Control Window
The Bulletin Board Control Window consists of a region that displays the login ID
of the user who started the Bulletin Board, and the name of host computer on
which the Graphics System is running. It also contains a raised panel. Whenever
the Graphics System Platform or a Graphics System application posts a message
to the Bulletin Board, a glyph (or graphical symbol) is displayed in the raised panel
region.
The topic of a Bulletin Board message can be determined from the type of glyph
that is displayed. Bulletin Board messages are grouped into four classes, each
with its own distinctive glyph:
■
Graphics System host computer resources
■
Graphics System file system resources
■
Graphics System to Core System communications
■
Graphics System application database access
Multiple glyphs may be displayed simultaneously.
4-2
StarKeeper II NMS Graphics System Guide, R10.0, Issue 1
Using the Bulletin Board Application
Reading Bulletin Board Messages
When a message is posted to the Bulletin Board, you should read that message
as soon as time permits. The following procedures describe how to read and clear
Bulletin Board messages.
Procedure 4-3.
1.
Reading Bulletin Board Messages
To read Bulletin Board messages, click on a glyph in the raised panel of the
Bulletin Board Control Window.
A Message Window appears that contains all of the unread Bulletin Board
messages currently associated with the selected glyph.
2.
To clear the messages displayed in the Message Window from the Bulletin
Board, click OK in the Message Window. This dismisses the window and
removes the glyph from the Bulletin Board. If the glyph does not disappear,
then new messages for that class have arrived and this procedure should
be repeated to retrieve and clear them.
3.
If you do not wish to clear the messages displayed in the Message Window
from the Bulletin Board, click Cancel in the Message Window. This
dismisses the window but does not remove the glyph from the Bulletin
Board. The messages are still considered to be "unread". To retrieve the
messages once again, or to view possibly new messages for that class that
may have arrived, repeat the procedure.
Checking the EVENTLOG
Messages that have been cleared from the Bulletin Board cannot be redisplayed
by the Bulletin Board. However, you can examine cleared messages by reading
the system EVENTLOG. The EVENTLOG tells you if there is anything malfunctioning within the Graphics System. It contains both cleared and uncleared Bulletin Board messages, as well as other, less critical, messages from the Graphics
System Platform and applications.
You can locate the EVENTLOG by using the $EVENTLOG environment variable.
The $EVENTLOG environment variable is defined for all users of the Graphics
System. The $EVENTLOG variable contains the full pathname of the directory in
which EVENTLOG files are stored. A new EVENTLOG file is created each day,
StarKeeper II NMS Graphics System Guide, R10.0, Issue 1
4-3
Using the Bulletin Board Application
each time the Graphics System is started, and each time the size of the file
reaches 200,000 bytes.
The name of an EVENTLOG file consists of the date in which it was created followed by a "." followed by a suffix which represents the file sequence number. The
first EVENTLOG file created for a given day has the suffix "1", the second has the
suffix "2", and so on.
Procedure 4-4.
Checking the EVENTLOG
To check the most recent EVENTLOG file, perform the following procedure:
1.
Start the Cut-Through application and open a Cut-Through window to your
Graphics System (See Chapter 6 for information on the Cut-Through
Application).
2.
Enter cd $EVENTLOG
3.
Enter ls -lt | pg.
4.
If there is a : at the bottom of the window, enter q.
5.
The most recent EVENTLOG file is the first file listed in the window. The
format of the name of an EVENTLOG file is <yymmdd>.<suffix> where:
<yymmdd>
is the numeric representation of the year, month and date in
which the EVENTLOG file was created.
<suffix>
is the suffix, or sequence number, of the EVENTLOG file for
that day.
You can use a text editor, such as vi, or a pager, such as pg, to view the contents
of the entire file. If you wish to examine the most recent activity in the EVENTLOG
file, you can use the tail command to look at the last several lines of the file. For
example, to look at the last 24 lines of the file, enter tail -24 <EVENTLOG_FILE>
where <EVENTLOG_FILE> is the name of the EVENTLOG file.
4-4
StarKeeper II NMS Graphics System Guide, R10.0, Issue 1
Using the Workstation
Administration Application
0
5
This chapter teaches you how to operate the Workstation Administration application. The application includes the:
■
StarKeeper II NMS Connections Administration
■
StarKeeper II NMS Disk Cleaner Administration
■
StarKeeper II NMS Cut-Through Administration
This chapter teaches you how to use the interface so that you will feel more
comfortable as you complete the procedures in this chapter. See the Glossary at
the end of this guide for definitions to unfamiliar terms.
Starting Workstation Administration
You are now ready to start the Workstation Administration application. The WS
Admin icon will appear on the HP VUE Front Panel if the Workstation Administrator has authorized you for Workstation Administration access by using the
adduser command. This procedure assumes that you have a valid login and
Workstation Administration permissions. If you do not have these permissions,
return to Chapter 2 and complete the procedures presented there before you proceed further.
Procedure 5-1.
Starting Workstation Administration
1. Click on the StarKeeper II NMS menu mark of the HP VUE Front Panel.
2. Click on the WS Admin icon.
StarKeeper II NMS Graphics System Guide, R10.0, Issue 1
5-1
Using the Workstation Administration Application
The Workstation Administration
Control Window
This section teaches you how to navigate within and use the Workstation Administration application user interface.
The Workstation Administration Control Window (shown below) consists of several menu options.
Screen 5-1.
Workstation Administration Control Window
The following sections discuss the characteristics of the Workstation Administration Control Window.
The Administer Menu
The Administer menu provides access to the administrative processes. This is
shown in the following screen.
Screen 5-2.
5-2
Administer Menu
StarKeeper II NMS Graphics System Guide, R10.0, Issue 1
Using the Workstation Administration Application
As shown, the Administer menu option provides several choices:
SK II Connections
This button allows the Workstation Administrator to establish
connections to remote Core Systems.
Disk Cleaner
This button allows the Workstation Administrator to specify
files and directories for automatic cleaning.
Cut-Through Apps
This button allows the Workstation Administrator to have simultaneous access to several different computers in a network
from a single Graphics System.
Exit
This button allows users to exit the Workstation Administration
application.
SK II Connections Administration
If you plan to install any of the Graphics System applications, you must establish
connections with the remote Core Systems from which you expect to collect node
configuration, alarm or performance data. Note that these connections are different from Cut-Through connections. Cut-Through connections allow you to open a
login session on a remote (or local) host computer.
To administer connections to remote systems, choose SK II Connections from
the Administer menu. A sub-menu is displayed with the following options.
Add/Delete/Modify
This button adds, deletes, or modifies connection
entries. This button will be used occasionally.
Synchronize
This button updates internal data tables on the
Graphics System that store information about node
connections. It should be used whenever connection entries are added, deleted, or modified on
remote Core Systems (or on the local machine in
the case of a Co-resident System).
Modify Local Parameters
This button administers local parameters to support connections to Core Systems. This button will
be used rarely.
Adding, Deleting, or Modifying Connections
The Add/Delete/Modify option on the SK II Connections menu is equivalent to
using the Core System cf command for adding, deleting or modifying connection
entries. The Add/Delete/Modify Connections Data Window is shown in the following screen. Click on Add/Delete/Modify from the SK II Connections menu to
StarKeeper II NMS Graphics System Guide, R10.0, Issue 1
5-3
Using the Workstation Administration Application
access the Add/Delete/Modify Connections Data Window. Fields and buttons are
described following the screen.
Screen 5-3.
System
Name
This field contains the unique name (maximum eight characters) of the
Core System.
Listener
Address
This field contains the address recognized by the Core System’s listener
process. This address must be entered into the database of the node(s)
that provides BNS-2000 VCS Host Interface access to the Core System.
The address is limited to a maximum of four levels (demarcated by a ‘/’
character), and each level can contain up to eight characters. By convention, the last component of a listener address is the machine’s system name in all uppercase letters.
Status
This field contains settings that indicate whether the connection is active
or inactive.
Insert
5-4
Add/Delete/Modify Connections Window
This button allows you insert a new connection into the list.
StarKeeper II NMS Graphics System Guide, R10.0, Issue 1
Using the Workstation Administration Application
Delete
Edit
This button allows you to delete a connection from the list.
This button allows you to edit existing connection data.
Apply
This button incorporates your final changes. Changes go into effect
immediately.
Reset
This button resets the window settings to the last values in effect prior to
applying any changes you may have made.
Cancel
This button dismisses the window.
The upper part of the window contains a scrolling list (the boxed list) that contains
the System Name of each remote Core System for which connection data has
been entered. This list is identified by the caption Connections To.
Associated with each connection in the scrolling list are three fields of information
— the System Name of the destination machine, the Listener Address, and the
Status setting.
The entries that appear in these three fields are associated with the current connection, that is, the Core System that is highlighted on the scrolling list. The current connection is identified by the highlighted System Name that appears in the
scrolling list. To access data for a different connection (that is, to change the current connection), choose the desired System Name from the scrolling list.
Procedure 5-2.
Using the Modify Connections Data Window
1. To modify the information for a connection already in the list, click on the
entry for that connection in the scrolling list. This brings up the most recent
data for that entry in the data fields below the connection name.
2. Click on the field(s) you want to change (or use the Tab key to traverse
between fields), and modify the text to reflect the new information. To
switch the connection status, click on the setting labeled Active or Inactive. The current status selection is highlighted.
3. When you are finished with your changes, choose Edit
for the connection to which you have made changes.
to update the data
4. To delete a connection, click on the System Name for that connection in
the scrolling list, and then choose Delete . The connection is removed from
the scrolling list.
5. To add a new connection into the scrolling list, enter the System Name and
Listener Address, click on one of the status settings, and then choose
Insert . The connection is added to the scrolling list.
StarKeeper II NMS Graphics System Guide, R10.0, Issue 1
5-5
Using the Workstation Administration Application
6. Click on Apply to save the changes you made since the last Apply operation. It is at this point that new connections are started and that deleted
connections are terminated. Connections for which entries were modified
are brought down and restarted. See the section Viewing Connection
Status later in this chapter to obtain snapshots of connection status.
7.
resets all connection data entries to their states at the time of the
last Apply (or the initial settings if no Apply operation has been performed).
Reset
8. To dismiss the window without executing an Apply operation, click on
Cancel .
Synchronizing Connection Data
Graphics System applications must know which remote Core Systems are monitoring which nodes. As such, the Synchronize option on the SK II Connections
menu must be used whenever a connection to a node on a remote Core System is
added or deleted, or when the ownership of a node is transferred from one Core
System to another Core System. (On a Core System, these operations are done
using the cf commands.) The Synchronize option should also be used on a
Co-resident system when connections are added or deleted on the local machine.
Using the Synchronize option ensures that the Graphics System applications
have an accurate assessment of the network configuration so they can properly
access all available node data from the Core Systems that monitor the nodes. The
Synchronize option does not need to be executed when the status of a connection from a Core System to a node changes (for example, when the connection
status changes from inactive to connected, connected to inactive, or disconnected
to connected).
To dismiss the Synchronize Connections Window, click and hold the window
menu icon, then select Close from the menu.
Modifying Local Connection Parameters
The Modify Local Parameters option on the SK II Connections menu is used to
administer a set of local parameters to support connections to Core Systems,
where local refers to your Graphics System. Click on Modify Local Parameters
from the SK II Connections menu to access the Modify Local Parameters
Window. The Modify Local Parameters Window is shown in the following screen.
Fields and buttons are described following the screen.
5-6
StarKeeper II NMS Graphics System Guide, R10.0, Issue 1
Using the Workstation Administration Application
Screen 5-4.
Modify Local Parameters Window
Local
Machine ID
This value must be an integer between 1 and 100, inclusive, and must
be unique among other StarKeeper II NMS machines within the StarKeeper II NMS network.
Local
Service
Address
This entry must be the fully qualified service address for the local
machine (this service address must be entered into the node that
provides network connectivity for the local machine). A Local Service
Address can contain up to four levels, with each level containing up to
eight characters or digits.
Local
Listener
Address
This entry is the address that the listener process on the local machine
responds to when a remote StarKeeper II NMS attempts to establish a
connection to the local machine. The Local Listener Address must be
fully qualified and entered as a service address in the node that provides network connectivity for the local machine. A Local Listener
Address can contain up to four levels, with each level containing up to
eight characters or digits. By convention, the lowest level of the Local
Listener Address is the system name of the local machine in all capital letters. You must have root permissions to modify the Local Listener Address field.
StarKeeper II NMS Graphics System Guide, R10.0, Issue 1
5-7
Using the Workstation Administration Application
Apply
This button incorporates your final changes and exits the session.
Reset
This button resets the window settings to the last values in effect prior
to any changes you may have made.
Cancel
This button dismisses the window.
In general, these parameters are administered at the time of installation and do
not need to be changed thereafter. However, if they must be changed for some
reason, the new service address or machine ID parameters will not take effect
until the Graphics System software is stopped and restarted. The listener address
takes effect immediately.
Procedure 5-3.
Using the Modify Local Parameters Window
1. Choose the field(s) you want to change (or traverse between them using
the Tab key), and modify the text to reflect the new information.
2. Click on Apply to store any edits made. Note that the modified parameters
will not be used by the system until it is restarted.
3. The Reset button resets all connection data entries to reflect their states at
the time of the last Apply operation (or the initial settings if no Apply operation has been performed).
4. To dismiss the Modify Local Parameters Window without executing an
Apply operation, simply click on Cancel .
The Disk Cleaner Administration
Window
The Disk Cleaner Administration Window allows a Workstation Administrator to
specify files or directories to be cleaned automatically. A disk-cleaning crontab
process is the method used to accomplish this, where a crontab is a process that
runs automatically at specified times. The crontab is started nightly at a specified
time to remove files/directories automatically according to prescribed retention
intervals.
Click on Disk Cleaner from the Administer menu option to access the Disk
Cleaner Administration Window. The Disk Cleaner Administration Window is
shown in the following screen. Fields and buttons are described following the
screen.
5-8
StarKeeper II NMS Graphics System Guide, R10.0, Issue 1
Using the Workstation Administration Application
Screen 5-5.
Disk Cleaner Administration Window
Defaults
This button resets the window settings to the factory defaults.
Paths
This field specifies the directory (including full pathname) or a specific file that you want to clean (remove).
Type
This field is used to prevent you from accidentally cleaning up a
directory instead of a specific file.
Age
This field specifies the retention period (in days) for the path you
specify in the Path field. The files in the directory specified by Path
are deleted if they are older than the specified age.
Insert
Delete
This button inserts a new path into the menu.
This button deletes a path from the menu.
StarKeeper II NMS Graphics System Guide, R10.0, Issue 1
5-9
Using the Workstation Administration Application
Edit
This button finalizes any changes made to settings associated with
the selected path.
Apply
This button incorporates your final changes and exits the session.
Changes go into effect immediately.
Reset
This button resets the window settings to the last values in effect at
the last Apply operation (or the initial setting if no Apply operation
has been performed).
Cancel
This button dismisses the window.
Procedure 5-4.
Using the Disk Cleaner Administration Window
Use the Disk Cleaner Administration Window to customize the pathnames you
want to clean.
1. To access a specific path in the Paths scrolling list, click on the desired
path in the scrolling list. Pathnames are highlighted as they are chosen.
This brings up the current data for the Path entry you want to edit in the
Path, Type, and Age fields.
2. Modify the field value as desired.
3. When you have completed your changes, click on Edit to save your
changes. If Path contains an environment variable, it will be expanded.
4. To delete a pathname from the Paths scrolling list, choose that entry from
the list. Click on Delete . The pathname is removed from the scrolling list.
5. To insert a new pathname into the Paths scrolling list, enter the new information in the Path, Type and Age fields, then click on Insert to insert the
entry into the scrolling list.
6. Click on Apply to save the changes you have made since the last Apply
operation. Reset resets the Disk Cleaner Administration Window settings
to their states at the time of the last Apply (or the initial settings if no Apply
operation has been performed).
The Disk Cleaner process is executed each night by the crontab process at
3:00 a.m.
5-10
StarKeeper II NMS Graphics System Guide, R10.0, Issue 1
Using the Workstation Administration Application
The Cut-Through Administration
Window
The Cut-Through Administration Window allows a Workstation Administrator to
centrally administer computers that will be available to all HP VUE users on the
Graphics System via the Cut-Through application. Only the Workstation Administrator will have the ability to modify information about these machines. The Workstation Administrator may want to centrally administer machine information for
each Core System within the network, so that each HP VUE user may have
access to that Core System via the Cut-Through capability.
To access this feature, click on Cut-Through Apps from the Administer menu.
The following window will be displayed.
Screen 5-6.
Cut-Through Administration Window
StarKeeper II NMS Graphics System Guide, R10.0, Issue 1
5-11
Using the Workstation Administration Application
Default
This button resets the window settings to the factory defaults.
Computer Names
This is a scrolling list of machine names that have been administered for the Cut-Through application.
Name
This field specifies how the machine is to be identified on the
Cut-Through Control Window.
Dial String
This field is the network address of the machine to which node is
expected to connect.
Connection Type
This field tells the node how to connect to the specified address.
This button inserts a new path into the menu.
Insert
This button deletes a path from the menu.
Delete
Edit
This button finalizes any changes made to settings associated
with the selected path.
Apply
This button incorporates your final changes and exits the session.
Changes go into effect immediately.
Reset
This button resets the window settings to the last values in effect
at the last Apply operation (or the initial setting if no Apply operation has been performed).
Cancel
This button dismisses the window.
Procedure 5-5.
Using the Cut-Through Administration Window
1. Click on the computer name you want to modify in the Computer Names
list.
This brings up the current data for that entry in the three fields following the
list of computer names.
2. Modify the field values as desired.
Choose Host Interface if the computer to which you want to connect is
running the HP-UX operating system and it is connected to the network via
the BNS-2000 VCS Host Interface. If these conditions are not applicable,
choose Other.
The Host Interface connection type uses software that allows automatic
login to the designated computer. The Other connection type causes
Cut-Through to engage the default login protocol for the designated
computer.
3. When you have completed your changes, click on
dow settings.
5-12
Edit
to update the win-
StarKeeper II NMS Graphics System Guide, R10.0, Issue 1
Using the Workstation Administration Application
4. To delete a computer name from the list, choose the entry for that computer
name from the scrolling list, and then click on Delete . The computer name
is removed from the scrolling list.
5. To insert a new computer name into the Computer Names scrolling list,
enter the new information in the proper fields and click on Insert .
6. Click
Apply
to save the changes you made since the last Apply operation.
Viewing Connection Status
To view connection status, choose Connections Status from the View menu.
The following window will be displayed.
Screen 5-7.
Connection Status Window
The Connection Status Window displays the current status of Graphics
System to Core System connections.
Choose
Cancel
to dismiss the window.
NOTE:
For a Co-resident System, the connection to the local machine will
not appear.
StarKeeper II NMS Graphics System Guide, R10.0, Issue 1
5-13
Using the Workstation Administration Application
5-14
StarKeeper II NMS Graphics System Guide, R10.0, Issue 1
Using the Cut-Through
Application
0
6
This chapter teaches you how to operate and optionally customize the CutThrough application. The Cut-Through application enables you to have simultaneous access to several different computers from a single Graphics System. It
allows you to open a login session on a remote (or local) host computer. It provides windows through which you can communicate with the other computers that
are accessible through the network. Cut-Through connections are based on the
principles of the BNS-2000 VCS Host Interface package dkcu command, which
requires that you specify the full service address of the desired remote host computer when administering Cut-Through connections. Using the Cut-Through application, you can communicate with a remote computer as though you had logged
into it directly.
NOTE:
If you use the Cut-Through connection to connect to a Core System, we
recommend that you set the terminal type to hpterm when prompted.
Starting the Cut-Through Application
You are now ready to start the Cut-Through application. This procedure assumes
that you have a valid login. If you do not have these permissions, return to Chapter 2 of this guide and complete the procedures presented there before you proceed further.
Procedure 6-1.
Starting Cut-Through
1. Click on the StarKeeper II NMS menu mark of the HP VUE Front Panel.
2. Click on Cut-Through.
The Cut-Through Control Window will be displayed.
StarKeeper II NMS Graphics System Guide, R10.0, Issue 1
6-1
Using the Cut-Through Application
The Cut-Through Control Window
This section teaches you how to navigate within and use the Cut-Through application user interface.
Screen 6-1.
6-2
Cut-Through Control Window
StarKeeper II NMS Graphics System Guide, R10.0, Issue 1
Using the Cut-Through Application
The File Menu
The File menu option is used to customize Cut-Through. The Cut-Through Control Window with the File menu is shown in the following screen.
Screen 6-2.
Cut-Through Control Window with File Option
The File menu provides the following choices:
Add-On Computers
This provides the capability to modify a local set of computers
for your login. You will not be able to modify any computer
administered centrally by the Workstation Administrator. You
can add new computers, delete computers, change the
dialstrings and login protocols associated with computers, or
rearrange the order of the list.
Exit
This exits the Cut-Through application.
The Connect Button
The Connect button is used to open a Connection Window (a type of interactive
text window) to establish a session with a specified computer. The Connection
Window is described in the Using the Connection Window procedure later in
this chapter.
StarKeeper II NMS Graphics System Guide, R10.0, Issue 1
6-3
Using the Cut-Through Application
The Authorize Button
The Authorize button is used to open an Authorization Window, (also an interactive text window) and to execute authorization service on a specified computer
equipped with the BNS-2000 VCS Host Interface. Before exercising the automatic
login capability, you must obtain authorization to do so. Authorization is obtained
on an individual computer and individual login basis. Therefore, it is necessary to
obtain separate authorization for each computer on the Computers scrolling list for
which you want to use this capability. The Authorization Window is described in
the Using the Authorization Window procedure later in this chapter.
The Computers Scrolling List
This list contains the names of all computers known to the Cut-Through application and identifies the computers with which you can communicate. The list is
compiled from two sources:
■
a system-wide file that is administered centrally via the Workstation Administration application, and
■
a user-defined and administered file for storing the computer names and
connection data.
The Cut-Through Application
Connection Window
This section teaches you how to work within the Cut-Through application. The following procedures are required to connect a user to a specified computer.
Procedure 6-2.
Using the Connection Window
1. Locate the name of the computer to which you want to connect in the Computers scrolling list on the Cut-Through Control Window. Use the scrollbar
to access names that have scrolled out of view.
2. Move the pointer over the name, and click. This action causes a border to
appear around the name.
3. Next, move the pointer over the
6-4
Connect
button and click.
StarKeeper II NMS Graphics System Guide, R10.0, Issue 1
Using the Cut-Through Application
The following window is displayed and you will be connected to the computer you
specified.
Screen 6-3.
Connection Window
As shown, it consists of a border area and a large text pane. The border area
includes a title and a window mark.
The text pane is the region where you interact with the computer named in the
Connection Window title. Anything you type into this text pane is sent directly to
the computer. Using this text pane, you can communicate with the computer in the
same way as you would if you had accessed it via the network.
In some cases you will be logged in to the computer automatically. In other cases,
you may be prompted for a login and password. See the next section to learn
when the different login methods are applicable.
The Cut-Through Authorization Window and
Automatic Login
Automatic login means that you are not required to enter login or password information when you connect to a specified computer.
Before exercising the automatic login capability, you must obtain authorization to
do so. Authorization is obtained on an individual computer and individual login
basis. Therefore, it is necessary to obtain separate authorization for each computer on the Computers scrolling list for which you want to use this capability.
StarKeeper II NMS Graphics System Guide, R10.0, Issue 1
6-5
Using the Cut-Through Application
The following steps are required to obtain authorization for automatic login.
Procedure 6-3.
Automatic Login Procedure
1. Locate the name of the computer for which you are seeking authorization in
the Computers scrolling list on the Cut-Through Control Window. Authorization can only be obtained for a host-connected machine. Use the scrollbar to access names that have scrolled out of view.
2. Move the pointer over the name and click. This causes a border to appear
around the name.
3. Next, move the pointer over the
Authorize
button.
4. If the Authorize button is dimmed, this means that automatic login is not
currently supported on the specified machine and you will not be able to
use the Authorize feature.
5. If the Authorize
appears:
Screen 6-4.
button is sensitive, then click. The following window
Authorization Window
6. The text pane is the region where you interact with the computer authorization service. The authorization service prompts you for your login and password on the target computer.
7. The message Command complete is displayed in the lower left portion of
the Authorization Window after the sequence is complete. You can dismiss
the window at this point. See the next section Dismissing Connection
and Authorization Windows for details about dismissing windows.
8. After you are authorized on the target computer, click on the
ton. You should be logged in automatically.
6-6
Connect
but-
StarKeeper II NMS Graphics System Guide, R10.0, Issue 1
Using the Cut-Through Application
☞ IMPORTANT:
Automatic login is possible only if the following conditions are met:
1. You have a valid login and password on the designated computer.
2. The designated computer is equipped with the BNS-2000 VCS Host Interface, and the interface is operational.
3. The BNS-2000 VCS Host Interface on the designated computer has been
administered so that its remote login service is active and accepting calls
from your computer.
4. The computer name has Host Interface listed as its Connection Type in
the Add-On Computers Window. See The Add-On Computers Window
later in this chapter for details.
Dismissing Connection and
Authorization Windows
Procedure 6-4.
Dismissing Connection and Authorization Windows
from a Window
1. Move the pointer to the window menu icon.
2. Press and hold the mouse button.
3. Drag the pointer to Close and release the mouse button.
The Add-On Computers Window
The Add-On Computers Window allows you to modify, delete, or add computer
names to the Computers list on the Cut-Through Control Window. You have the
option to add your own machines, however you cannot access all computers available. Machines that have been administered centrally cannot be changed and do
not appear on the Add-On Computers Window.
StarKeeper II NMS Graphics System Guide, R10.0, Issue 1
6-7
Using the Cut-Through Application
The Add-On Computers Window is shown in the following screen. Fields and buttons are described following the screen.
Screen 6-5.
6-8
Add-On Computers Window
Computer
Names
This is a scrolling list that contains the names of computers available
for access.
Name
This field specifies how the machine is to be identified on the CutThrough Control Window.
Dialstring
This field contains the network address of the machine to which the
node is expected to connect.
Connection
Type
This field tells the node how to connect to the service address.
StarKeeper II NMS Graphics System Guide, R10.0, Issue 1
Using the Cut-Through Application
Insert
This button allows you to insert a new computer name into the menu.
Delete
This button allows you to delete a computer name from the menu.
Edit
This button updates the window settings.
Apply
This button incorporates your final changes and exits the session.
Changes go into effect immediately.
Reset
This button resets the window settings to the last values in effect prior
to any changes you may have made.
Cancel
This button dismisses the window.
Procedure 6-5.
Using the Add-On Computers Window
1. Click on the name you want to modify.
2. Change field entries as desired.
3. Choose Host Interface if the computer to which you want to connect is
running the HP-UX operating system and it is connected to the network via
the Datakit II VCS Host Interface. If these conditions are not applicable,
choose Other.
4. When you have completed your changes, click on
dow settings.
Edit
to update the win-
5. To delete a computer name from the menu, choose the entry for that computer name from the scrolling list, then click on Delete . The computer name
is removed from the scrolling list.
6. To insert a new computer name into the Computer Names scrolling list,
enter the necessary information in the appropriate fields and click on Insert .
7. Click on
tion.
Apply
to save the changes you made since the last Apply opera-
StarKeeper II NMS Graphics System Guide, R10.0, Issue 1
6-9
Using the Cut-Through Application
6-10
StarKeeper II NMS Graphics System Guide, R10.0, Issue 1
Administering Network Builder 0
7
This chapter provides instructions for the administration of the Network Builder
application.
Before you can use Network Builder to retrieve or send configuration data,
communication between the node and the Core System must be established; see
the StarKeeper II NMS Core System Guide for details. Also, Graphics System to
Core System communications must be established; see Chapter 2, for more
information.
Adding Users
See Chapter 2 for information on adding Network Builder Users.
Removing Users
See Chapter 2 for information on removing Network Builder Users.
Network Builder Tuning
Certain user-tunable parameters for configuration tasks are accessed from the
Network Builder Administer Window under the Options menu. The parameter
values are set at the factory and should suffice; however, you can change them if
you want. The user-tunable parameters are: Task Aging, Maximum Retry
Cycles, and Retry Interval.
If database configuration changes and retry cycles are not successful, you will
receive an error message. If these are recoverable errors, the system will retry to
accomplish the task. Network Builder will retry the task the number of times
specified in the Maximum Retry Cycles control (see Screen 7-1). To solve the
problem of possible communication errors, every Retry Cycle produces two
StarKeeper II NMS Graphics System Guide, R10.0, Issue 1
7-1
Administering Network Builder
retries: the first is thirty seconds after the initial try and the second occurs after the
time specified in the Retry Interval.
After making the set number of Retry Cycles at the set frequency (interval), if the
task is still unsuccessful Network Builder declares the task a failure.
After a task successfully completes, the data associated with the task remains
until the Task Aging interval has elapsed or until another task is started, whichever
comes first. Task Aging does not apply to a task that fails.
To invoke the Network Builder Administer Window, and tune the parameters,
follow the steps in Procedure 7-1.
Procedure 7-1.
1.
Select Options in the menu bar of the Network Builder Control Window.
2.
Select Administer in the Options menu. This raises the Administer
Window.
Screen 7-1.
7-2
Setting Network Builder Tunable Parameters
Network Builder Administer Window
StarKeeper II NMS Graphics System Guide, R10.0, Issue 1
Administering Network Builder
3.
Adjust the appropriate controls (see the following table).
Parameter
Task Aging
Description
Specify the time (in days) between successful task completion and
the time when the task is removed, that is, when all successful log
entries associated with the task are deleted.
0 means "no aging". That is, successful tasks will not be deleted by
aging; they must be viewed to be deleted. This setting may
contribute to excessive disk space utilization. A value of 0 is not
recommended, unless you are troubleshooting a problem and do
not want the data to disappear. But even in this case, we
recommend setting this value to 30. Default is 2.
Max. Retry
Cycles
Specifies the maximum number of retry cycles that will be
attempted before a task is declared "failed". 0 means there will be
no retry cycles for task submission. Default is 150.
Retry Interval
Specifies the time (in minutes) between task retry cycles. Default is
5.
4.
The Apply button incorporates your final changes. The Reset button
resets the window settings to the last values in effect prior to any changes
you may have made. To reset the window to the factory settings (the
defaults), choose Defaults .
StarKeeper II NMS Graphics System Guide, R10.0, Issue 1
7-3
Administering Network Builder
7-4
StarKeeper II NMS Graphics System Guide, R10.0, Issue 1
Using Network Builder to
Configure Your Network
0
82
Provisioning physical and logical resources within a network monitored by StarKeeper II NMS involves manipulating data within one or more node configuration
databases and within one or more StarKeeper II NMS configuration databases.
This provisioning includes adding new equipment (for example, nodes or trunks)
and/or new logical entities (for example, groups or services addresses), changing
the parameters associated with those resources, deleting resources, and viewing
the data corresponding to those resources.
Network Builder assists you in doing these operations from a central location, in a
user-friendly and efficient manner.
The major benefit of using Network Builder to do your configuration is that, in a
single operation, data is sent to both the node databases and the StarKeeper II
NMS Core System databases. Not only does this reduce the effort of
administering the network, but it ensures that the node and StarKeeper II NMS
Core System databases retain the same view of the network.
The value of Network Builder is accentuated when you have to provision
resources such as: trunks, node reroute tables, Frame Relay and SMDS
elements. Each of these activities involves more than one node in your network
and the single configuration operation from Network Builder provides data to each
of the nodes, as well as to the appropriate StarKeeper II NMS Core System
machines. This operation will ensure that each node gets a correct, consistent set
of data and that the StarKeeper II NMS Core Systems reflect that data as well.
Network Builder also provides the tools required to configure SMDS networks.
These tools are comprised of the node, trunk, SNI, ICI Carrier, ICI Prefix, and ICI
Group Address forms. Specification of supported E.164 address ranges on a
node is accomplished via the SMDS pane on the Node form; configuration of T3S
and T3I trunks are accomplished via the Trunk form; configuration of SNIs is
accomplished using the SNI form; configuration of carriers of interest in an interLATA SMDS network (ICI network) is accomplished via the ICI Carrier form;
configuration of address prefixes for SMDS individual and group addresses is
StarKeeper II NMS Graphics System Guide, R10.0, Issue 1
8-1
Using Network Builder to Configure Your Network
accomplished by the ICI Prefix form. Group addresses are configured by the ICI
Group Address form and the SNI form.
Network Builder relies on the StarKeeper II NMS Core System databases for its
view of what is currently configured. Except for ICI configuration data (discussed
later), Network Builder configuration tasks operate in three basic steps:
1.
extract data from the StarKeeper II NMS database
2.
permit your adding, changing, deleting, or viewing the data
3.
configure the result on one or more node databases and on one or more
StarKeeper II NMS Core System databases.
This approach to data configuration provides significant benefits to the network
administrator, but it also implies that the StarKeeper II NMS Core System
databases must be kept up-to-date with respect to the nodes' configurations. It is
essential that the StarKeeper II NMS Core System configuration databases
reflects the current set of parameters that have been administered on the nodes.
The StarKeeper II NMS skload/cfg_sync command is used to keep the database
at the StarKeeper II NMS Core System database synchronized with the data in
the node configuration database. It should be run before using Network Builder;
we also recommend that you put the cfg_sync command in a cron to run nightly
during low-usage hours. See the Database Management chapter in the
StarKeeper II NMS Core System Guide for complete instructions.
Using Network Builder for all configuration tasks on the supported network
elements will ease your concern about keeping the databases synchronized;
however, there is no guarantee that someone hasn't made changes directly at the
node, or through the pass-through feature of StarKeeper II NMS Core System.
Also, the StarKeeper II NMS Core System database contains module level
information and concentrator level information not supported by Network Builder,
which is another reason to run the synchronization commands on a periodic
basis.
8-2
StarKeeper II NMS Graphics System Guide, R10.0, Issue 1
Using Network Builder to Configure Your Network
Starting Network Builder for
Configuration
Network Builder is started by choosing Network Builder from the StarKeeper II
NMS menu on the HP VUE Front Panel. After a few seconds the Network Builder
Control Window is displayed as in the following screen.
Screen 8-1.
Network Builder Control Window
From the Network Builder Control Window, choose the task you wish to complete.
This chapter is based primarily on the Configure menu, which is accessed by
choosing Configure. See Chapter 7 for the administration tasks, which are
accessed from the Options menu and Chapter 9 for the analysis tasks, which are
accessed from the Analyze menu.
Configuration Activity Log
The View menu on the Network Builder Control Window provides access to the
Configuration Activity Log. See the following screen for a sample of the
Configuration Activity Log.
StarKeeper II NMS Graphics System Guide, R10.0, Issue 1
8-3
Using Network Builder to Configure Your Network
Screen 8-2.
An Example Configuration Activity Log
The Configuration Activity Log command window has two control areas with
settings to specify the data you want to see in the log display. One setting
specifies the Status of the log entries to be displayed and the other specifies the
Element Types. The settings are used together to specify the type of data you
want displayed; for example, choose In Progress in the Status field and choose
Trunk in the Element Types field to display the messages reporting trunk tasks
that are still in progress. Both Status and Element Types have an All choice;
setting both to All will display all entries.
The display itself provides data in a scrolling list. Entries in the scrolling list
correspond to tasks that have been previously submitted and which are still
retained on the system. Log entries are preserved for a few days beyond
successful completion of the task or until a user views the Task's form, subject to
"Task Aging." (This is explained in the Network Builder Tuning section of
Chapter 7.) The default for "Task Aging" is 2 days.
Each Activity Log entry describes a single task, and contains the following
information: the time and date of the task submission; the login id of the user who
initiated the task; the type and status of the task; key identifying data for the
network element involved in the task. Task types are one of the following: Update
(New); Update (Change); Deletion. Refer to Screen 8-2 for some Activity Log
entry examples.
8-4
StarKeeper II NMS Graphics System Guide, R10.0, Issue 1
Using Network Builder to Configure Your Network
From the Configuration Activity Log, you can load a network element record into a
configuration form by moving the scrollbar to locate the desired item, choosing the
desired item and then choosing Configure at the base of the window. Refer to
Operator Tips further on in this chapter for more information.
Proposed tasks for network elements on unconfigured nodes cannot be loaded
from a configuration form. You must load these tasks from the Activity Log.
The Configuration Form Base Window
Configuration activities are accessed from a configuration form base window. To
invoke the configuration form base window for the network element you wish to
configure, choose Configure. A menu is displayed (see the following screen).
Choose the desired network element.
Screen 8-3.
Configure Menu
StarKeeper II NMS Graphics System Guide, R10.0, Issue 1
8-5
Using Network Builder to Configure Your Network
The desired configuration form base window appears. The Group Configuration
Base Window is displayed in the following screen. Each network element has its
own Configuration Form Base Window.
Screen 8-4.
The Group Configuration Base Window (Initial Appearance)
The Configuration Form Base Windows have three standard menus:
■
File displays a menu of operations to perform.
■
View displays a menu for viewing the Task Log and other reports.
■
Help displays help system options.
Control Area Menus and Buttons
Clicking on a menu title in the control area of a Configuration Form Base Window
displays the menu.
As an example, the following screen illustrates the menu invoked by clicking on
File.
8-6
StarKeeper II NMS Graphics System Guide, R10.0, Issue 1
Using Network Builder to Configure Your Network
Screen 8-5.
The File Menu
The File Menu
0
The File menu contains choices for accessing data records and updating or
deleting them, submitting and canceling tasks, and manipulating the forms.
Most of the commands on this menu invoke command windows. These windows
request information needed before the command can proceed. The command
does not execute until you click on the appropriate command button on the
command window.
To get to this point, you made a choice of a particular network element type from
the Configure menu. The File button now lets you choose the specific operation
you want to do on that network element, as shown below:
Load
displays an existing or pending element record on a form for viewing or
changing the data
New
provides a form for entry of data for the creation of a new element record
Delete
removes an element record from the databases
Submit
Update
submits the current form (whether created using New or an update of an
existing element using Load)
StarKeeper II NMS Graphics System Guide, R10.0, Issue 1
8-7
Using Network Builder to Configure Your Network
Other supporting operations are to:
■
reset the form
■
cancel the update or delete request
■
exit the form
Refer to the following table for a discussion of the operations you select from the
File menu. All commands are available to users having configure permission.
Users with read-only permission may only execute Load, Reset and Exit. See
Chapter 2 for more information.
Table 8-1.
Choice
Load...
The File Menu, Operations
Description
Displays a Load pop-up command window to specify the key identifying data of a
network element. When the data is entered, and the OK button is chosen, the
form for the specified element is made available. Load retrieves the record of a
specific network element for display on a form. Use this choice to verify or change
an existing database record.
Two types of records may be retrieved:
1. Current StarKeeper II NMS database contents.
These records are for existing network elements that do not have an outstanding
task associated with them.
2. Previously submitted task specifications.
These records are for network elements having an associated task either pending,
proposed, or stopped. In this case the record retrieved represents that task, and not
what is currently in the database. To bypass the data reflected in the active task, so
that the data that is stored in the StarKeeper II NMS Core System database is
retrieved, the active task must first be canceled.
New...
Displays a New pop-up command window to specify the key identifying data for the
to-be-created network element. Use this choice to add a new record to the
databases. Options are provided in the window to show whether standard defaults
or the currently present form data (if any) should be used to initialize the new form.
Choose OK to display a form for the creation of a new database record of the
requested network element type. This command is available only to users with
configure permissions.
Delete...
Displays a Delete pop-up command window to specify the network element record
to be deleted. When you choose OK , a confirmation notice window is displayed.
If you choose to proceed with the deletion (via an appropriate response to the
confirmation notice), the delete task is submitted for execution and the form is
loaded with the data record of the specified network element.
Note that deleting a database record may have an effect on other database
records. These instances will be discussed as they are encountered.
This command is available only for users with configure permission.
8-8
StarKeeper II NMS Graphics System Guide, R10.0, Issue 1
Using Network Builder to Configure Your Network
Table 8-1.
Choice
The File Menu, Operations—Continued
Description
Reset Form
Resets the data on a form to the state it was in following the last New, Load, Delete
or Submit. You are queried for confirmation of this request only if changes have
been made on the form since that time.
Submit
Update...
Submits a task. It calls a Submit command window to specify execution
parameters.
This command is active only after a new form is displayed, or a record is loaded for
an element without a pending task, and only for users with configure permission. If
a task is pending, you cannot resubmit it; you first have to cancel the pending task
and then you can resubmit it.
Cancel Update
or
Cancel Delete
Cancels a pending task (whose record is currently loaded). The command object
varies depending on the task submitted (Update or Delete); only the single
appropriate version will appear.
For certain tasks that haven't completed, a confirmation is required.
This command is available only for tasks that are pending and only for users with
configure permission.
The View Menu
0
This button provides access to the Task Log and other view options for some
forms. Choose Task Log from the View menu to display a Task Log for the current
task associated with the loaded form. Task Logs provide a history of the current
task associated with the loaded form. Task Log entries are preserved until
successful completion of the task. After a task successfully completes, the entries
remain until the Task Aging interval has elapsed or until a user views the task's
form, whichever comes first. See the section titled Network Builder Tuning in
Chapter 7. The default for Task Aging is 2 days.
The Task Log header will identify the network element being operated upon. Task
Log entries indicate success or failure of individual configuration steps. When
applicable, these entries are followed by text received from a StarKeeper II NMS
or a node.
StarKeeper II NMS Graphics System Guide, R10.0, Issue 1
8-9
Using Network Builder to Configure Your Network
An example of entries in a Task Log is shown in the following screen.
Screen 8-6.
Sample Task Log
At the base of this window there are controls for saving and printing a task log, as
well as for searching for specific items in the log.
NOTE:
Some Configuration Reports accessed via the View Menu are updated
dynamically, in response to changes made on the associated configuration
form. This process will not allow you to configure other elements while one
of these reports is displayed. You should dismiss any such reports before
attempting to load or create a new network element.
Configuration Forms
Each node has a database that contains information about itself and connected
resources. Duplicate copies of many of the records are kept in the database of
StarKeeper II NMS Core Systems. This data is segregated by Network Builder
into sections called configuration records. There is a configuration record for the
node, and a configuration record for each trunk connected to the node, and a
separate configuration record for each network element that the node must “know”
about. It is those records that Network Builder retrieves, and displays the data on
8-10
StarKeeper II NMS Graphics System Guide, R10.0, Issue 1
Using Network Builder to Configure Your Network
the Graphics System screen in a configuration form. You can either view the data
in the records, or make changes to the data, or delete the entire record. Network
Builder also displays forms that you populate and then submit as new additions to
the databases of StarKeeper II NMS Core Systems and nodes.
The configuration forms are Motif GUI windows that use standard Motif GUI
features to display and update data residing in StarKeeper II NMS Core System
and node databases. Some of the Network Builder features used in configuration
tasks are described in the following subsections; they are
■
key and data panes
■
message area
■
notices
Key and Data Panes
Each configuration form window contains one key pane and one or more data
panes. Briefly, the key pane identifies the network element to be configured and
the data panes provide detailed parameters for the network element.
For the more complex forms, a Show Data setting for displaying desired panes is
located just below the key pane. Some configuration form windows have more
panes than can fit onto the visible screen. When the window is first invoked, it
displays a default pane. The Show Data setting controls which pane will be
displayed. Displaying and dismissing panes does not affect the data on the form
or the database element record.
StarKeeper II NMS Graphics System Guide, R10.0, Issue 1
8-11
Using Network Builder to Configure Your Network
The panes contain the controls used to specify parameter values for a network
element. Details of the key and panes are presented during the configuration
discussion for each network element, later in this chapter.
Screen 8-7.
Key and Data Panes
Message Area
At the bottom of each base window is a message area. The messages show:
■
errors that occur during form generation; for example, validation errors
■
messages received from nodes and StarKeeper II NMS Core System
machines
■
status information from the current task
Messages are cleared when they no longer apply.
Error Messages
These messages are used for all immediate errors encountered while validating
fields, for all other form validation, and for displaying messages from nodes and
Core Systems.
8-12
StarKeeper II NMS Graphics System Guide, R10.0, Issue 1
Using Network Builder to Configure Your Network
Only one message at a time is displayed. If a message is generated after task
submission that represents a serious condition, the task submission is stopped.
Shown below are a few, example error messages.
■
Group Name 1 contains invalid characters.
■
Cannot open file for pending task.
■
Cannot submit group task due to a resource problem.
■
Node Name does not exist.
Status Messages
0
These messages are used for showing the mode of operation in effect for a given
task, or for the status of the task. Shown below are a few, example status
messages:
■
New trunk configuration form
■
Node configuration form loaded
■
Update - changed record: Held
The last example shows the status of the task as "Held." There are eight possible
states for a task submittal; they are
■
Waiting - The task was submitted for "Immediate" execution and is waiting
to run for the first time.
■
Held - The task has been identified as "Held" during form submission.
■
Proposed - The task has been identified as "Proposed" during form
submission.
■
In Progress - The task is in the process of being executed.
■
Completed Successfully - The task was executed and completed errorfree.
■
Canceled - A previously submitted task has been canceled.
■
Trouble - Awaiting Retry - The submitted task has encountered a
temporary problem and is waiting to execute again. These are usually
communication errors between the Graphics System and NMS/node
databases.
■
Failed - Task Stopped - The submitted task has encountered a serious
problem.
■
Warning - If warnings are received from the node (Warning) is appended
to the state, and the warning messages are displayed in the Task Log.
StarKeeper II NMS Graphics System Guide, R10.0, Issue 1
8-13
Using Network Builder to Configure Your Network
Notices
Certain command requests require confirmation before proceeding. This
confirmation is solicited via notices. A confirmation notice includes a statement
asking to confirm a Delete request, Reset Form request, or canceling a task that
is in progress or awaiting retry. Also, confirmation is required if changes are made
to a configuration form but a Submit Update command was not issued. The notice
includes two (or three) command buttons: one to continue the operation, one to
cancel the operation, and, sometimes, one to initiate a missing command (Submit
Update in this case). Press the appropriate command button. The following
screen, presents a sample confirmation notice.
Screen 8-8.
Sample Confirmation Notice (for an unsubmitted update)
Each notice will appear once and only once per command request, at the time the
command execution button on the command window is selected.
Configuration Work Flow
From a Network Builder point of view, there are three operations to support
configuration of network elements. You can add new configuration records to
support new network elements, you can load data from the StarKeeper II NMS
Core System database (and then simply view the data or change it) and you can
delete entire database records from NMS/node databases. These three
operations are supported by the following operation commands. Choosing one of
these operations starts a task.
8-14
New
Used to add network elements to the configuration databases.
Load
Used to retrieve configuration databases of existing network elements for
verifying, or verifying and changing. You can also choose to delete a record
after verifying it.
Delete
Used to delete configuration database records for deletion.
StarKeeper II NMS Graphics System Guide, R10.0, Issue 1
Using Network Builder to Configure Your Network
NOTE:
The Load operation can also be used to retrieve the record for an
outstanding task. This allows you to continue with the task after either
quitting the task base window or starting a different operation.
An outstanding task can also be loaded by using the Configuration Activity
Log (the View button on the Network Builder Control Window). For more
information, refer to the section titled Configuration Activity Log earlier in
this chapter.
The New Operation, to Add a Network Element
The New operation displays a blank configuration form, for the type of network
element specified, and provides the mechanism to populate the form and submit it
to be added to the databases.
A general outline to add a configuration record to the databases is listed below;
refer to the paragraphs that follow for more information. The description here is
general, some "Add" procedures are a bit more involved. This additional
complexity is fully explained in the applicable sections.
■
Accessing the Configuration Form
— identify the type of configuration record to be added
— call the New command window
— identify the specific configuration record to be created
— specify how the initial form is to be populated (Standard or Current
Data)
— initiate the New operation
■
Populating the Configuration Form
— populate the data panes
■
Submitting the Update
— call the Submit command window
— specify the execution type
— submit the task
— track the progress (status) of the task
When adding network elements, certain interrelationships must be taken into
account. Where applicable, they are pointed out in the individual discussions for
each network element.
StarKeeper II NMS Graphics System Guide, R10.0, Issue 1
8-15
Using Network Builder to Configure Your Network
0
Accessing the Configuration Form
Choose the network element for which you want to add a new configuration
record, from the Network Builder Configure menu. This calls the applicable
network element base window to the screen. Then choose New from the File
menu. A New command window is called to the screen. See the following screen
for a sample New command window.
Screen 8-9.
New Command Window
The New command window has three major items:
1.
a means to identify the network element configuration record that you want
to add to the databases
2.
a Defaults control (to specify Standard or Current Data)
3.
a set of command buttons:
OK
,
Cancel
and
Help
Text entry data fields provide the means to identify the configuration record that
you want to add to the databases. The number of fields there are depends on the
network element.
The Defaults control is an exclusive setting to choose Standard or Current Data.
"Current Data" is available only when there is data displayed on the form (from a
prior New, Load or Delete operation). Choosing Standard will provide a
8-16
StarKeeper II NMS Graphics System Guide, R10.0, Issue 1
Using Network Builder to Configure Your Network
configuration form filled out with "Standard" defaults, where applicable. The closer
your network element is to this "standard" configuration, the less work you have to
do. Just change the data fields that are different from the standard values. If there
is data on the form, you can choose Current Data, which leaves the configuration
form filled out with the same data. This is especially helpful when adding multiple
records for similar network elements or adding an element similar to a loaded
record.
Once the configuration record is identified, and the Defaults control is set, choose
OK to bring the configuration form to the screen.
Populating the Form
0
The form you specified is called to the screen. It has a key pane and one or more
data panes. If there are more data panes than can be seen on a screen there is a
Show Data control to govern which pane will be displayed. Enter or modify field
entries as desired.
Initially, the form is partially populated with defaults. Some fields will not be
populated and you'll have to supply data in these fields; also, the default data for
some fields may not be correct for this entry—change those fields.
Submitting the Update
0
When you are finished with data entries for the configuration form, choose Submit
Update from the File menu. A Submit command window is called to the screen.
See the following screen for a sample Submit command window.
StarKeeper II NMS Graphics System Guide, R10.0, Issue 1
8-17
Using Network Builder to Configure Your Network
Screen 8-10.
Submit Command Window
The Submit command window has an Execution control to specify if you want the
changed configuration record submitted to the databases immediately, or retained
as held or proposed changes. The default will be "Immediate" or the value from a
previous submission in the current session, if any.
■
Choose Immediate to submit the task for immediate execution. Validation
of the data on this form is done against previously committed data.
■
Choose Held to save the data for submission at a later time and for use in
other Network Builder tasks. This data is validated against committed and
other held data. It is available for use in Network Builder Node Reroute
Table Configuration and Session Maintenance Simulation.
■
Choose Proposed to save the data for future network use. This data is not
used in any validations and is not available for use in any other Network
Builder tasks.
Choose
OK
to execute the submittal.
Messages in the base window footer will keep you informed of the progress of the
task. You can also track task status by viewing the Configuration Activity Log.
Messages are also stored in the Task Log to provide a history. To access the Task
Log, choose View from the control area of the configuration form. If messages
state the command has failed, identify the cause of the failure (if the Task log
doesn't provide enough detail, check the EVENTLOG for possible additional
information). To resubmit the task, choose Cancel Update from the File menu,
change the data (see the Load operation, next), and resubmit the record. Forms
8-18
StarKeeper II NMS Graphics System Guide, R10.0, Issue 1
Using Network Builder to Configure Your Network
for pending tasks (including those that failed) will be protected; changes will not be
permitted until the task is canceled. When a task is pending, controls on the
associated form will be inactive.
The Load Operation, to View or Modify an
Existing Database Record
The Load operation retrieves the configuration form for the network element
specified, and provides the mechanism just to view the form or view it and do one
of the following:
■
make changes and return the changed data to the databases
■
delete the entire database record
A general outline to change a database configuration record is listed below; refer
to the paragraphs that follow for more information. The description here is general;
some "Change" procedures are a bit more involved. This additional complexity is
explained fully in the applicable section.
StarKeeper II NMS Graphics System Guide, R10.0, Issue 1
8-19
Using Network Builder to Configure Your Network
■
Accessing the Configuration Form
— identify the type of configuration record to be changed
— call the Load command window
— identify the specific configuration record to be verified or changed
— initiate the Load operation
■
Verifying and Changing Data in the Configuration Form
— quit the window (if you are just verifying data)
— modify the data panes
■
Submitting the Update
— call the Submit command window
— specify execution type of update
— submit the task
— track the progress (status) of the task
When changing network elements, certain interrelationships must be taken into
account. Where applicable, they are pointed out in the individual discussions for
each network element.
Accessing the Configuration Form
0
Choose the network element for which you want to verify or change an existing
configuration record, from the Network Builder Configure menu. This calls the
applicable network element base window to the screen. Then choose Load from
the File menu. A Load command window is called to the screen. See the following
screen for a sample Load command window.
8-20
StarKeeper II NMS Graphics System Guide, R10.0, Issue 1
Using Network Builder to Configure Your Network
Screen 8-11.
Load Command Window
The Load command window has two major items:
1.
a means to identify the network element configuration record that you want
to verify or change
2.
a set of command buttons:
OK
,
Cancel
, and
Once the configuration record is identified, choose
configuration form to the screen.
Verifying and Changing Data in the Form
OK
Help
to bring the specified
0
The form you specified is called to the screen. It has a key pane and one or more
data panes. If there are more data panes than can be seen on a screen, there is a
Show Data control to govern which pane will be displayed. Enter data in the fields
that you want to change.
Ensure that you have the network element configuration form you want. If you are
only verifying data and not making any changes, you can quit the window or begin
another operation. If you want to change data, continue with the procedure.
StarKeeper II NMS Graphics System Guide, R10.0, Issue 1
8-21
Using Network Builder to Configure Your Network
0
Submitting the Update
When you are finished with data entries for the configuration form, choose Submit
Update from the File menu. A Submit command window is called to the screen.
See Screen 8-10 for a sample Submit command window.
The command window has an exclusive control to specify if you want the changed
configuration record submitted to the databases immediately, or retained as held
or proposed changes. The default will be Immediate or the value from a previous
submission in the current session, if any. Choose OK to execute the submittal.
Messages in the base window footer will keep you informed of the progress of the
task. Messages are also stored in the Task Log to provide a history. To access the
Task Log, choose View from the control area of the configuration form. If
messages state the command has failed, choose Cancel Update from the File
menu, change the data, and resubmit the record or check the EVENTLOG for
possible additional information about the failure.
The Delete Operation
The Delete operation removes an entire configuration record from the databases.
The node is not deleted from the node database.
A general outline to delete a configuration record is listed below; refer to the
paragraphs that follow for more information.
■
Choosing the Delete Operation
— identify the type of configuration record to be deleted
— call the Delete command window
— identify the specific configuration record to be deleted
■
Executing the Delete Operation
— specify the execution type
— initiate the Delete operation
— track the progress (status) of the task
Choosing the Delete Operation
0
Choose the network element, for the configuration record that you want to delete,
from the Network Builder Configure menu. This calls the applicable network
element base window to the screen. Then choose Delete from the File menu.
8-22
StarKeeper II NMS Graphics System Guide, R10.0, Issue 1
Using Network Builder to Configure Your Network
A Delete command window is called to the screen. See the following screen for a
sample Delete command window.
Screen 8-12.
Delete Command Window
The Delete command window has three major items:
1.
a means to identify the configuration record to be deleted
2.
an Execution control
3.
a set of command buttons:
OK
,
Cancel
, and
Once the configuration record is identified, choose
configuration form to the screen.
Executing the Delete Operation
OK
Help
to bring the specified
0
The Execution control is an exclusive setting to choose Immediate, Held, or
Proposed execution. The meaning of the labels on the settings was described
previously in the sub-section titled Submitting the Update.
StarKeeper II NMS Graphics System Guide, R10.0, Issue 1
8-23
Using Network Builder to Configure Your Network
Once the configuration record is identified, and the Execution control is set,
choose OK . Choosing OK dismisses the Delete command window and the
configuration form is brought to the screen.
Messages in the base window footer will keep you informed of the progress of the
task. Messages are also stored in the Task Log to provide a history. To access the
Task Log, choose View from the control area of the configuration form. If
messages state the command has failed, choose Cancel Update from the File
menu, correct the problem and restart the deletion task. Check the EVENTLOG
for possible additional information about the failure.
Canceling a Task
Any task can be canceled before it completes. To cancel a task that is held,
proposed, awaiting retry, etc., choose Cancel Update or Cancel Delete (as
applicable) from the File menu. The Cancel operation is also used to prepare a
failed, held, or proposed task for re-submission or to remove it from the system.
! CAUTION:
Canceling a Waiting, In Progress, or Awaiting Retry task may result in a
partially applied update.
Operator Tips
Network Builder is designed to make configuration tasks easier for network
administrators. To highlight some of the ways Network Builder can be used to
simplify operations, the following subsections present a collection of "operator
tips."
Verifying Data before Deleting
The Delete operation, as specified by choosing Delete from the File menu,
assumes you are sure of the record you want to delete. Therefore, the deletion is
specified and acted on before displaying a copy of the record.
If you want to see a copy of the record before deleting it, just to make sure you
have the right one, choose the Load operation from the File menu to retrieve and
verify a configuration record.
Once you are sure you have the record to be deleted, choose Delete from the File
menu. This action invokes the Delete command window, with the current keys,
where you choose OK . Network Builder then deletes the verified configuration
record from the databases.
8-24
StarKeeper II NMS Graphics System Guide, R10.0, Issue 1
Using Network Builder to Configure Your Network
Using Current Data (the Defaults Control)
When you choose New from the File menu to add configuration records to the
databases, you access the New command window, which has a Defaults control
to choose between Standard and Current Data. (See Screen 8-9). If New is the
first operation you wish to do on a Network Builder Configuration Base Window,
there is no current data, so the only choice is Standard data. Choosing Standard
will populate the chosen type of configuration form with a specific set of
predefined data (considered to be an appropriate set of the particular task). These
defaults may or may not approximate your requirements. However, if the new
operation follows another operation in the same base window, the current data is
available for population of the form. This is particularly helpful when populating
forms for similar elements, which is usually the case. For example, when
configuring a new network built on similar nodes, you can complete the detailed
data for the first New operation and then choose Current Data from the Defaults
control for each node thereafter, and only have to change the data in the fields
that are different from the most recent New operation.
The current data feature is also helpful if you want to change Direction on a local
group. The node does not permit you to change Direction; however, you can
Delete the group (but the data remains on the form) and then choose the New
operation and choose Current Data from the Defaults control. The final step
would be to change the Direction field and submit the configuration form as a
"New" configuration record.
The Copy Feature
Network Builder does not have an explicit copy feature; however, copying is easily
done by following the steps below.
1.
Load the record of the network element that you want to copy.
2.
Choose New from the File menu and identify the target of the copy
operation by entering its key data in the fields of the New command
window.
3.
Choose Current Data on the Defaults control, and choose OK at the
base of the command window to get a form to create the new entry, using
the data from the loaded source record.
4.
Make any desired changes and submit the form.
The Move (Trunk) Feature
Network Builder does not have an explicit move feature; however, moving trunk
data is easily done by following the steps below.
StarKeeper II NMS Graphics System Guide, R10.0, Issue 1
8-25
Using Network Builder to Configure Your Network
1.
Load the desired trunk record.
2.
Change the module address field at either (or both) end node. (This can be
done along with any other trunk changes you desire.)
3.
Make other changes (if desired) and submit the form.
Using this procedure, Network Builder treats the "move" as just another trunk
parameter change.
Using the Configuration Activity Log to Access
Forms
Network Builder lets you access forms from the Configuration Activity Log. To
access a form from the Configuration Log, follow the steps below:
1.
choose a log entry in the Configuration Activity Log
2.
choose Configure at the base of the window.
This simple two-step approach will invoke a configuration base window for the
appropriate element type, and loads the data for the specific element chosen from
the log.
It is a shortcut way of loading a record and eliminates the need to specify any key
data to accomplish the load. It is particularly useful when trying to determine why
a particular task failed or is having trouble.
Loading a failed or troubled task's record then gives you access to that element's
task log, thus providing more detailed information regarding the task. From this
point you can also cancel the task and update and resubmit the form, if desired.
Resubmitting Failed Tasks
When a task fails, you want to accomplish the following:
■
find out why it failed
■
remedy the problem
■
resubmit the task
If a task fails, there are three ways of being informed of the failure.
8-26
1.
watching the status messages appearing in the footer of the configuration
form
2.
viewing the Task Log
3.
viewing the Configuration Activity Log
StarKeeper II NMS Graphics System Guide, R10.0, Issue 1
Using Network Builder to Configure Your Network
In either case, you need to access a configuration form with the loaded record for
the failed task. In the first case (above) you are at the configuration form; in the
second case you can access the form using any method Network Builder
supports, but using the Configuration Activity Log access method (see previous
subsection) is the easiest way.
Once you learn of a task failure and have accessed the configuration form, cancel
the current task (choose Cancel Update from the File menu). You can then make
any changes on the form, if needed, and resubmit (choose Submit Update from
the File menu). Note that canceling without resubmitting will remove all
information regarding this task from both logs; so, cancel only when you are ready
to resolve the problem. For deletions, you restart the deletion after canceling.
The point to remember is that the data that was submitted, but failed, is never lost
until the task is cancelled. It is made available to you so that you can examine the
data entered, and resubmit the corrected data.
Sometimes a re-submittal does not work. This usually happens if a New record
must be added to several databases and the first add has succeeded, but the
others failed. In this case, run cfg_sync. To ensure all databases are updated
properly, start the task again by using the Load operation for the record.
Choose Command Windows
Network Builder introduces a special type of command pop-up window called a
Choose command window. The Choose command window is used in certain data
fields to provide a list of items from which to choose, to complete the entry for the
field. This is a very helpful feature when you are not sure of the exact entry to
make. You know a Choose command window is available when the field label is
followed by an ellipsis (...) and is itself a button. For example, on the SNI form the
Pre-selected Carrier field has a choose list associated with it. Press the label to
obtain the associated Choose window.
Screen 8-13.
Accessing a Choose Command Window
StarKeeper II NMS Graphics System Guide, R10.0, Issue 1
8-27
Using Network Builder to Configure Your Network
This action calls the Choose command window, which provides a scrolling list of
all the available carriers. (See the following screen.) You can use the scrollbar to
bring items into view and then click on the item you want, or you can use the
Match field to limit the number of displayed items on the list. To use the Match
field, activate the caret and enter a pattern, using wild card techniques; then press
the Enter key. All items not matching the pattern are removed from the list. For
example, if you enter n* on the match line, only items beginning with "n" appear on
the list. Wild cards ? and * are supported; and so are brackets "[ ]." Enter * on the
match line to re-display the entire list.
When you can see the item you want on the scrolling list, select the item. Then
press OK . Pressing this button dismisses the window and enters the current item
into the appropriate text field.
Screen 8-14.
Choose Command Window
NOTE:
If error messages state the list is truncated (because there are more items
than can fit on the list), use the pattern match feature to limit the size of the
list.
A Choose command window, when applicable, can also provide direct access to a
different, but required, configuration task. You can consider this as a back door to
Configure
a configuration task. If you press
the system will respond as though
you chose an item from the Configure menu at the Network Builder Control
Window. For example, on a Trunk configuration, you can call the Choose
8-28
StarKeeper II NMS Graphics System Guide, R10.0, Issue 1
Using Network Builder to Configure Your Network
Configure
command window for the Group Name field, and then choose
to
call up a Group Configuration form. The node name and current group name (if
chosen) from the Choose command window will be passed to the group form.
Once you have configured a new group, and quit that Group Configuration Form
Base Window, the Choose command window is dismissed and the name of the
new group is entered in the Group Name field on the Trunk form.
Cut-Through
Any supported node command can be executed on the Core System using the
Cut-Through application. This is particularly helpful to do tasks that must be done
at the node. For example, two of the network elements (X.3 and CUG profile)
required for addresses must be entered into the node database at the node; you
cannot configure them from Network Builder. If you started configuring the service
address before entering these fields you can:
1.
use Cut-Through to access the applicable node
2.
use the node's enter profile command to populate the X.3 and CUG profile
3.
return to Network Builder, enter the new profile names, and continue
configuring the service address
Refer to Chapter 6 for complete coverage of the Cut-Through application.
NOTE:
Do not use Cut-Through to configure network elements supported by
Network Builder. Doing so will disrupt critical data relationships that
Network Builder maintains and can result in errors and inconsistencies.
List Editing Controls
The following table describes common controls that are used for editing lists.
Button
Description
Insert
is used to make an addition to a list. Choosing this button will
Insert
put the data in the Entry field into the list.
Delete
Delete
is used to delete the current item from a specific list. An item is
made current by clicking on the desired item in the list. Choosing
Delete
will then remove the item from the list.
Edit
Edit is used to modify a list item. Clicking on the list item will place it
into the Entry field where you can make changes. Choosing Edit will
replace that item with the modified entry.
Edit is also used to finalize modified associations between two lists
(example: SNI Group Addresses), or between a list item and other
settings.
StarKeeper II NMS Graphics System Guide, R10.0, Issue 1
8-29
Using Network Builder to Configure Your Network
8-30
StarKeeper II NMS Graphics System Guide, R10.0, Issue 1
Using Network Builder to Configure Your Network
Configuring StarKeeper II NMS
Connections
The procedures for configuring StarKeeper II NMS connections are shown first,
before node configuration, because StarKeeper II NMS first needs to know how to
connect to the network.
Prior to configuring StarKeeper II NMS connections, perform node administration
(at the node) as described in the Administration Procedures for Host
Connections section in Chapter 3 of the StarKeeper II NMS Core System Guide.
To keep your StarKeeper II NMS Core System informed of changes in your
network, various synchronization commands are available to update the
StarKeeper II NMS database with accurate network information. These
commands, skload, cfg_sync and conn_sync, are discussed in detail in Chapter
2 and Appendix F of the StarKeeper II NMS Core System Guide.
The NMS Connections configuration form contains several data panes (one for
each connection class). A Show Data setting chooses which data pane will be
displayed.
Background Information
Network Builder supports StarKeeper II NMS connections to supported nodes.
The available connection classes are listed in the following table. Each connection
class is configured using the methods described in this section.
Connections Classes for a StarKeeper II NMS
Core System
0
This section lists connection classes for a StarKeeper II NMS Core System.
Class
Description
Console
This connection class is used to collect alarms from nodes and provide
pass-through to the nodes. It can also be used with the StarKeeper II
NMS console command to provide Cut-Through to the node. To
collect alarms, the connection status must be set to active.
Billing
This connection class is used to collect call accounting data from
nodes. There is one connection to StarKeeper II NMS for each node
that reports billing data. This data is stored in the StarKeeper II NMS
Core System database and is used for the billing reports provided by
StarKeeper II NMS. The billing address must be entered as billing.m.
See the Billing Management section of the StarKeeper II NMS Core
System Guide for instructions on entering required billing parameters.
StarKeeper II NMS Graphics System Guide, R10.0, Issue 1
8-31
Using Network Builder to Configure Your Network
Class
Description
Performance
This connection class is used to collect performance measurement
data from nodes. The data is collected, stored, and summarized so
that tabular performance reports can be produced. See the
Performance Management section of the StarKeeper II NMS Core
System Guide for instructions on entering required data.
Administration
This connection class is used to transfer node configuration data from
nodes to the StarKeeper II NMS Core System database using the
skload, and cfg_sync commands. It supports the transfer of data from
Network Builder to nodes through StarKeeper II NMS. This connection
must be configured and activated by Network Builder configuration
tasks to be operational. It also accommodates the smverify and
smstat commands to support the node's Session Maintenance
feature. Each Administration connection must be configured to run
from the same StarKeeper II NMS Core System having the Console
connection set up to that node.
Dial Backup
Supports node connections with modems—as a backup to the
standard Console connection. Each database connection must be
configured to run on the StarKeeper II NMS Core system that has the
Console connection set up to the node. Do not run database load and
synchronization commands over this connection.
MRCM Maint
Connects to the M port, and to the B port (via the M port), of the MRCM
module for use as a backup for the Console connection; it is used for
problem situations. Both the Console and MRCM Maint connections
cannot both be active at the same time since they both cannot be used
to access the same B port. Refer to the section titled MRCM
Connections in the StarKeeper II NMS Core System Guide.
The table above briefly describes the connection classes that are available with
your StarKeeper II NMS. Use the descriptions in this table and in the following
sections to help you determine which connections you need to configure to
manage your network.
8-32
StarKeeper II NMS Graphics System Guide, R10.0, Issue 1
Using Network Builder to Configure Your Network
Connection Classes for Graphics System
Applications
0
Network Builder configuration requires the Administration connection to be active
so that data that you wish to be sent to the node can reach the node and take
effect. The Administration connection is also required to keep the StarKeeper II
NMS Core System and node databases in synchronization, using the StarKeeper
II NMS commands skload or cfg_sync. The Console connection should also be
active to provide pass-through to the node.
In addition to the need for active Administration and Console connections to
support Network Builder, the Performance Reporter application requires the
Performance connection to be active. Thus, if you use the Performance Reporter
application, you will have to configure and activate the Performance connection
from the StarKeeper II NMS Core System to the node from which you want to
extract performance measurement data. The Performance Reporter application
uses the data that is stored in the StarKeeper II NMS Core System database to
generate its tabular reports and graphs.
The Network Monitor application requires the Console connection to be active to
collect alarms from nodes and other element management systems.
Task Notes
■
If you change or add a connection to a node, you must run the StarKeeper
II NMS conn_sync command to synchronize the local connection data
with the StarKeeper II NMS Core System configuration databases. The
conn_sync command must be run on the StarKeeper II NMS Core System
and on the Graphics System.
■
When a new node is added to the network via Network Builder, you must
add the node in concert with adding the NMS connections. Use the outline
below when adding a new node and the appropriate NMS connections.
1.
If not already done, some basic administration must be performed at
the node console before proceeding with the following steps. This
includes: Entering a name and addressing information for the node;
configuring service addresses for internal endpoints; and, possibly,
configuring a trunk for StarKeeper II NMS connectivity.
2.
Configure new StarKeeper II NMS connections using the new node
name. Submit the task as immediate. Be sure that at least the
Console and the Administrative connection classes were defined as
active.
3.
Run the StarKeeper II NMS conn_sync command at the
StarKeeper II NMS Core System machine.
4.
Run skload to populate the configuration data for the node.
StarKeeper II NMS Graphics System Guide, R10.0, Issue 1
8-33
Using Network Builder to Configure Your Network
■
5.
Synchronize connection data by using the Workstation
Administration application (see Chapter 5 for details).
6.
If additional configuration changes are necessary use the Load
Node task.
Connections are configured on a StarKeeper II NMS-to-node pair basis;
one record for each NMS/node pair. If you want to add a connection class
to an existing record, add the record and add the desired connection class.
NMS Connection Parameters
Screen 8-15.
8-34
NMS Connections Configuration Form
StarKeeper II NMS Graphics System Guide, R10.0, Issue 1
Using Network Builder to Configure Your Network
Parameter
Description
Connection Classes
This setting identifies the connection classes to be configured.
Choose all the classes that you want to configure for this NMS/
node pair. The appearance of the Show Data control is affected
by this setting.
Connection Owner
This is the name of the StarKeeper II NMS Core System machine
owning the connection.
Console Password
This is the console security password as assigned in the node's
database for Port B. When you navigate out of this field, the entry
is cleared and the field is filled with a string of asterisks.
Network Access
Password
This is the network access password. When you navigate out of
this field, the entry is cleared and the field is filled with a string of
asterisks.
Network Phone
Number
This is the telephone number for modem access of the network.
Status
Only one of the following three connection classes can have its
status set to Active at any given time: Console, MRCM, and Dial
Backup.
Special Considerations
Adding Connection Classes
0
Adding connection classes establishes the node configuration record. To
complete the node configuration record, refer to the Configuring Nodes section
later in this chapter.
Deleting a Connection
0
You cannot delete a single NMS connection. When you delete a node, all
connections to that node are also deleted. However, you can change a connection
status to "inactive."
StarKeeper II NMS Graphics System Guide, R10.0, Issue 1
8-35
Using Network Builder to Configure Your Network
8-36
StarKeeper II NMS Graphics System Guide, R10.0, Issue 1
Using Network Builder to Configure Your Network
Configuring Nodes
Use Network Builder to configure node records in the node database and in the
StarKeeper II NMS database.
Adding your first node to the network is the most difficult entry—there is much
data to enter. The remaining nodes are easier to enter because of a Defaults
control that allows you to choose between Standard data and Current Data. For
later new node additions, you can choose Current Data to populate the form with
the same data that exists from the last node entry; then you just change the fields
that are different.
The Node configuration form is partitioned into a key pane and seven data panes:
Node Info, Addressing, SMDS, Hardware, Port, Feature, and Sess Maint. A Show
Data setting chooses which data pane will be displayed.
Background Information
The node is the backbone of the network and the center for call processing. It is
the connecting device for all concentrators, interface modules, and peripherals
that provide network service.
Entering data on the Node form allows you to specify the characteristics of the
node. You can:
■
name the node so it can be readily identified on administrative output
(reports, alarms, system responses, date stamp). Note that the node name
as used by StarKeeper II NMS can be different from the name used at the
node.
■
set up the node address so calls can be routed and directory entries can
be made for terminal users.
■
specify valid SMDS address ranges for the node, set SMDS billing to
enabled or disabled, set the network type, and identify the LATA ID for ICI
networks.
■
indicate the hardware currently in use: the number of Control Computers
and disk drives, and whether a Maintenance and Redundancy Control
Module (MRCM) is installed.
■
specify functions, such as an automatic disk backup and the removal of
babbling ports and/or trunks with errors, that can ease utility operations.
■
establish broadcast messages for terminal users.
■
enable console security by assigning passwords to ports A and/or B to
restrict access to the console and/or printer ports.
■
tune Session Maintenance node parameters.
StarKeeper II NMS Graphics System Guide, R10.0, Issue 1
8-37
Using Network Builder to Configure Your Network
Network Builder: Configure Node
Help
File View
Node Name: clab/node42/malik
New Node Name:
Show Data:
Node Type:
clab/node42/omega
Addressing SMDS
Hardware Port
Feature Sess Maint
Broadcast
Problems call 555-1212
Message:
BNS-2000 R4.0
Location: New Jersey
Time Zone: EST5EDT
Comment:
NM Server
clab/node42/nmsiep
Dial String:
Node configuration form loaded.
Screen 8-16.
Node Configuration Form, Node Info Pane
NOTE:
The Node Configuration form does not allow the user to change the node
type from BNS-2000 to DKII. (It does allow the user to change the type from
DKII to BNS-2000.) If the user has entered BNS-2000 by error for a DKII
node, they must delete and then re-enter the node using the Node
Configuration form
Task Notes
8-38
■
If you delete a node, you must run the StarKeeper II NMS conn_sync
command to synchronize the node connection data with the configuration
databases.
■
Some parameter specifications (such as the node name and port number
designations appearing on the date stamp) do not take effect until the next
node reboot.
StarKeeper II NMS Graphics System Guide, R10.0, Issue 1
Using Network Builder to Configure Your Network
■
Initial administration of console security using the Cut-Through facility can
be done only if the switch on the SCSI/DKI board is in the DIAG position.
The node must then be re-booted with the switch in the ENABLE position.
■
The New operation can only be submitted as a Held or Proposed task;
Immediate submittal does not apply. For a discussion of the relationship
between adding a new node and establishing the NMS connections to the
node, refer to the section titled Task Notes in the Configuring StarKeeper
II NMS Connections section.
■
If you change the password, you must also perform the following steps:
1.
Issue the init controller command at the node.
2.
Perform the Load NMS Connections task.
Be sure to inactivate the console connection to the node, change the
password, and reactivate the console connection.
■
If an ARU is configured on the node and you want to change or enter node
data using the Network Builder Node Form, then if the console connection
for that node is monitored on the Core System, it will disconnect and
reconnect after changing the data successfully.
StarKeeper II NMS Graphics System Guide, R10.0, Issue 1
8-39
Using Network Builder to Configure Your Network
Node Parameters
Node Info Pane
Parameter
8-40
0
Description
Broadcast
Message
This is an optional message to be broadcast to all users when they
connect to the node. Each broadcast message is treated separately
when entered, but they are treated as a single unit and displayed to
users when they connect to a node.
NM Server
Dial String
If the network contains FRM-M2 modules for which performance
measurements are to be collected, this dial string - used on the core
system to dial the node to download the FRM-M2 performance
measurements data - must be entered. It must match the address
administered at the node for the ?nmsiep group. In an ICI network, this is
the service address used by the ICI download toolkit on the Primary Core
to dial the node in order to upload and download the ICI configuration
files.
Time Zone
This is the time zone where the node is located. For example; EST5EDT
means the node is located in the Eastern Standard Time zone, which is 5
hours before Greenwich mean time, and Eastern Daylight Time (optional
entry) will be used when appropriate. Central Standard Time is 6 hours
before Greenwich mean time. This uses standard HP-UX time zone
conventions. Default is the HP-UX time zone of the Graphics System.
StarKeeper II NMS Graphics System Guide, R10.0, Issue 1
Using Network Builder to Configure Your Network
Addressing Pane
0
0
Parameter
Description
Area
This is the optional mnemonic for the local area address. Do not use
special characters, the word "all", the word "none", or a three-digit
number.
Exchange
This is the optional mnemonic for the local exchange address. Do
not use special characters, the word "all", the word "none", or a
three-digit number.
Local Node
This is the mnemonic for the local node name. Do not use special
characters or the word "all". Numbers are allowed.
Mnemonic and
X.121 Addresses
For a discussion of mnemonic and X.121 Addresses, refer to the
Background Information for Configuring Service Addresses.
Network
This is the optional mnemonic local network address. Do not use
special characters, the word "all", the word "none", or a four-digit
number.
0
StarKeeper II NMS Graphics System Guide, R10.0, Issue 1
8-41
Using Network Builder to Configure Your Network
0
SMDS Pane
This pane is only available for BNS-2000 nodes.
Network Builder: Configure Node
Help
File.....View
Node name: blab/node43/MR_BIG
New Node Name:
blab/node43/MR_BIG
Show Data: Node Info Addressing
SMDS SR:
SMDS Billing
Enabled
516
SMDS SAs:
Disabled
Network Type
Public Network
LATA ID:
SMDS Hardware Port
Private Network
2
700
701
702
703
704
Feature
Sess Maint
SMDS EPNs
0000–0999
5000–5999
1000–1999
6000–6999
2000–2999
7000–7999
3000–3999
8000–8999
4000–4999
9000–9999
Entry: 700
CLNS Hop Counting
Enabled
Disabled
Insert
Delete
Edit
3....27....51....75....99
99
CLNS Max. Hops
Node configuration form loaded.
Parameter
8-42
Description
CLNS Hop
Counting
This indicates whether CLNS hop counting is to be used. The CLNS
hop count is the number of trunks traversed by a PDU.
Network Type
Public Network or Private Network. Select Public Network if the node
is in an ICI network. For "Network Type" add information indicating
that the field is displayed only if the "Node Type" is BNS-2000 and an
"SMDS SR" and an "SMDS SA" have been entered.
LATA ID
This field is required for a node in an ICI network for a Local Exchange
Carrier. It is displayed only if the "Network Type" setting is "Public
Network."
StarKeeper II NMS Graphics System Guide, R10.0, Issue 1
Using Network Builder to Configure Your Network
0
Hardware Pane
The table below shows the CC0 Addresses available for various combinations of
Switch Types and availability of CC1.
Node Type
BNS-2000
VCS
Switch
Type
CC0 Addr
CC1 Addr
Standard
14
30
Standard
30
Absent
Enhanced
14, 30, 46, 62, 78, 94, 110
CC0 Addr + 16
(except 94)
BNS-2000
Enhanced
126
Absent
Enhanced
30, 46, 62, 78, 94, 110, 126
any Addr other
than Addr CC0
StarKeeper II NMS Graphics System Guide, R10.0, Issue 1
8-43
Using Network Builder to Configure Your Network
The following table shows the possible shelf addresses for the MRCM.
CC0 or CC1 Addr
MRCM Addr
30
1
46
2
62
3
78
4
94
5
110
6
126
7
With redundant controllers, the MRCM address may be either of those associated
with the CC addresses. The default MRCM address is the one associated with the
CC0 address.
8-44
StarKeeper II NMS Graphics System Guide, R10.0, Issue 1
Using Network Builder to Configure Your Network
0
Port Pane
Parameter
Description
Current
Password
Enter current password if you plan to supply a new password for
Port A/B. When you navigate out of this field, the entry is cleared
and the field is filled with a string of asterisks. This is to verify that
you are eligible to supply a new password.
Expiration
Interval
This is the number of days (1-365) the password is to remain before
expiring. Enter 0 if you do not want the password to expire.
New Password
Enter the password that will replace the current password.
StarKeeper II NMS Graphics System Guide, R10.0, Issue 1
8-45
Using Network Builder to Configure Your Network
0
Feature Pane
Parameter
8-46
Description
Babbling Signal
Alarms
This specifies if an alarm should be generated for each babbling
port. (A babbling port is when there are too many sequential
signals.)
Babbling Port
Removal
This specifies if babbling ports should automatically be put into the
out-of-service fault state.
Errored Trunk
Removal
This specifies if trunks that have generated errors exceeding the
errored packet threshold should automatically be put into the outof-service fault state.
Extended Routing
This specifies whether the crankback and route advance features
will be used.
NOTE: This is not related to the Session Maintenance feature.
Hop Counting
This specifies if the hop counting feature is to be used. The hop
count is the number of trunks that a call traverses.
Local Node Prefix
This is the number the X.25 interfaces use as a prefix to identify
that the subsequent X.121 address begins with a DNIC.
Window Size
Small = 64 envelopes and Large = 256 envelopes. Use Small for
nodes in which TY modules are to communicate with the AIMs.
However, using Small when not required will seriously degrade
node performance.
StarKeeper II NMS Graphics System Guide, R10.0, Issue 1
Using Network Builder to Configure Your Network
Node Reports
In addition to the standard "Task Log" available on all Network Builder
configuration forms, several other reports are provided that will assist you in
completing node configuration tasks. These reports provide global views of your
network's node data. The reports can be searched, printed or saved to a file.
The reports are listed and described below:
■
Configured SMDS Nodes Report
This report provides a listing of all SMDS nodes in your network. Data may
be displayed for all StarKeeper II NMSs in the network, or for owner
StarKeeper II NMSs only (a node's owner NMS is the one that monitors the
Admin and Console connections of the node). The report may be sorted by
SMDS SR/SA/EPN or by node name.
■
Audit Prefixes Report
This report displays the SMDS SR/SAs for which no corresponding
address prefix is configured for your company. This will occur if a LATA ID
has not been assigned to an SMDS node, or if the ICI Prefix form was used
to remove an address prefix assigned to an SMDS SR/SA. If the report is
empty (i.e. the view succeeded and zero SMDS SR/SAs are displayed),
then you can be confident that all of the SMDS SR/SAs assigned to your
company's nodes contain an address prefix configured for your company in
the node's LATA. Data may be displayed for all StarKeeper II NMSs in the
network, or for owner StarKeeper II NMSs only. The report may be sorted
by SMDS SR/SA or by node name. You must be a public network SMDS
provider able to access the ICI configuration database on the Primary Core
in order to run this report.
Following the title and time stamp heading of each report, entries appear
indicating which StarKeeper II NMSs were queried, and whether the data retrieval
succeeded. Entries will say "View Succeeded:" or "View Failed:", followed by the
StarKeeper II NMS name. If neither entry appears for an NMS that you know
should be connected to the Graphics System, you should check the connection.
These entries are followed by a display of the parameters you selected while
requesting the report. The body of the report, which appears next, uses some
special symbols when presenting the data:
■
An * in the first column of an entry indicates that the data on that line was
provided by the owner StarKeeper II NMS. Identical node data may appear
in multiple NMS databases if you have a hot spare configuration, or if data
has been copied from one NMS to another for any other reason.
■
A ? in the StarKeeper II NMS field means that the NMS name could not be
determined at the time of data retrieval. This may occur when connections
are being established or data is being synchronized. This is a transient
condition. Request the report again.
StarKeeper II NMS Graphics System Guide, R10.0, Issue 1
8-47
Using Network Builder to Configure Your Network
■
An NA in the LATA ID field means that the node data was retrieved from a
pre-R6.0 version of StarKeeper II NMS, that is, a version that does not
support a LATA ID.
If your company is operating a private network, only the Configured SMDS Node
Report is available to you, and the LATA ID field will always be blank in the report
if the node data was not retrieved from a pre-R6.0 version of StarKeeper II NMS.
Otherwise, your company is a public network SMDS provider. Both reports are
available to you, and the LATA ID should be displayed in each one. It should be "0"
if your company is an Interexchange Carrier, and non-zero if your company is a
Local Exchange Carrier.
Special Considerations
Changing Node Names
0
If you are going to change the name of a node, the node must be connected to a
StarKeeper II NMS Core System machine and you must make sure all alarms for
the existing node name have been cleared before making the change. Also, you
must run conn_sync at both the StarKeeper II NMS Core System and the
Graphics System after making the change. This will also affect Network Monitor
maps and Performance Reporter configuration data.
8-48
StarKeeper II NMS Graphics System Guide, R10.0, Issue 1
Using Network Builder to Configure Your Network
Delete Node Precautions
0
Note the following precautions when performing a delete node procedure:
■
When deleting a node, all data associated with the node is removed from
the Core System database, such as connection data and NRTs. However,
the configuration data is not removed from the node database.
■
Whenever a Node which has a Session Maintenance trunk is deleted, new
NRTs must be created and successfully submitted. Refer to the section
"Generating Node Reroute Tables" later in this chapter, for more
information on NRTs.
■
When deleting a node, the trunk information is deleted from the database.
If the trunk has two end nodes and one end node is deleted, the trunk
information for both nodes is deleted from StarKeeper II NMS databases.
However, the other end node is still connected to StarKeeper II NMS.
Whenever the node connections (console and administrative connections)
are moved from one StarKeeper II NMS system to another, concentrator
and trunk information must be saved first or it is deleted during the move
process.
StarKeeper II NMS Graphics System Guide, R10.0, Issue 1
8-49
Using Network Builder to Configure Your Network
8-50
StarKeeper II NMS Graphics System Guide, R10.0, Issue 1
Using Network Builder to Configure Your Network
Configuring Trunks
The trunk configuration form will handle all trunk-related data, including
StarKeeper II NMS trunk data and node trunk data for the nodes at both ends of a
trunk. Without Network Builder this would require several commands. All the
functionality present in the node's trunk configuration tasks, including the ability to
move and copy trunk modules, is supported (the copy function is done by Network
Builder at the form level and does not use the node's copy command; the move
function does use the node's move command and, as such, does not apply to
Session Maintenance trunks).
For a Session Maintenance trunk, the node on each end of the trunk must be one
which is monitored by a StarKeeper II NMS Core System to which this Graphics
System has access. If you are upgrading a network of nodes to include the
Session Maintenance (SM) feature, you may have to change many non-SM trunks
to SM trunks.
The trunk form is a window that is partitioned into a key pane and three data
panes: End Node Data, Trunk Data, and Session Maintenance Data.
Background Information
Network nodes support several trunk modules for use in wide area and local area
networks. These modules, which serve as connections for trunks ranging from
low-speed wire trunks to high-speed fiber optic trunks, can be used to support
connections between compatible nodes only. Network Builder facilitates the
configuration of trunks between supported nodes and for trunks having only one
end terminating on a supported node.
Incoming calls, entering these nodes through a trunk module, can be made
secure with trunk call screening—a set of security patterns used to check the
destination address of calls at strategic points in a network in order to permit,
deny, or limit access to a certain host, node, or set of nodes. These security
patterns are specified in a call screening profile ID with the node's profile
commands. Once a call screening profile ID is administered, the same profile ID
can be used for one or more trunk modules (the same security patterns will
apply).
Some nodes provide the ability to maintain established calls or sessions despite
failed trunk facilities through Session Maintenance. With Session Maintenance, all
calls on a failed facility are rerouted before the applications using the facility sense
the failed state and drop their calls. Refer to the node's Session Maintenance
Guide for more information.
StarKeeper II NMS Graphics System Guide, R10.0, Issue 1
8-51
Using Network Builder to Configure Your Network
You can use Network Builder Connectivity Analysis and Session Maintenance
simulation as tools to plan your trunk configuration and to evaluate changes to
network topology.
Task Notes
■
You should enter the monitored end nodes for a trunk before entering the
trunk, because Network Builder can then configure both ends of the trunk
and the StarKeeper II NMS Core System in one set of operations instead of
doing only half the job and returning to the trunk form to change it by
identifying the second node.
■
One of the implications of adding a trunk is that you may have to add Trunk
Groups too. To assist in configuring Groups for the added trunks, the
application uses a Choose command window to access the Group
configuration form.
■
If a trunk has been configured on the node and you have not done any
administration via StarKeeper II NMS, you can load the trunk information
via the Network Builder Configure/Trunk/Load/By Module Address
option. To do this, you will have to enter the module address of the trunk on
"End Node 1". Network Builder will bring up the trunk screen and you will
be required to enter the trunk name and information about the trunk on
"End Node 2". If the trunk on "End Node 2" is an administered node,
Network Builder expects that the trunk has also been previously configured
on the node. If not, an error message will be displayed.
You can also change the Trunk Name for an existing trunk that has been
configured on the node.
■
Whenever a Session Maintenance trunk is added, deleted, or if the node
name is changed, or if the Session Maintenance feature is removed from a
trunk, new Node Reroute Tables (NRTs) need to be created and be
successfully submitted. Refer to the section "Generating Node Reroute
Tables" later in this chapter, for information on NRTs.
■
The t3i trunk type is used to connect your BNS-2000 network to another
carrier's network for the purposes of providing inter-LATA SMDS in a public
network. As such, the t3i trunk provides the ICI interface between your
BNS-2000 network and another carrier's network. For the t3i trunk, you are
restricted to only a few node types at each end, as described below. Once
you have specified the correct nodes at each end of the trunk, the “t3i”
setting in the “Trunk 1 Type” field will become active, and you can select it
as the trunk type.
— For the “Node 1 Name” you must specify the name of a node that
you have already configured to support public network inter-LATA
SMDS. That is, you must specify the name of a node for which you
8-52
StarKeeper II NMS Graphics System Guide, R10.0, Issue 1
Using Network Builder to Configure Your Network
have used the Node Form to specify a “Network Type” of “Public
Network” as well as a LATA ID (which you should have set to “0” if
your company is an Interexchange Carrier).
— For the “Node 2 Name” you must specify a foreign node (that is, a
node not monitored by this StarKeeper II NMS network).
■
You should not change the configuration of a trunk that is currently in a
rerouted state. Such an action will result in a loss of the rerouted calls. You
may Cut-Through to the StarKeeper II NMS Core System that is monitoring
the node and execute the smstat command to find out the state of a
particular trunk.
■
Handling Conflicting Data
Trunks are stored as three database records in StarKeeper II NMS Core
Systems: one for each end and one for the trunk itself. When loading a
trunk form, certain error conditions will produce notices that require a
corrected entry; these conditions are: mismatched trunk data, and
mismatched trunk names. The errors, and the notices generated, are
described in the following paragraphs.
Prior to displaying the Trunk configuration form, Network Builder checks
that certain data in the database end records match. For example, if the
entry specifies a Line Speed of 56k and the entry at the other end does not
match, there will be an error notice. The error notice displays the
mismatched data at both of the end nodes, and provides an
End Node 1
End Node 2
and an
button to specify which end node
has the correct data to be used. A Cancel button allows you to cancel the
Load operation.
StarKeeper II NMS Graphics System Guide, R10.0, Issue 1
8-53
Using Network Builder to Configure Your Network
Trunk Parameters
End Node Pane
Network Builder: Configure Trunk
Help
File View
Trunk Type:T3A
Show Data:
Trunk Name: t3a41_42
Trunk
New Trunk Name: ....t3a41_42
Session Maintenance
Node 1 Name: blab/node41/brophy
Node 2 Name: clab/node42/malik
Node 1 Type: BNS-2000 R4.0
Node 2 Type: BNS-2000 R4.0
Module 2 Address: 10
Module 1 Address: 60
Group 1 Name … :
t3a42_60
Group 2 Name … :
t3a41_10
Trunk configuration form loaded
Screen 8-17.
Parameter
Group Name
Trunk Configuration Form, End Node Pane
Description
This is the name of the trunk group. The entry cannot exceed 8
characters, and cannot contain special characters. The field may be
left blank for an unadministered end node. Click on the field label to
access the choose window.
Configure
NOTE: The Choose pop-up window has a
button that
allows you to go directly to the Group configuration form.
Module Address
8-54
This is the node trunk module address at this end of the trunk. Only a
single address entry is allowed. If the trunk module type is dds, which
consists of two boards, its address is the slot occupied by the SCSI/
DKI interface board. When entering a dds, the next highest numbered
slot must be unconfigured to leave room for the second board.
Acceptable values are 1 through 127. If the trunk module type is t3i,
which consists of two boards, its address is the slot occupied by the
egress board. When entering a t3i, the next highest numbered slot
must be unconfigured to leave room for the second (ingress) board.
Also, a blank value is allowed if the Node Name entry for this end of
the trunk was not an "Administered" node.
StarKeeper II NMS Graphics System Guide, R10.0, Issue 1
Using Network Builder to Configure Your Network
0
Trunk Pane
Some of the following parameters only apply to certain trunk types.
Parameter
Description
Call Screening
Profile ID
This is the optional profile ID for screening incoming calls. The entry
cannot contain special characters. See Background Information
earlier in this section for more details.
C-Bit Mode
This specifies whether the c-bit parity code violation mode is to be
enabled or disabled for this trunk.
Destination
Enter the type of carrier specified in the Carrier control. When used in
an ICI Interchange Carrier network, the Interexchange Carrier option is
not valid.
Download
Server
Enter a valid service address or controller. Leaving this field blank will
revert to the default controller.
Egress
Download
Server
This is the source of the software to be downloaded to the t3i trunk
egress module. This control is only active for trunk type t3i when
Download Server is set to controller and Software Version is set to
special.
Egress
Software
Version
This is the version of the software to be downloaded to the t3i trunk
egress module. This control is only active for trunk type t3i when
Download Server is set to controller and Software Version is set to
special.
End Node 2
Carrier
This is the name of the Carrier at the far end of the trunk.
End 1 and 2
Transmit
Reference
Clock
This setting indicates whether the I/O board derives its transmit
clocking from the on-board oscillator clock (Local), the Facility, or the
Stratum Clock (Stratum).
StarKeeper II NMS Graphics System Guide, R10.0, Issue 1
8-55
Using Network Builder to Configure Your Network
Parameter
Description
Frame Term
Length
This is the maximum frame size combination for the high-priority
transmit queue (HPQ) and low-priority transmit queue (LPQ).
Group Name
This is the name of the trunk group. The entry cannot exceed 8
characters, and cannot contain special characters. The field may be
left blank for an unadministered end node. Click on the field label to
access the choose window.
NOTE: The Choose pop-up window has a Configure button that
allows you to go directly to the Group configuration form.
Header Error
Correction
This setting indicates whether the header error correction option is
enabled or disabled. When enabled, single-bit errors will be corrected,
multi-bit errors will be detected and discarded. When disabled, all
detected errors will be discarded.
Head Of Bus A
This indicates which end node is assigned to the head of the trunk's
Bus A. Whichever end node is not specified on this control, will be
assigned to Head of Bus B. This control will ensure that the two end
nodes are assigned to different Bus Heads, as required.
Ingress
Download
Server
This is the source of the software to be downloaded to the t3i trunk
ingress module. This control is only active for trunk type t3i when
Download Server is set to controller and Software Version is set to
special.
Ingress
Software
Version
This is the version of the software to be downloaded to the t3i trunk
ingress module. This control is only active for trunk type t3i when
Download Server is set to controller and Software Version is set to
special.
LATA ID
This is the LATA ID of the Local Exchange Carrier specified in the
Carrier control. This control is only active for trunk type t3i when used
in an ICI Interexchange Carrier network.
Max.
Aggregate CIR
This is the maximum amount of CIR bandwidth that will be accepted
through a pq trunk. This value may be entered as a percentage of the
line speed or in bits per second (bps). The bps values are recalculated
if there is a change in line speed. When a percentage is entered and
the units are switched to bps, the bps are automatically calculated and
displayed in the field.
Max. Aggregate This indicates the service quantum to be shared among all non-CIR
Non-CIR
calls. This value may be entered as a percentage of the line speed or
in bits per second (bps). The bps values are recalculated if there is a
change in line speed. When a percentage is entered and the units are
switched to bps, the bps are automatically calculated and displayed in
the field.
Max. Consec.
Test Failures
8-56
This the number of consecutive test failures before a module is
declared "dead."
MCDU
This is the maximum number of concurrent data units on trunk egress.
Network
Interface
This setting specifies the ATM interface type: user-network interface
(uni) or Network-node interface (nni). This option must be compatible
with that specified for the facility interface type on the ATM line card.
StarKeeper II NMS Graphics System Guide, R10.0, Issue 1
Using Network Builder to Configure Your Network
Parameter
Description
Node 1 and 2
Transmit Trail
Trace Address
This is an optional 15-digit local module address which will be sent to
the far-end equipment by the local module. The Node 1 Transmit Trail
Trace Address will be the same as the Node 2 Expected Trail Trace
Address, and vice versa.
Node 1 and 2
Expected Trail
Trace Address
This is an optional 15-digit far-end module address which is to be
received by the local module. The Node 1 Expected Trail Trace
Address will be the same as the Node 2 Transmit Trail Trace Address,
and vice versa.
Point of
Presence ID
This is the point of presence identifier (POP ID) of the Interexchange
Carrier specified in the Carrier control. This control is only active for
trunk type t3i when used in an ICI Local Exchange Carrier network.
Software
Version
Enter a valid software version. If Download Server is controller, the
default is Standard. Leaving this field blank will revert to the default
standard.
Threshold
Profile ID
This is an integer between 1 and 16 or the word "default".
Traffic Type
For t3s: In an ICI Local Exchange Carrier network, choose Official if
the trunk is to carry your company's official or private SMDS traffic.
Choose Public Network if the trunk is to carry your subscriber's SMDS
traffic.
For pq trunks: Traffic Type specifies the type of traffic (CIR, Non-CIR,
or Both) that is permitted on this trunk. CIR traffic consists of Frame
Relay connections for which a committed information rate has been
administered. Non-CIR traffic consists of connections from any other
type of module as well as Frame Relay connections for which
committed information rate has not been administered.
Trunk Active
Test Interval
This is the period between trunk active ("keep-alive") tests.
Upload Server
Enter the service address of the host that is to receive the module
memory dump prior to the Control Computer initiating a download or
after a fault. Leaving this field blank will revert to the default none.
Virtual Path ID
This is a number from 1 to 31 identifying the virtual path over which all
traffic between a pair of nodes is to be carried.
Trunk Reports
In addition to the standard "Task Log" available on all Network Builder
configuration forms, another report is provided that will assist you in completing
trunk configuration tasks. This report provides a global view of your network's
trunk data. The report can be searched, printed or saved to a file. It is described
below:
■
Carrier Report
This report provides a listing of your network's t3i trunks and their
destination carriers. Data may be displayed for all StarKeeper II NMSs in
StarKeeper II NMS Graphics System Guide, R10.0, Issue 1
8-57
Using Network Builder to Configure Your Network
the network, or for owner StarKeeper II NMSs only (a node's owner NMS is
the one that monitors the Admin and Console connections of the node).
The report may be sorted by carrier name or by trunk. You must be a public
network SMDS provider able to access the ICI configuration database on
the Primary Core in order to run this report.
Following the title and time stamp heading of the Carrier Report, entries appear
indicating which StarKeeper II NMSs were queried, and whether the data retrieval
succeeded. Entries will say "View Succeeded:" or "View Failed:", followed by the
StarKeeper II NMS name. If neither entry appears for an NMS that you know
should be connected to the Graphics System, you should check the connection.
These entries are followed by a display of the parameters you selected while
requesting the report. The body of the report, which appears next, uses some
special symbols when presenting the data:
An * in the first column of an entry indicates that the data on that line was provided
by the owner StarKeeper II NMS. Identical node data may appear in multiple NMS
databases if you have a hot spare configuration, or if data has been copied from
one NMS to another for any other reason.
A ? in the StarKeeper II NMS field means that the NMS name could not be
determined at the time of data retrieval. This may occur when connections are
being established or data is being synchronized. This is a transient condition.
Request the report again.
Trunk Trouble Recovery Procedures
Trunk configuration involves a number of individual steps that take place on one or
two nodes and one or two StarKeeper II NMS Core Systems. There are certain
error scenarios where recovery will require some manual intervention. The
following are manual procedures required to clean up inconsistencies which might
arise when any step fails in the sequence of trunk provisioning actions.
Procedure 8-1.
Existing Trunk Configuration Failure
If you load the trunk form from the database and make a change, and the submit
of the update fails, use Network Builder to perform the following steps:
1.
Autoload the failed transaction from the Configuration Activity Log
2.
Cancel Update
3.
Submit Update
Since the trunk already existed, there are records in the node and StarKeeper
Core System databases, so running the update again should achieve the desired
result. Note that there is an automatic retry mechanism that will attempt to
resubmit the update periodically; however, there are parameters that control the
frequency of retry and the maximum number of retries. If the conditions that
8-58
StarKeeper II NMS Graphics System Guide, R10.0, Issue 1
Using Network Builder to Configure Your Network
forced the failure require more time than the corresponding maximum retry
interval, then this procedure would be needed to resubmit.
Procedure 8-2.
New Trunk Configuration Failure
If you try to submit a new trunk form, and it fails, the manual procedure will
depend on where the failure occurred. The actions that are attempted in
provisioning both sides of a trunk are attempted in the following order:
A. Node enter trunk end2
B. StarKeeper II NMS enter trunk end2
C. Node enter trunk end1
D. StarKeeper II NMS enter trunk end1
E. Node restore trunk end2
F.
Node restore trunk end1
The following cases highlight the various failure scenarios and their recommended
cleanup procedures.
Case 1: (A) Node enter trunk end2 Failed
In this case, nothing has been entered in either the node or StarKeeper II
NMS database. Using Network Builder do the following:
■
Autoload this failed transaction from the Activity Log
■
Cancel Update
■
Submit Update
Case 2: (B) StarKeeper II NMS enter trunk end2 Failed
In this situation, step A has successfully been completed in that end2 data
has been entered in a node database. Cut-through to the StarKeeper II
NMS Core System that is monitoring the node on which end2 of the trunk is
found, and do the following:
■
setnode <end2_node_name>
■
end2_node_name> verify <trunk end2_slot>
If appropriate data comes back, proceed. Otherwise the data was
not entered on the node, and this is equivalent to Case 1, above.
■
end2_node_name> delete <trunk end2_slot>
■
end2_node_name> exit
■
cfg_sync <end2_node_name>
StarKeeper II NMS Graphics System Guide, R10.0, Issue 1
8-59
Using Network Builder to Configure Your Network
At this point, the failure has been reduced to that of Case 1, above, so in
Network Builder do the following:
■
Autoload the failed transaction from the Activity Log
■
Cancel Update
■
Submit Update
Case 3: (C) Node enter trunk end1 Failed
This case corresponds to data being entered in one node and the
appropriate StarKeeper II NMS Core System database. The actions will be
the same as case 2.
Case 4: (D) StarKeeper II NMS enter trunk end1 Failed
This case corresponds to data being entered on both nodes and the
StarKeeper II NMS only knows about one side of the trunk. Cut-Through to
the StarKeeper II NMS Core System that is monitoring the node on which
end2 of the trunk is found, and do the following:
■
setnode <end2_node_name>
■
end2_node_name> verify trunk <end2_slot>
■
end2_node_name> delete trunk <end2_slot>
■
end2_node_name> exit
■
cfg_sync <end2_node_name>
If the StarKeeper II NMS Core System that monitors end2 is not the same
as the StarKeeper II NMS Core System that monitors end1, then CutThrough to the StarKeeper II NMS Core System that monitors end1;
otherwise, the following steps must be executed on the StarKeeper II NMS
Core System that was used, above. Do the following:
■
setnode <end1_node_name>
■
end1_node_name> verify trunk <end1_slot>
■
end1_node_name> delete trunk <end1_slot>
■
end1_node_name> exit
■
cfg_sync <end1_node_name>
In Network Builder, do the following:
■
Autoload the failed transaction from the Activity Log
■
Cancel Update
■
Submit Update
Case 5: (E) Node restore trunk end2 or (F) Node restore trunk end1 Failed
8-60
StarKeeper II NMS Graphics System Guide, R10.0, Issue 1
Using Network Builder to Configure Your Network
Cut-Through to the StarKeeper II NMS Core System that is monitoring the
node on which end2 of the trunk is found, and do the following:
■
setnode <end2_node_name>
■
end2_node_name> verify trunk <end2_slot>
■
end2_node_name> restore trunk <end2_slot>
■
end2_node_name> exit
If the StarKeeper II NMS Core System that monitors end2 is not the same
as the StarKeeper II NMS Core System that monitors end1, then CutThrough to the StarKeeper II NMS Core System that monitors end1;
otherwise, the following steps must be executed on the StarKeeper II NMS
Core System that was used, above. Do the following:
■
setnode <end1_node_name>
■
end1_node_name> verify trunk <end1_slot>
■
end1_node_name> restore trunk <end1_slot>
■
end1_node_name> exit
Special Considerations
■
If you change the name of the trunk, you must first make sure all alarms for
the trunk have been cleared. This will also affect Network Monitor maps
and Performance Reporter Configuration Data.
■
Unknown Carriers
In an ICI network, you will assign the name of the carrier located at the
terminating end of an ICI trunk (type "t3i" trunk). When performing the Load
Trunk operation, if a carrier is assigned to a trunk but the form is unable to
determine the carrier name, the value ***UNKNOWN*** is displayed in the
"End Node 2 Carrier" field.
The value ***UNKNOWN*** is displayed if Network Builder cannot access
the StarKeeper II NMS Core System designated as the Primary Core, if the
database request fails on the Primary Core, or if the trunk record and the
ICI configuration data in the database on the Primary Core are in
disagreement.
In all cases, the form produces a notice indicating the problem. Before
submitting changes, re-enter the carrier name. You cannot submit changes
using a "End Node 2 Carrier" field value of ***UNKNOWN***. Choose the
carrier name from the list of configured carriers displayed by selecting the
abbreviated command button in the "End Node 2 Carrier" field. This list is
empty if Network Builder is unable to access the Primary Core.
■
No more than five Session Maintenance trunks can be configured on a
single node.
StarKeeper II NMS Graphics System Guide, R10.0, Issue 1
8-61
Using Network Builder to Configure Your Network
8-62
StarKeeper II NMS Graphics System Guide, R10.0, Issue 1
Using Network Builder to Configure Your Network
Configuring Groups
Use Network Builder to configure group records on the nodes in your network and
in the StarKeeper II NMS Core System databases.
Background Information
A group is a logical entity on the node that bundles together groups of ports and
channels. A group is designated as either a trunk group or a local group. A trunk
group can contain only trunk modules and a local group can contain ports for any
module other than a trunk module.
A local group is designated as an originating, receiving, or two-way group.
Members of originating groups, such as terminals and modems, can originate
calls. Members of receiving groups—like consoles, hosts, and dialers—can only
receive calls. Members of a two-way group can originate calls like a terminal and
receive calls like a host.
Screen 8-18.
Group Configuration Form
StarKeeper II NMS Graphics System Guide, R10.0, Issue 1
8-63
Using Network Builder to Configure Your Network
Group Parameters
This section lists parameters that are specifically related to configuring a group.
Parameter
Description
Device/Host
Entry cannot contain special (meta) characters.
Password
If you enter a password, when you navigate out of this field, the entry
is cleared and the field is filled with a string of asterisks.
Password Used
For
At least one of the two values must be specified if an entry exists in
the Password field to indicate if the password is required as part of
Group Security, Network Access, or both.
Type and
Direction
When a form update (via the load operation) is requested, the type
and direction settings may not be modified.
Special Considerations
Select Group
0
A special local originating group called select can be administered. If select is
administered in the node configuration database, terminal users can access a
different originating group by using the terminal user mode select command. The
originating group selected for this call must be assigned a network access
password. Refer to the node's documentation for more information.
8-64
StarKeeper II NMS Graphics System Guide, R10.0, Issue 1
Using Network Builder to Configure Your Network
Configuring Service Addresses
Use Network Builder to configure service addresses for each callable destination
in the network; you can specify a mnemonic address or an X.121 address, or
both. Addresses are required to properly route calls through the network. If you
are not familiar with service addresses, or would like a refresher, read
Background Information before proceeding with your configuration operation.
Background Information
An address identifies one or more destinations on the network. The full address of
a destination is composed of up to four levels (Service Addresses). A service
address can be a mnemonic address (an alphanumeric string), an X.121 address
(a numeric string), or both a mnemonic and an X.121 address. Each of these
address types can be assigned to a particular level in the addressing component
hierarchy.
Equivalence within Address Level Hierarchy
(Highest-to-Lowest)
Level Name
Mnemonic Name
X.121 Name
network
network
Data Network Identification Code (DNIC)
area
area
Service Region (SR)
exchange
exchange
Service Area (SA)
local
local
Endpoint Number or Range (EPN/EPNs)
Local addresses are generally used to route calls over trunks to the destination.
Addresses can also identify trunks to remote nodes, the remote nodes
themselves, or devices connected to the remote node.
Node endpoints can be addressed directly if an EPN is assigned to the module
port with the appropriate hardware module command. Refer to the appropriate
node documentation for further information.
StarKeeper II NMS Graphics System Guide, R10.0, Issue 1
8-65
Using Network Builder to Configure Your Network
Address types and addressing levels, along with other addressing features and
particulars, are explained in the following sections.
Screen 8-19.
Mnemonic Addresses
Service Address Configuration Form
0
A mnemonic address is an alphanumeric representation of a destination within the
network. Mnemonic addresses can be assigned to any of the following levels:
network, area, exchange, or local or as a speedcall or special address.
Mnemonic addresses can be assigned to receiving, two-way or trunk groups.
8-66
StarKeeper II NMS Graphics System Guide, R10.0, Issue 1
Using Network Builder to Configure Your Network
X.121 Addresses
0
An X.121 address is a numeric representation of an addressable destination. It
can be assigned to one of these levels: a Data Network Identification Code
(DNIC), a service region (SR), a service area (SA), as an endpoint number (EPN)
or range of EPNs, or as a speedcall address.
X.121 addresses can be assigned to originating, receiving, two-way, or trunk
groups.
Speedcall Addresses
0
Speedcall addresses are a shortened form of an address. By entering an
address (at the speedcall level) along with a dial string, you can create an alias for
the address.
Special Addresses
0
Special addresses are used to control the Directory Assistance and Billing
features. Specifying ? as a special address activates Directory Assistance on a
node. Specifying billing enables billing output on the nodes.
Security Mechanisms
Nodes support two security mechanisms to accomplish successful call setup:
originating group security and closed user group security.
Originating Group Security
0
Devices that originate calls, such as terminals and modems, belong to originating
groups. Originating group security determines whether a call from an originating
group member can access a particular service address. Access is determined by
comparing the originating group name to a pattern of characters specified in
configuring the address and then determining whether a match exists.
Closed User Group (CUG) Security
0
CUG security enables end users to form groups that can restrict incoming/
outgoing call access. CUG security prohibits members of a CUG from accessing
destinations that do not belong to the same CUG. End users can belong to more
than one CUG and can be associated with the open part of the network (no CUG
for the call).
StarKeeper II NMS Graphics System Guide, R10.0, Issue 1
8-67
Using Network Builder to Configure Your Network
To enable CUG security, CUG profiles must be first configured at the node with the
enter profile command. Then, the CUG profile can be associated with a
particular local X.121 address via the Network Builder service address
configuration form. The originators and destinations in groups associated with the
address assume the CUG permissions associated with that address.
Task Notes
■
If an X.3 and/or CUG profile is to be associated with the service address,
they must be entered into the node database first by executing the node's
enter profile command at the node.
■
Any groups, other than special system-created groups, must be entered
into the database using the Network Builder group configuration form. Note
that you can access the Network Builder Group configuration form directly
from the Network Builder Service Address configuration form.
■
An address having both a mnemonic and X.121 representation can be
associated with originating, two-way, receiving or trunk groups.
■
The Change Others With Same Pattern control always initially appears
as unchecked, even if checked in a previous update for the same address.
Service Address Parameters
Pane for Standard Addresses
0
This pane appears when you are configuring a network, area, exchange or local
service address (see Screen 8-19).
Parameter
Description
Change Others
With Same
Pattern
This indicates if all addresses on the same node with the same
security strings should or should not have their security string changed.
CUG Profile ID
This is the Closed User Group profile identifier associated with this
address.
This field is active only if Level is Local and an X.121 address is
entered.
8-68
Directory Entry
This is the text to be displayed if the user requests directory assistance
for the address.
Group Name 1
Group Name 2
Group Name 3
Group Name 4
These are the group names associated with the address being
entered. Group Name 1 is accessed first, then Group Name 2, etc.
StarKeeper II NMS Graphics System Guide, R10.0, Issue 1
Using Network Builder to Configure Your Network
Parameter
High Level
Protocol
Description
This indicates if a high level protocol should be used in the call request
packet for X.25 calls associated with the address.
This field is active only if Pad Support is Enabled.
High Level
Protocol ID
This is the two-digit hexadecimal notation to be put in the call user data
field of an X.25 call packet. You can prefix the number with the "0x"
hexadecimal notation or let Network Builder do it for you.
This field is active only if High Level Protocol is Enabled.
Originating
Group Security
This is the unique pattern that defines the security for the address. If
you do not have an entry, you do not have security.
Pad Support
This is the Packet Assembler/Disassembler mode of the addressed
X.25 port should be enabled. If enabled, the terminal or host using this
address requires X.25 packets to be assembled/disassembled while
entering/leaving the network.
X.3 Profile ID
This is the X.3 terminal user profile identifier for all users accessing the
X.25 host associated with the address. The associated menu supports
the standard three X.3 Profile IDs: simple, transparent, and mbit.
This field is active only if Pad Support is Enabled.
Pane for Speedcall Addresses
0
This pane is used when configuring a speed call address.
Parameter
Description
Dial String
Indicates the alphanumeric string that describes the address.
Directory Entry
Indicates whether or not the Dial String will be displayed to users when
directory assistance is requested for the address.
StarKeeper II NMS Graphics System Guide, R10.0, Issue 1
8-69
Using Network Builder to Configure Your Network
Pane for Special Addresses
0
This pane is used when configuring one of the special addresses, ? or billing.
Parameter
Billing Data
Storage
Description
Indicates the number of bytes of shared memory to be used on the node
to store billing data when the billing connection to the node is down.
This field is active only if the address is billing, for nodes that support
this feature.
Change
Others With
Same Pattern
Indicates if all addresses on the same node with the same security
strings should or should not have their security string changed.
Directory
Entry
Indicates the text to be displayed if the user requests directory
assistance for the address.
Indicates the unique pattern that defines the security for the address. If
Originating
Group Security you do not have an entry, you do not have security.
8-70
StarKeeper II NMS Graphics System Guide, R10.0, Issue 1
Using Network Builder to Configure Your Network
Generating Node Reroute Tables
The Network Builder Node Reroute Tables (NRT) configuration form is used to
generate and maintain NRTs. The NRTs generated by Network Builder are
downloaded to the applicable nodes, via the StarKeeper II NMS Core System.
The NRTs are then used by the nodes to support the Session Maintenance
feature.
Only Network Builder can generate NRTs. Because of its centralized position
within your network, it provides a network view of certain physical and logical
concepts and resources. To implement Session Maintenance in your network,
Network Builder generates NRTs that are inherently consistent and it can
download those tables to each node in your network.
A request to generate (New) or edit (Load) NRTs results in a display of the NRT
form to provide access to the entire set of NRTs. You can access a given node's
NRT, or a neighbor within that NRT, by selecting the desired node name from a
list. If there is a Pending NRT record, it will be loaded automatically when the NRT
form is invoked.
StarKeeper II NMS Graphics System Guide, R10.0, Issue 1
8-71
Using Network Builder to Configure Your Network
Screen 8-20.
NRT Configuration Form
Background Information
The Node Reroute Table (NRT) is a node database structure supporting a node's
Session Maintenance feature. An NRT is required for each node that participates
in this feature; and each NRT contains an entry for each node that is reachable via
one or two hops over Session Maintenance trunks. For each such neighbor node,
the NRT contains a list of preferred assisting nodes and, for each one-hop
neighbor, a list of physical Session Maintenance trunks which connect to the
node. The NRT is used to determine optimum reroute paths for sets of channels
on a failed trunk.
NRTs are created by Network Builder from trunk configuration data. Network
Builder then generates NRTs that list assisting nodes and trunks according to a
figure of merit which is based on the number of hops from the node in question. If
you disagree with the choices made by the software, you can rearrange the list of
preferred neighbor nodes and trunks to try first. You can also add assisting nodes
to support reroute paths through unadministered nodes.
8-72
StarKeeper II NMS Graphics System Guide, R10.0, Issue 1
Using Network Builder to Configure Your Network
Refer to the node's Session Maintenance Guide for more information on the
Session Maintenance feature, including the usage of NRTs.
Task Notes
■
When an NRT task is submitted, only changed data will be delivered to the
affected nodes.
■
Whenever a Session Maintenance trunk is added, deleted, or if the
Session Maintenance feature is removed from a trunk, the NRT for that
trunk must be created or modified, and properly submitted.
■
NRTs can be generated based on data currently in the database (called
Committed data), data submitted by Network Builder as "Held" (called
Pending data), or on Committed and Pending data. Use Committed data to
generate NRTs for the current network; use Pending data to generate
NRTs for network planning; use Committed plus Pending data to generate
NRTs for a combination of the two.
■
If you are generating NRTs for Session Maintenance simulation using
Pending data, then all node and trunk data must be in the Pending state in
order for the simulation to be meaningful. That is, all nodes and trunks that
are in the Committed state have to be resubmitted as "Held" before you
generate the NRTs. The only case in which you must use the Pending data
option to generate NRTs is when one or more nodes in your simulation
network is Pending.
■
Session Maintenance Simulation uses both Committed and Pending data
to analyze trunk topology. Therefore, the NRTs used by the simulation
should be generated from the Committed node data and Committed and
Pending trunk data. See Chapter 9 for details on Session Maintenance
Simulation and analysis.
■
You cannot delete the last Assisting Node or Trunk from a list.
■
If you have made any changes to the Session Maintenance topology, or if a
node name within the network has been changed you must run skload or
cfg_sync to re-synchronize the configuration database and generate new
NRTs.
NRT Parameters
Parameter
Assisting
Nodes
Description
This is a scrolling list to edit the assisting nodes for the given neighbor
node. The list can be edited by using the buttons below the list. The
node name displayed is the actual node name of the node.
StarKeeper II NMS Graphics System Guide, R10.0, Issue 1
8-73
Using Network Builder to Configure Your Network
Parameter
Description
Hops
This shows the number of hops from the selected node to the neighbor
node; either 1 or 2.
Neighbor
Nodes
This is a scrolling list to choose the neighbor node whose data you want
to view. The node name displayed is the actual node name of the node.
NRT for Node
This is a scrolling list to choose the node whose NRT will be displayed.
The node name specified is the Node name used by StarKeeper II NMS.
Trk Name:
Mod Addr.
This is a scrolling list to edit the trunks for the given neighbor nodes.
(The list does not appear if the number of hops is 2.) The format is trunk
name and the trunk module address separated by a colon. For example:
trkab:112. The list can be edited by using the buttons below the list.
NRT Generation Report
To view the data corresponding to the latest Node Reroute Table generation,
choose Generation Report from the View menu. An example NRT Generation
Report is shown in the following screen.
Screen 8-21.
An Example NRT Generation Report
NRT Trouble Recovery Procedures
NRT configuration is complex. Failures can occur in communicating with any
individual node or StarKeeper II NMS Core System. The following are procedures
8-74
StarKeeper II NMS Graphics System Guide, R10.0, Issue 1
Using Network Builder to Configure Your Network
to resolve inconsistencies which may arise when any step fails in the sequence of
NRT provisioning actions.
Procedure 8-3.
Nodes Failed, or Trunks to the Nodes Failed
Wait until the nodes or trunks are back in a normal state. Then, on the StarKeeper
II NMS Core System that monitors the node, execute the following command:
cfg_sync <node_name>
In Network Builder perform the following steps:
1.
Cancel Update
2.
New or (Load)
3.
Submit Update
Procedure 8-4.
Node Database Update for the NRT Failed
In Network Builder, do the following:
1.
Cancel Update
2.
New or (Load)
3.
Submit Update
Procedure 8-5.
StarKeeper II NMS Core System Database Update for the
NRT Failed
On the StarKeeper II NMS Core System do the following:
cfg_sync <node_name>
In Network Builder, do the following:
1.
Cancel Update
2.
New or (Load)
3.
Submit Update
Special Considerations
You can not delete a node’s NRT via the NRT form. When you delete a node, its
re-route table is also deleted.
StarKeeper II NMS Graphics System Guide, R10.0, Issue 1
8-75
Using Network Builder to Configure Your Network
8-76
StarKeeper II NMS Graphics System Guide, R10.0, Issue 1
Using Network Builder to Configure Your Network
Configuring SNIs
The SNI configuration form will handle configuration of all Subscriber Network
Interfaces (SNIs) in your network. Using Network Builder, an SNI is identified by
the physical address of the associated Access Interface (AI) module port. Once
configured, an SNI record can be loaded either via this physical address or via
one of its assigned E.164 individual addresses (the latter may be useful for
troubleshooting purposes).
Background Information
Network Builder's support of SNI configuration permits StarKeeper II NMS to
operate as a Supervisory System for BNS-2000, administering a portion of a
multiple vendor and multiple carrier SMDS system (as per Bellcore requirements).
As a result, Network Builder provides the basic tools for administering BNS-2000
nodes in an SMDS network, with its functionality oriented towards administering
individual SNIs (rather than groupings of SNIs). Refer to the BNS-2000 SMDS
Guide for a more detailed discussion of the SMDS service and how Network
Builder is used to help configure those networks.
To assist in configuring SNIs in your network, a variety of reports are provided by
Network Builder. In contrast to the localized manner in which SNI configuration is
done, these reports provide a global view of your network's SNI data. These
reports will be useful during SNI configuration (for example, to determine unused
E.164 addresses) and after SNI configuration is complete (for example, to check
that screening tables are properly populated across the network). Refer to the
BNS-2000 SMDS Guide for specific applications of these reports. The reports
themselves are described in more detail later in this section.
StarKeeper II NMS Graphics System Guide, R10.0, Issue 1
8-77
Using Network Builder to Configure Your Network
Screen 8-22.
SNI Configuration Form
Task Notes
8-78
■
An AI port must be configured before an SNI can be configured for that port
(except for proposed submissions).
■
Individual addresses assigned to an SNI must be within the range of
addresses supported on its node (as entered via the Node form, in the
SMDS data pane).
■
In an ICI network, each group address assigned to an SNI must contain an
address prefix configured for your company (as entered via the ICI Prefix
form).
StarKeeper II NMS Graphics System Guide, R10.0, Issue 1
Using Network Builder to Configure Your Network
SNI Parameters
The SNI configuration form is partitioned into a key pane and three data panes:
Individual Addrs, Group Addrs, and Screening Addrs.
Individual Addrs Pane
0
Use this pane to assign configuration parameters and individual addresses to an
SNI.
Parameter
Description
Billing
Indicates whether SMDS Billing should be enabled or disabled.
AP1 Switch
Access
Indicates if the SNI has access to an AP1 Switch.
Egress MCDU
This setting specifies the maximum number of concurrent data units
permitted in the egress (to CPE) direction.
Individual
Addresses
This list contains the E.164 individual addresses assigned to the
SNI. Up to 16 individual addresses can be assigned to an SNI. Up
to 32 individual addresses can be assigned if AP1 Switch Access is
indicated.
All additions, deletions, and modifications of items in this list are
reflected in the Individual Addresses list in the Group Addr pane.
Ingress MCDU
This setting specifies the maximum number of concurrent data units
permitted in the ingress (from CPE) direction.
Pre-selected
Carrier
Indicates the name of the SNI's pre-selected carrier for inter-LATA
SMDS traffic. The carrier must be an Interexchange Carrier. This
control is active only for an SNI on a node in an ICI network for a
Local Exchange Carrier.
Traffic Type
Indicates if the SNI is to carry your company's official or
subscriber's SMDS traffic. This control is active only for an SNI on a
node in an ICI network for a Local Exchange Carrier.
StarKeeper II NMS Graphics System Guide, R10.0, Issue 1
8-79
Using Network Builder to Configure Your Network
Group Addrs Pane
0
Use this pane to assign an SNI to groups. Each group will contain one or more
individual addresses assigned to the SNI as its member(s).
8-80
StarKeeper II NMS Graphics System Guide, R10.0, Issue 1
Using Network Builder to Configure Your Network
Parameter
Group Addresses
Description
This list contains the E.164 group addresses assigned to the SNI.
Up to 48 group addresses can be assigned to an SNI.
Individual Addresses
This list contains either all of the individual addresses assigned to the SNI,
or just the members of the current group address in the Group Addresses
list. In either case, the members of the current group address are
highlighted.
The list contents are controlled by the pair of command buttons located
below the list. The two buttons are: Display All Addresses and
Display Group Members .
To add a member, select an address so that it is highlighted. To remove a
member, select a highlighted address so that it is no longer highlighted.
Select the Edit button to apply your change or changes. The members
of the current group address will then be displayed.
Display All Addresses
Choosing this button displays all individual addresses assigned to the SNI
and highlights the members of the current group address.
Display Group Members
Choosing this button will display only the members of the current group
address.
Screening Addrs Pane
0
Use this pane to create address screening for the SNI.
StarKeeper II NMS Graphics System Guide, R10.0, Issue 1
8-81
Using Network Builder to Configure Your Network
Parameter
Description
Group
Screening
This list contains the E.164 group addresses in the SNI's group address screening
table.
A total of 128 address can be assigned between Group and Individual Screening
tables.
Individual
Screening
This list contains the E.164 individual addresses in the SNI's individual address
screening table.
A total of 128 address can be assigned between Individual and Group Screening
tables. For instance, you could have 100 Individual and 28 Group Screening tables
assigned, or some other combination that can total up to 128.
Listed
Addresses Are
This setting indicates whether the given screening table allows or disallows calls to
or from the listed addresses.
This control is not active when the screening table is empty; in this case, no
addresses are disallowed.
SNI Reports
In addition to the standard "Task Log" available on all Network Builder
configuration forms, several other reports are provided that will assist you in
completing SNI configuration tasks. Except for the "Configuration Report", all
others provide global views of your network's SNI data. All of these reports can be
searched, printed, or saved to a file. The reports are listed and described below:
8-82
■
Configuration Report
This report provides an alternate view of the data from the current SNI
record. The "Pre-selected Carrier" and "Traffic Type" are displayed only for
an SNI on a node in an ICI network for a Local Exchange Carrier. Screen 823 shows an example of a Configuration Report.
■
Configured SNIs Report
This report lists all SNIs in the network. Data may be displayed for all
StarKeeper II NMSs in the network, or for owner StarKeeper II NMSs only
(an SNI's owner NMS is the one that monitors the Admin and Console
connections of the node on which the SNI resides). This report may be
sorted by SNI or by the name of the StarKeeper II NMS that provided the
data.
■
Group Address Appearances Report
This report displays the SNIs to which group addresses are assigned. This
report may be obtained for a single group address, or for all group
addresses in the network. Data may be displayed for all StarKeeper II
NMSs in the network, or for owner StarKeeper II NMSs only. This report
may be sorted by group address or by SNI.
StarKeeper II NMS Graphics System Guide, R10.0, Issue 1
Using Network Builder to Configure Your Network
■
Group Members Report
This report lists the members of a specified group address. All individual
address members, and their associated SNIs, are listed. Data may be
displayed for all StarKeeper II NMSs in the network, or for owner
StarKeeper II NMSs only. This report may be sorted by member SNI or
member address. (Screen 8-24) shows an example of a Group Members
Report.
■
Group Prefix Audit Report
This report displays the SNIs with group addresses for which no
corresponding address prefix is configured for your company. This will
occur if a LATA ID has not been assigned to the SNI's node, if the SNI was
upgraded to BNS-2000 R2.0 but the group address was not updated to use
one of your company's address prefixes, or if the ICI Prefix form was used
to remove an address prefix assigned to a group address that is assigned
to an SNI. If the report is empty (i.e. the view succeeded and zero group
addresses are displayed), then you can be confident that all of the group
addresses assigned to your company's SNIs contain an address prefix
configured for your company in the SNI's LATA. Data may be displayed for
all StarKeeper II NMSs in the network, or for owner StarKeeper II NMSs
only. The report may be sorted by group address or by SNI. You must be a
public network SMDS provider able to access the ICI configuration
database on the Primary Core in order to run this report.
■
Group Screen Appearances Report
This report identifies which SNI's group screening tables contain which
group addresses. You can request the report for a single specific group
address, or for all group addresses in the network. Data may be displayed
for all StarKeeper II NMSs in the network, or for owner StarKeeper II NMSs
only. This report may be sorted by group address or by SNI.
■
Individual Addresses Report
This report lists all individual addresses in the network. Data may be displayed for all StarKeeper II NMSs in the network, or for owner StarKeeper II
NMSs only. This report may be sorted by individual address or SNI.
■
Individual Screen Appearances Report
This report identifies which SNI's individual screening tables contain which
individual addresses. You can request the report for a single specific
individual address, or for all individual addresses in the network. Data may
be displayed for all StarKeeper II NMSs in the network, or for owner
StarKeeper II NMSs only. This report may be sorted by individual address
or by SNI.
■
Pre-selected Carriers Report
This report provides a listing of the SNIs that are assigned a pre-selected
carrier. Data may be displayed for all StarKeeper II NMSs in the network, or
for owner StarKeeper II NMSs only.
StarKeeper II NMS Graphics System Guide, R10.0, Issue 1
8-83
Using Network Builder to Configure Your Network
The report may be sorted by carrier name or by SNI. Your company must
be a Local Exchange Carrier able to access the ICI configuration database
on the Primary Core in order to run this report.
Following the title and time stamp heading of each report, entries appear
indicating which StarKeeper II NMSs were queried, and whether the data retrieval
succeeded. Entries will say "View Succeeded:" or "View Failed:", followed by the
StarKeeper II NMS name, as appropriate. If neither entry appears for an NMS that
you know should be connected to this Graphics System, you should confirm the
connections. These entries are followed by a display of the parameters you
selected while requesting the report. The body of the report, which appears next,
uses some special symbols in presenting the data:
An * in the first column of an entry indicates that the data on that line was provided
by the owner StarKeeper II NMS. Identical SNI data may appear in multiple NMS
databases if you have a hot spare configuration, or if data has been copied from
one NMS to another for any other reason.
A ? in the StarKeeper II NMS field means that the NMS name could not be
determined at the time of data retrieval. This may occur when connections are
being established or data is being synchronized. This is a transient condition.
Request the report again.
An A or D will appear after each address in a Screen Appearances Report
indicating that the address is either allowed or disallowed, respectively, in the
specified screen.
8-84
StarKeeper II NMS Graphics System Guide, R10.0, Issue 1
Using Network Builder to Configure Your Network
The following screen shows an example of a Configuration Report.
StarKeeper II NMS Network Builder: SNI Configuration Report
Created: 02/27/98 16:02
Node Name: nj/wreck/pinta
Module Address: 10
Port Number: 1
Comment: Company X - NJ Office
Ingress MCDU: 1
Egress MCDU: 16
AP1 Switch Access: Yes
Pre-selected Carrier: AT&T
Traffic Type: Public Network
Individual Addresses:
---------------------------------------------------9085764290
9085801212
9085804372
9089575342
---------------------------------------------------Group Address: 2127659876
---------------------------------------------------9085764290
9085804372
---------------------------------------------------Group Address: 3175553428
---------------------------------------------------9085804372
---------------------------------------------------Group Address: 8765554321
---------------------------------------------------9085801212
9089575342
---------------------------------------------------Individual Address Screening Table:
---------------------------------------------------3126548877
4156345532
---------------------------------------------------Listed Addresses Are Disallowed.
Group Address Screening Table:
---------------------------------------------------9087775429
---------------------------------------------------Listed Addresses Are Allowed.
Screen 8-23.
Configuration Report
StarKeeper II NMS Graphics System Guide, R10.0, Issue 1
8-85
Using Network Builder to Configure Your Network
The following screen is an example of Group Members Report.
StarKeeper II NMS Network Builder: SNI Group Members Report
Created: 02/04/98 14:47
View Succeeded: groucho
View Succeeded: chico
View Succeeded: harpo
Members of Group Address: 1000000000
Data displayed for All NMSs.
Sorted by Member Address.
Total Members: 20
* = Data obtained from Owner NMS.
====================================================================
Individual
Node
Module
Port StarKeeper II
Address
Name
Address Number NMS
-------------------------------------------------------------------*2096011011 spain/blob/node41/brutus
49
1 groucho
*2096014401 spain/blob/node41/brutus
49
1 groucho
*2096021002 spain/blob/node41/brutus
49
4 groucho
*2096021003 spain/blob/node41/brutus
49
4 groucho
*2096021004 spain/blob/node41/brutus
49
4 groucho
*2096021005 spain/blob/node41/brutus
49
4 groucho
*2096021006 spain/blob/node41/brutus
49
4 groucho
*2096021007 spain/blob/node41/brutus
49
4 groucho
*2096044112 spain/blob/node41/brutus
49
2 groucho
*5167000000 spain/blob/node43/mr_ed
41
1 harpo
5167000000
spain/blob/node43/mr_ed
41
1 chico
*5167002000 spain/blob/node43/mr_ed
4
4 harpo
*5167002001 spain/blob/node43/mr_ed
4
4 harpo
*5167002002 spain/blob/node43/mr_ed
4
4 harpo
*5167002003 spain/blob/node43/mr_ed
4
4 harpo
*5167014303 spain/blob/node43/mr_ed
39
3 harpo
*5167014304 spain/blob/node43/mr_ed
39
3 harpo
*5167014305 spain/blob/node43/mr_ed
39
3 harpo
*5167014315 spain/blob/node43/mr_ed
39
3 harpo
*5167014355 spain/blob/node43/mr_ed
39
3 harpo
====================================================================
Screen 8-24.
Group Members Report
SNI Trouble Recovery Procedures
During SNI configuration task processing one of the several node or StarKeeper II
NMS update steps may fail, resulting in task retries or task stoppage. This section
presents recovery procedures to be used if one of these situations arise. View the
Task Log to determine at which point in the task a problem occurred, and to
determine the reason for the failure.
8-86
StarKeeper II NMS Graphics System Guide, R10.0, Issue 1
Using Network Builder to Configure Your Network
In all cases, if the task is retrying, allow it to continue with the retry process. If the
task has stopped, use one of the following procedures to recover.
Procedure 8-6.
SNI Trouble Recovery Scenario 1: Node Update Failure
If the first node update attempt failed, (i.e., only a single node update message
appears in the log, and it indicates failure) and the task has stopped:
1.
Cancel the task;
2.
Fix the problem (based on the information contained in the task log
message);
3.
Re-submit the task.
! WARNING:
Do not apply the above procedure if any partial node updates have
occurred. In the case that partial node updates have occurred, use one of
the following procedures, as applicable.
Procedure 8-7.
SNI Trouble Recovery Scenario 2: Incomplete Node/NMS
Updates
If...
■
at least one node update has succeeded, and then a node update attempt
fails (also see Procedure 8-8);
OR
■
all node updates succeed, and then a StarKeeper II NMS update fails;
and the task has stopped:
1.
Save or print a copy of the SNI Configuration Report.
2.
Cancel the task;
3.
Run cfg_sync for the affected node;
4.
Re-load the SNI:
■
For StarKeeper II NMS failures, check the group address
membership against the saved/printed Configuration Report. Make
changes if needed.
■
For node failures, re-enter the required data on the form, using the
saved/printed Configuration Report as your source;
StarKeeper II NMS Graphics System Guide, R10.0, Issue 1
8-87
Using Network Builder to Configure Your Network
5.
Re-submit the task (for StarKeeper II NMS failures, if changes were not
required on the re-loaded form to fix any group address membership data
problems, do not re-submit).
Procedure 8-8.
SNI Trouble Recovery Scenario 3: New SNI Failure
When a New SNI configuration task has stopped before any StarKeeper II NMS
updates have been attempted, and you want to avoid having to manually re-enter
data, you can use the following procedure:
1.
Do not Exit the current SNI form;
2.
Invoke a second SNI configuration form from the Network Builder control
window. On this second form...
■
Delete the SNI which failed to be entered (if any warning notices
appear during this procedure, do not be concerned, choose
"Continue");
■
Exit.
3.
Choose New from the File menu of the first SNI form, and choose Current
Data on the Defaults control when the New command window pops up;
4.
Re-submit this form (thereby preserving the data you originally entered).
Procedure 8-9.
SNI Trouble Recovery Scenario 4: Unknown Node Data Loss
A Network Builder SNI task has completed successfully but the node's update
was lost for some reason. For instance, the node went down or has been rebooted before a periodic update was done.
The next time you use Network Builder to submit a change to the SNI, you may
find that the task has stopped while updating the node. The error message
displayed will be Address X already exists or Address X does not
exist. If this happens, you can use the following procedure:
1.
Invoke an SNI configuration form from the Network Builder control window.
2.
Delete the SNI in question.
3.
Choose New from the File menu of the SNI form, and choose Current
Data on the Defaults control when the New command window pops up.
4.
Re-submit this form (thereby preserving the data you originally entered).
Special Considerations
■
8-88
Database Management Concerns
StarKeeper II NMS Graphics System Guide, R10.0, Issue 1
Using Network Builder to Configure Your Network
The need to move SNI configuration data from one StarKeeper II NMS
Core System to another may arise for a variety of reasons for example,
night fold-down, hardware upgrading or expansion, other backup purposes.
Unlike other configuration data, a two-step process is required to
completely move SNI data. The first step is to run skload on the Core
System that is to receive the data; the second step is to run sni_sync on
that Core System. Refer to the StarKeeper II NMS Core System Guide for
complete descriptions of these commands and their applications.
■
Handling Conflicting Data
Before an SNI record is loaded into the form, database audits are performed to determine whether SNI data in the StarKeeper II NMS database
agrees with that in the SNI's node database. Whenever there is conflict in
data, a notice will appear displaying the mismatched data, and asking you
to select the desired source of data to be loaded (you must choose one of
the sources; you can only abort the Load by quitting the Configure SNI window). Note that selecting a specific data source and submitting this record
will result in synchronization of the two databases for this SNI; be sure to
select the proper data before proceeding. This situation may be a symptom
resulting from the transfer of data from one Core System to another.
■
Unknown Carriers
In an ICI network, if the company is a Local Exchange Carrier, you will
assign an Interexchange Carrier as the "Pre-selected Carrier" of an SNI.
When performing the Load SNI operation, if a carrier is assigned to an SNI
and the form is unable to determine the carrier name, ***UNKNOWN*** is
displayed in the "Pre-selected Carrier" field.
The value ***UNKNOWN*** is displayed if Network Builder cannot access
the StarKeeper II NMS Core System designated as the Primary Core, if the
database request fails on the Primary Core, or if the SNI record and the ICI
configuration data in the database on the Primary Core are in
disagreement.
In all cases, the form produces a notice indicating the problem. Before
submitting any changes, re-enter the carrier name, because you cannot
submit changes using a "Pre-selected Carrier" field value of
***UNKNOWN***. The carrier name is chosen from the list of configured
Interexchange Carriers produced by selecting the button in the "Preselected Carrier" field. This list is empty if Network Builder is unable to
access the Primary Core.
■
Billing
The first member of a group (the lowest numbered individual address
assigned to the group) is the billing identifier for the group on the SNI.
StarKeeper II NMS Graphics System Guide, R10.0, Issue 1
8-89
Using Network Builder to Configure Your Network
8-90
StarKeeper II NMS Graphics System Guide, R10.0, Issue 1
Using Network Builder to Configure Your Network
Configuring ICI Carriers
The ICI Carrier form is the first Network Builder form you use to configure an ICI
network (public network SMDS). Use the ICI Carrier form to configure general
information about all of the carriers in your ICI network. These carriers consist of
your company plus all other carriers connected to your company for the purposes
of providing SMDS in a public network.
The ICI Carrier form is partitioned into two panes: a key pane and a data pane.
The key pane contains controls that specify a carrier name, as well as a new
carrier name if the command is a Load.
The data pane contains a control that indicates the carrier role, and controls to
specify a carrier type, a carrier code, and a comment. The carrier role shows
whether you are configuring information about your company or about another
company in your ICI network. The form automatically determines the carrier role
based on context (as described later). Use the ICI Carrier form to assign a carrier
type to a carrier (a Local Exchange Carrier or an Interexchange Carrier). Then,
use the form to assign a carrier code to the carrier. The carrier code is an SMDS
CIC if the carrier is an Interexchange Carrier. It is the carrier's NECA CC if the
carrier is a Local Exchange Carrier.
The ICI Carrier form (along with the ICI Prefix form and the ICI Group Address
form) updates ICI configuration data in a database on the StarKeeper II NMS Core
System designated as the Primary Core. Designate a Core System as the
Primary Core by running the ici_primary command on that Core. You cannot
submit an update using the ICI Carrier form unless Network Builder can access
the Primary Core. After using the ICI Carrier form to update the database on the
Primary Core, run the ici_dl command on the Primary Core in order to download
the ICI configuration data to all of the BNS-2000 nodes in your network. This step
can be deferred until you have configured the foundation of your ICI network
(carriers, address prefixes, group addresses, and nodes).
Refer to the BNS-2000 SMDS Guide for a more detailed discussion of the SMDS
service and how Network Builder is used to help configure those networks.
StarKeeper II NMS Graphics System Guide, R10.0, Issue 1
8-91
Using Network Builder to Configure Your Network
Screen 8-25.
ICI Carrier Configuration Form
Background Information
If your company is a Local Exchange Carrier, use the ICI Carrier form to
administer configuration data about the following carriers:
■
your company
■
all Local Exchange Carriers connected to your company for the purposes
of providing intercompany serving arrangements for intra-LATA SMDS
■
all Interexchange Carriers connected to your company where your
company provides Exchange Access SMDS
If your company is an Interexchange Carrier, the use the ICI Carrier form to
administer configuration data about these carriers:
8-92
■
your company
■
all Local Exchange Carriers connected to your company where your
company is providing interexchange SMDS
StarKeeper II NMS Graphics System Guide, R10.0, Issue 1
Using Network Builder to Configure Your Network
Always configure your company first. That is, the first carrier added using the ICI
Carrier form is your company. The form sets the carrier role of the first carrier to
self. After using the ICI Carrier form to add your company, all other carriers added
have a carrier role of other set automatically by the form.
After using the ICI Carrier form to add your company, use the ICI Prefix form to
configure your company's address prefixes. Then use the ICI Group Address form
to configure the group addresses for which your company acts as the Group
Address Agent. These group addresses and their members are based on your
company's set of address prefixes. Use the Node form to assign SMDS SR, SA,
and EPN values and a LATA id to your ICI nodes based on your company's
address prefixes in the LATA. Use the SNI form to assign individual and group
addresses to your company's SNIs, based on your company's address prefixes.
After using the ICI Carrier form to add other carriers, use the ICI Prefix form to
assign the address prefixes belonging to Local Exchange Carriers directly
connected to your company. Use the Trunk form to configure the trunks that carry
ICI traffic and terminate at the other carriers added using the ICI Carrier form. If
your company is a Local Exchange Carrier, use the SNI form to identify which of
the other ICI carriers act as the pre-selected carrier for an SNI's inter-LATA SMDS
traffic.
Task Notes
■
You cannot delete a carrier if there are any address prefixes configured for
it. Use the ICI Prefix form to delete those prefixes before deleting the
carrier.
■
You cannot change the carrier code for an other carrier, or delete an other
carrier if there are any configured or pending trunks or (if your company is a
Local Exchange Carrier) SNIs that reference the carrier. Use the Trunk
form and the SNI form to delete the carrier from these trunks and SNIs
before changing the carrier code. When submitting the carrier code
change, the form notifies you which, if any, configured trunk or SNI tasks
reference the carrier. To see if any pending trunk or SNI tasks reference the
carrier, examine the Configuration Activity Log.
StarKeeper II NMS Graphics System Guide, R10.0, Issue 1
8-93
Using Network Builder to Configure Your Network
ICI Carrier Parameters
Parameter
Description
Carrier
Code
If the carrier is a Local Exchange Carrier, enter its NECA CC. If the carrier
is a Interexchange Carrier, enter its SMDS CIC.
Carrier
Role
The first carrier added has the carrier role self. Each additional carrier you
add has the carrier role other. (The first carrier you add must be your
company.)
Carrier
Type
If your company is a Local Exchange Carrier, a maximum of 24 Interexchange Carriers may be added. If your company is an Interexchange Carrier, then your company is the only Interexchange Carrier allowed.
ICI Carrier Reports
In addition to the standard "Task Log" available on all Network Builder
configuration forms, another report is provided that will assist you in completing
ICI Carrier configuration tasks. This report provides a global view of your
network's carrier data. The report can be searched, printed or saved to a file. It is
listed and described below:
■
Configured Carriers Report
This report provides a listing of all carriers that have been configured using
the ICI Carrier form. As such, it provides a listing of all carriers known to
your network. The report is sorted by carrier name. You must be a public
network SMDS provider able to access the ICI configuration database on
the Primary Core in order to run this report.
Following the title and time stamp heading of the Configured Carriers Report, an
entry will appear indicating the name of the StarKeeper II NMS that was queried.
This is the Primary Core. The entry will also indicate whether the data retrieval
succeeded. It will say "View Succeeded:" or "View Failed:", followed by the name
of the Primary Core. This is followed by a display of the report parameters,
followed by the body of the report.
Special Considerations
8-94
■
Upon submitting an update to add the first carrier, the form displays a
notice reminding you that you are about to configure carrier information for
your company (the carrier self).
■
Upon submitting an update, the form displays a notice reminding you to run
the ici_dl program on the Primary Core, in order to download your ICI
configuration data to the BNS-2000 nodes in your ICI network. This step
can be deferred until you have configured the foundation of your ICI
network (carriers, address prefixes, group addresses, and nodes).
StarKeeper II NMS Graphics System Guide, R10.0, Issue 1
Using Network Builder to Configure Your Network
■
If you have changed both the carrier name and carrier code, the form
displays a notice requesting you to confirm these changes. Changing both
the name and code results in the ICI configuration data for the old carrier
being assigned to the new carrier, once the ici_dl program is run.
StarKeeper II NMS Graphics System Guide, R10.0, Issue 1
8-95
Using Network Builder to Configure Your Network
8-96
StarKeeper II NMS Graphics System Guide, R10.0, Issue 1
Using Network Builder to Configure Your Network
Configuring ICI Prefixes
The ICI Prefix form allows you to configure a list of the first six digits of SMDS
addresses that are used in your ICI network (public network SMDS). Use the ICI
Prefix form to configure the address prefixes allocated to your company plus the
address prefixes allocated to all Local Exchange Carriers of interest in your ICI
network. You configure all of the address prefixes that are currently deployed for
use in SMDS individual and group addresses, as well as all of the prefixes
planned for future deployment. Embodied SACs are not to be included.
The ICI Prefix form is partitioned into two panes: a key pane and a data pane. The
key pane contains controls that indicate the name of the carrier and the LATA in
which the prefixes are deployed. The data pane contains a list for entering the
address prefixes. Up to 64 address prefixes per carrier per LATA are allowed.
Within this list, you can specify a maximum of eight unique SRs (the first three
digits of the prefix).
The ICI Prefix form (along with the ICI Carrier form and the ICI Group Address
form) updates ICI configuration data in a database on the StarKeeper II NMS Core
System designated as the Primary Core. Designate a Core System as the
Primary Core by running the ici_primary command on that Core. You will not be
able to submit an update using the ICI Prefix form unless Network Builder is able
to access the Primary Core. Once you have used the ICI Prefix form to update the
database on the Primary Core, run the ici_dl command on the Primary Core in
order to download the ICI configuration data to all of the BNS-2000 nodes in your
ICI network. This step can be deferred until you have configured the foundation of
your ICI network (carriers, address prefixes, group addresses, and nodes).
Refer to the BNS-2000 SMDS Guide for a more detailed discussion of the SMDS
service and how Network Builder is used to help configure those networks.
StarKeeper II NMS Graphics System Guide, R10.0, Issue 1
8-97
Using Network Builder to Configure Your Network
Screen 8-26.
ICI Prefixes Configuration Form
Background Information
If your company is a Local Exchange Carrier, then you use the ICI Prefix form to
administer address prefixes for the following carriers:
■
your company
■
all Local Exchange Carriers connected to your company for the purposes
of providing intercompany serving arrangements for intra-LATA SMDS
Use the ICI Prefix form to configure prefixes for your company in each LATA in
which your company has BNS-2000 nodes monitored by the same Primary Core.
Also configure prefixes for each Local Exchange Carrier in each LATA
administered by your Primary Core with which your company has an
intercompany serving arrangement. Configure all prefixes that are currently in use
for SMDS, and those that are reserved for future use.
If your company is an Interexchange Carrier, then use the ICI Prefix form to
administer address prefixes for the following carriers:
8-98
■
your company
■
all Local Exchange Carriers connected to your company where your
company is providing interexchange SMDS
StarKeeper II NMS Graphics System Guide, R10.0, Issue 1
Using Network Builder to Configure Your Network
Use the ICI Prefix form to configure prefixes for your company in LATA "0". Also
configure prefixes for each Local Exchange Carrier in each LATA connected to
your company. Configure all prefixes that are currently in use for SMDS, and those
that are reserved for future use.
The prefixes that you configure for your company in a given LATA are used as the
prefixes of the SMDS individual and group addresses allocated to your company
in the LATA. After using the ICI Prefix form to configure your company's address
prefixes, use the ICI Group Address form to configure the group addresses for
which your company acts as the Group Address Agent in a given LATA. These
group addresses and their members are based on your company's set of address
prefixes in that LATA. Use the Node form to assign to your BNS-2000 nodes a set
of SMDS SR, SA, and EPN values and a LATA, based on the address prefixes you
assigned to your company in the node's LATA. Then use the SNI form to assign
individual addresses to your company's SNI's based on the SMDS SR, SA, and
EPN values assigned to the SNI's node. Also use the SNI form to assign group
addresses to your company's SNIs based on the address prefixes assigned to
your company in the SNI's LATA.
Task Notes
■
You must use the ICI Carrier form to configure a carrier before you can use
the ICI Prefix form to configure address prefixes for the carrier.
■
If your company is a Local Exchange Carrier, then you are not allowed to
assign address prefixes to another Local Exchange Carrier in a given LATA
unless there are address prefixes already configured for your company in
that LATA.
■
If your company is a Local Exchange Carrier, then you cannot delete all of
your company's address prefixes in a given LATA if there is another Local
Exchange Carrier that has address prefixes configured in that LATA. You
must first delete all of the address prefixes for the other carrier.
■
You are not allowed to delete all of a carrier's address prefixes in a given
LATA if a "t3i" trunk is terminating at the carrier in the LATA. Use the Trunk
form first to delete the trunk.
■
Before using the ICI Group Address form to configure a group for which
your company acts as the Group Address Agent, you must use the ICI
Prefix form to configure the prefix of the group for your company in the
LATA which acts as the resolving network.
■
Before using the Node form to assign an SMDS SR and SA to a BNS-2000
node, you must use the ICI Prefix form to configure a corresponding
address prefix for your company in the operational LATA of the node.
■
Before using the SNI form to assign a group address to an SNI, you must
use the ICI Prefix form to configure the prefix of the group address for your
company in the operational LATA of the SNI's node.
StarKeeper II NMS Graphics System Guide, R10.0, Issue 1
8-99
Using Network Builder to Configure Your Network
ICI Prefix Parameters
Parameter
Address
Prefixes
Description
This list displays the six-digit address prefixes assigned to the carrier in
the LATA.
Up to 64 prefixes can be assigned to a carrier in a LATA. You can specify
a maximum of eight unique SRs (the first three digits of the prefix).
ICI Prefix Reports
In addition to the standard "Task Log" available on all Network Builder
configuration forms, several other reports are provided that will assist you in
completing ICI Prefix configuration tasks. Except for the Configuration Report, all
others provide global views of your network's prefix data. The reports can be
searched, printed or saved to a file. They are listed and described below:
■
Configuration Report
This report provides an alternative view of the address prefixes on the
form. The following screen provides an example of the Configuration
Report.
Screen 8-27.
8-100
ICI Prefix Configuration Report
StarKeeper II NMS Graphics System Guide, R10.0, Issue 1
Using Network Builder to Configure Your Network
■
Configured Prefixes Report
This report provides a listing of all address prefixes that have been
configured using the ICI Prefix form. As such, it essentially provides a
directory listing of all address prefixes known to your network. The report
may be sorted by address prefix or by carrier name. You must be a public
network SMDS provider able to access the ICI configuration database on
the Primary Core in order to run this report.
Following the title and time stamp heading of the Configured Prefixes Report, an
entry will appear indicating the name of the StarKeeper II NMS that was queried.
This is the Primary Core. The entry will also indicate whether the data retrieval
succeeded. It will say "View Succeeded:" or "View Failed:", followed by the name
of the Primary Core. This is followed by a display of the parameters you selected
while requesting the report, followed by the body of the report.
Special Considerations
■
Upon submitting an update, the form displays a notice reminding you to run
the ici_dl program on the Primary Core, in order to download your ICI
configuration data to the BNS-2000 nodes in your ICI network. This step
can be deferred until you have configured the foundation of your ICI
network (carriers, address prefixes, group addresses, and nodes).
■
If you are deleting an address prefix that is used in a group address for
which your company is the Group Address Agent, the form will display a
Continue
warning notice. You can either
the update or Cancel it. If
you continue the update, the address prefix will be deleted but the group
address will not be deleted.
■
If you are deleting an address prefix that is used as the SMDS SR and SA
of one of your company's BNS-2000 nodes, the form will display a warning
Continue
notice. You can either
the update or Cancel it. If you
continue the update, the address prefix will be deleted but the SMDS SR
and SA will not be deleted. However, messages with a destination address
having the deleted prefix will be routed out of your company's network.
■
If you are deleting an address prefix that is used in a group address
assigned to one of your company's SNIs, the form will display a warning
Continue
notice. You can either
the update or Cancel it. If you
continue the update, the address prefix will be deleted but the group
address will not be deleted.
StarKeeper II NMS Graphics System Guide, R10.0, Issue 1
8-101
Using Network Builder to Configure Your Network
8-102
StarKeeper II NMS Graphics System Guide, R10.0, Issue 1
Using Network Builder to Configure Your Network
Configuring ICI Group Addresses
Use the ICI Group Address form to create a group for which your company acts as
the Group Address Agent and assign member addresses to it. The member
addresses assigned to a group with the ICI Group Address form are those
allocated outside of your company`s network. Continue to use the SNI form to
assign group membership to addresses allocated to your company's network (that
is, individual addresses on your company's SNIs).
The ICI Group Address form is partitioned into three panes: a key pane and two
data panes. The key pane contains a control that indicates the E.164 address of
the resolving group.
The data panes contain controls that allow you to specify the maximum arrival rate
into your network of post-resolved group address messages. You can enter a 60
character comment for the group. The data panes also contain a list for entering
the members of the group. You can enter up to 128 members, as any combination
of individual addresses and group addresses.
The ICI Group Address form (along with the ICI Carrier form and the ICI Prefix
form) updates ICI configuration data in a database on a StarKeeper II NMS Core
System designated as the Primary Core. The Primary Core is designated by
running the ici_primary command on that Core. You will not be able to submit an
update using the ICI Group Address form unless Network Builder is able to
access the Primary Core. After using the ICI Group Address form to update the
database on the Primary Core, run the ici_dl command on the Primary Core to
download the ICI configuration data to all of the BNS-2000 nodes in your ICI
network. This step can be deferred until you have configured the foundation of
your ICI network (carriers, address prefixes, group addresses, and nodes).
Refer to the BNS-2000 SMDS Guide for a more detailed discussion of the SMDS
service and how Network Builder is used to help configure those networks.
StarKeeper II NMS Graphics System Guide, R10.0, Issue 1
8-103
Using Network Builder to Configure Your Network
Screen 8-28.
ICI Group Addresses Configuration Form
Background Information
Use the ICI Group Address form to administer the individual and group address
members of any groups for which your company acts as the Group Address
Agent. The members you configure using the ICI Group Address form are those
members not allocated to your company within the LATA where your company
acts as the Group Address Agent. For example, if your company is a Local
Exchange Carrier, use the ICI Group Address form to configure individual and
group address members whose six-digit address prefixes are not configured in
the LATA where the group's six-digit address prefix is configured.
Continue to use the SNI form to assign those individual addresses allocated to
your company within a LATA that you wish to be members of a group for which
your company acts as the Group Address Agent.
8-104
StarKeeper II NMS Graphics System Guide, R10.0, Issue 1
Using Network Builder to Configure Your Network
Task Notes
■
You must use the ICI Prefix form to assign all six-digit address prefixes
allocated to your company in a LATA for SMDS individual and group
addresses before using the ICI Group Address form to create a group and
assign it members.
■
The E.164 address of the group must contain a six-digit prefix that is
configured for your company in the LATA where your company acts as the
Group Address Agent for this group.
■
A member address must not contain a six-digit prefix configured for your
company in the LATA where your company acts as the Group Address
Agent for this group.
ICI Group Address Parameters
Group Configuration Pane
Parameter
0
Description
Max. Arrival
Rate
Used to limit the number of messages a source sends to this group
address (See the BNS-2000 SMDS Guide.) Note that the value
specified is measured in units of thousands of L2_PDUs per second.
Threshold
This setting activates the Max. Arrival Rate field, limiting the number of
messages a source can send to this group address. (See the BNS-2000
SMDS Guide.) When Disabled, there is no limit to the number of
messages a source sends to this group address.
StarKeeper II NMS Graphics System Guide, R10.0, Issue 1
8-105
Using Network Builder to Configure Your Network
Group Members Data Pane
0
Use this data pane to assign members to a group.
Parameter
Group
Members
Description
This list displays the E.164 group addresses assigned as members of
the group.
There is a maximum of 128 combined entries between this list and the
Individual Members list.
Individual
Members
This list displays the E.164 individual addresses assigned as members
of the group.
There is a maximum of 128 combined entries between this list and the
Group Members list.
ICI Group Address Reports
In addition to the standard "Task Log" available on all Network Builder
configuration forms, several other reports are provided that will assist you in
completing ICI Group Address configuration tasks. Except for the Configuration
Report, all others provide global views of your network's group data. The reports
can be searched, printed or saved to a file.
8-106
StarKeeper II NMS Graphics System Guide, R10.0, Issue 1
Using Network Builder to Configure Your Network
The report is described and listed below:
■
Configuration Report
This report provides an alternative view of the data from the current group
record. The configuration report is shown in the following screen.
Screen 8-29.
■
ICI Group Address Configuration Report
Audit Prefixes Report
This report displays the groups for which no corresponding address prefix
is configured for your company. This will occur if the ICI Prefix form was
used to remove an address prefix assigned to a group address. If the
report is empty (i.e. the view succeeded and zero group addresses are
displayed), then you can be confident that all of the groups for which your
company acts as the Group Address Agent in a LATA contain an address
prefix configured for your company. The report is sorted by group address.
You must be a public network SMDS provider able to access the ICI
configuration database on the Primary Core in order to run this report.
Following the title and time stamp heading of the Audit Prefixes Report, an entry
will appear indicating the name of the StarKeeper II NMS that was queried. This is
the Primary Core. The entry will also indicate whether the data retrieval
succeeded. It will say "View Succeeded:" or "View Failed:", followed by the name
of the Primary Core. This is followed by a display of the report parameters,
followed by the body of the report.
StarKeeper II NMS Graphics System Guide, R10.0, Issue 1
8-107
Using Network Builder to Configure Your Network
Special Considerations
■
8-108
Upon submitting an update, the form displays a notice reminding you to run
the ici_dl program on the Primary Core, in order to download your ICI
configuration data to the BNS-2000 nodes in your ICI network. Note that
this step can be deferred until you have configured the foundation of your
ICI network (carriers, address prefixes, group addresses, and nodes).
StarKeeper II NMS Graphics System Guide, R10.0, Issue 1
Using Network Builder to Configure Your Network
Configuring Frame Relay Service
Network Builder provides complete configuration support for Frame Relay Service
via three base windows: one for M1 Frame Relay Service (FRM), one for M2
Frame Relay Service (FRM-M2), and one for configuration of PVCs (regardless of
M1 or M2). The Frame Relay item on the Network Builder Control Window’s
Configure menu provides access to a sub-menu with the following options: FRM,
FRM-M2, PVC. Choosing FRM or FRM-M2 yields a base window providing
access to a set of forms corresponding to the appropriate Frame Relay
components. For FRM: module, port (virtual), and multicast DLCI. For FRM-M2:
module, physical port, virtual port, and multicast DLCI. Choosing PVC yields a
form for configuring PVCs between any type of Frame Relay endpoints (DLCIs).
The File menu on the FRM and FRM-M2 Base Windows then give you access to
the individual forms required to access the desired Frame Relay component
configuration form. The New, Load and Delete commands on the File menu each
have sub-menus that provides access to the individual components. Choose the
desired action and element on these menus to obtain the required form.
Frame Relay components must be entered hierarchically. That is, module before
port, port before virtual port (if applicable), virtual port before DLCI/multicast
DLCI, and multicast DLCI (if used) before PVC.
Details regarding configuration of Frame Relay modules, physical and virtual
ports, multicast DLCIs and PVCs are covered in the sections that follow. Other
information regarding administration of Frame Relay service is covered in the rest
of this section.
When deleting a module, Network Builder operates hierarchically, acting as if you
requested deletes for all the ports belonging to the module and all the DLCIs
associated with the ports. When deleting a port, all multicast DLCIs and all DLCIs
associated with that particular port are deleted. When deleting a PVC, all DLCIs
associated with that PVC are deleted. A Multicast DLCI cannot be deleted if it is
administered in a PVC. A one-sided PVC could result when you delete a port or a
module which has only one of the DLCIs in a PVC.
Using Existing Configuration Data
epres is an endpoint resolution process. You need to run epres if you have
provisioned frame relay PVCs directly on nodes before the availability of the
Network Builder frame relay feature. It is run on the StarKeeper II NMS Graphics
System on which Network Builder for Frame Relay is run. It resolves two-sided as
well as one-sided (foreign ended) PVC's, according to strict rules. This resolution
is based upon an originating node id, module, slot, port and DLCI data set, in
conjunction with a user-defined PVC destination field value. This data is
configured initially on the node and passed to the StarKeeper II NMS Core
StarKeeper II NMS Graphics System Guide, R10.0, Issue 1
8-109
Using Network Builder to Configure Your Network
System database, as a result of using the skload or cfg_sync commands on the
Core System.
In order to ensure a consistent and complete view of the data (especially ensuring
the one-to-one correspondence of a PVC number to the pair of DLCIs that
comprise a particular PVC), you must be careful to execute all frame relay
configuration activities from Network Builder. If you begin all of your frame relay
configuration activities using the new Network Builder feature, you shouldn't need
to execute epres. However, if you do have data that was not provisioned by
Network Builder, you need to assign PVC numbers to the pairs of DLCIs, and that
requires epres. Once all existing DLCIs have been paired, and all additional
provisioning is performed using Network Builder, you should not have to run
epres again. If subsequent to the resolution of end points, you continue to
provision directly on nodes, even by using the pass-through capability, it will be
necessary to run epres again.
epres finds and pairs the two DLCIs in your network that belong together and
inserts all of the valid pairs into special tables in the database. It assigns a unique
PVC number to the pair, and reports all non-resolvable data.
The process is invoked from the command line, and accepts the following options/
parameters:
epres
-p
-u
-f <filename>
(Purge mode--removes old PVC's)
(Update mode--changes database
to include resolved PVCs)
(Write exception data to a
file whose name you provide)
Executing epres with no options defaults to Audit mode with exception data
appended to a file, called epres.out, in the current directory. Since the data is
appended, you will have to manage the size of the file to ensure that it doesn't
grow too large.
When running epres in Update mode, it is recommended that you combine the
Purge and Update modes. This will address the situation where a previous
execution of epres was not able to establish a two-sided PVC and created a onesided PVC instead, and you made the necessary changes for epres to be able to
resolve both sides of the PVC in the current execution. You don't need one of the
DLCIs to be associated with both a one-sided and a two-sided PVC.
Sample Output
0
When destinations cannot be resolved by epres, information similar to the
following will be provided to you for further action:
PVC DESTINATION nj/place/fr.27.2.53 does not map to any nodes.
Could not resolve pvc information for
8-110
StarKeeper II NMS Graphics System Guide, R10.0, Issue 1
Using Network Builder to Configure Your Network
NODE=4 (IMPORT)
NETWORK=() EXCHANGE=(nj) AREA=(area1)
DLCI=55
PORT=1
SLOT=49
BPLINK=0
PVC DESTINATION=(nj/place/fr.27.2.53)
+-+-+-+-+-+-+-+-+-+-+-+-+-+-+-+-+-+-+-+-+-+-+-+-+-+-+-+-+-+-+-
When destinations map to multiple nodes, information similar to the following will
be provided to you for further action:
PVC DESTINATION fr.27.2.53 maps to the following node ids.
4 (node1) 5 (nj/place/node2)
NODE=4 (IMPORT)
NETWORK=() EXCHANGE=(nj) AREA=(area1)
DLCI=55
PORT=1
SLOT=49
BPLINK=0
PVC DESTINATION=(nj/place/fr.27.2.53)
+-+-+-+-+-+-+-+-+-+-+-+-+-+-+-+-+-+-+-+-+-+-+-+-+-+-+-+-+-+-+-
You are expected to update the PVC destination fields on the nodes with complete
information so these end points can be resolved. Then run the cfg_sync
command on the appropriate StarKeeper II NMS Core System, followed by the
execution of epres. These steps should be repeated until all end points are
mapped to PVCs.
Administering Custom IDs
The Custom ID feature allows you to assign comment-like information to frame
relay entities during configuration. You may administer the labels used for these
Custom ID fields to make the fields more meaningful to you. When configuring a
frame relay module, for example, two Custom ID fields will be contained in the
"Custom ID" data pane. You can enter values into those two fields, but before
doing that, you define the labels for those (and any other) Custom ID fields using
the Administer window.
The window to define the labels can be invoked from a Frame Relay base window
by clicking on Administer.
The configuration forms for each Frame Relay component allow you to enter
information into the Custom ID fields.
The Custom ID labels generated to prompt for this information may be defined in
the Administer window. If a Custom ID label for a field is left blank, the field will
not be displayed or made available for data entry on its associated configuration
form.
StarKeeper II NMS Graphics System Guide, R10.0, Issue 1
8-111
Using Network Builder to Configure Your Network
The first two Custom ID labels are used to prompt for information when
configuring an M1 or M2 frame relay module or an M2 physical port. The factory
default labels are Customer and Location for the first two Custom ID fields.
The next three Custom IDs, in addition to the above two Custom IDs, will be used
to prompt for data when configuring an M1 frame relay port or an M2 frame relay
virtual port. The factory defaults are Contact, Circuit ID and Installation Date for
Custom IDs 3, 4, and 5.
All ten Custom IDs, including the above five, will be used to prompt for data when
configuring a frame relay PVC. Custom ID labels 6 through 10 are undefined by
default. If left undefined, these Custom ID fields will not be displayed in the PVC
configuration form or the PVC Configuration Report.
The column labeled Use To View PVCs contains ten check boxes. Each check
box is associated with the Custom ID field immediately preceding it. When a box
is checked and a Custom ID label is defined for the associated field, you will be
able to supply search criteria for this field to select PVCs to view in the PVC
Configuration Report. The factory default checks the first five boxes (the first two
enable the display of data associated with Modules, Ports, and PVCs, the next
three are associated with Ports and PVCs.). The remaining five boxes are left
unchecked by default, disabling the display of the last five fields in PVC
Configuration Reports.
A Custom ID label can be up to 20 characters in length. The value you enter in the
Custom ID field when provisioning can be up to 80 characters in length.
In order for your specifications to take effect, you must exit the Network Builder:
Configure Frame Relay Control Window and re-invoke it.
There is one set of Custom IDs per StarKeeper II NMS Core System. The Custom
IDs and settings defined and applied in this window are made available to
StarKeeper II NMS Graphics Systems from the StarKeeper II NMS Core System
database. This single set of Custom IDs is made available to all copies of Network
Builder associated with the same StarKeeper II NMS Core System. Therefore
changes made at one StarKeeper II NMS Graphics System will affect what is
displayed at other Graphics Systems the next time the Network Builder:
Configure Frame Relay window is invoked.
Value Inheritance
0
When the Value Inheritance feature is enabled, it automatically copies your
Custom IDs from a previously defined module or M2 physical port (two fields) to
the New Port Configuration form, or from a previously defined (virtual) port (five
8-112
StarKeeper II NMS Graphics System Guide, R10.0, Issue 1
Using Network Builder to Configure Your Network
fields) to the New PVC Configuration form. You may still modify this data when
manipulating the corresponding "New" form.
The Value Inheritance feature is only available when creating a new Port or a
new PVC. "Value Inheritance" is enabled by default.
Example
0
To illustrate the Custom ID feature, consider an M1 Frame Relay configuration
session in which you label all ten Custom IDs as L1 through L10. When
configuring a new module, Custom IDs one and two, with labels L1 and L2 are
available in the Custom IDs data pane. In this example, you enter the value
Value1 for L1 and Value2 for L2. When you configure a new port that belongs to
the module that you configured this way and choose to display the Custom IDs
data pane for that form, you will see five Custom IDs, with Custom ID one having
label L1 and value Value1 and Custom ID two having label L2 and value Value2.
If you had chosen to disable Value Inheritance, the labels L1 and L2 would still
appear in the new port form Custom IDs data pane, but there would be no values
associated with either of them. You could enter different values for these Custom
IDs than the values that you entered when configuring the module, but the labels
would still be L1 and L2 for these first two Custom IDs.
With Value Inheritance enabled, if you then entered Value3 for the third Custom
ID whose label is L3, and Value4 for the fourth one whose label is L4, but you
chose to enter nothing for the fifth Custom ID, whose label is L5, you would see all
five Custom IDs when you entered a new PVC where one side (DLCI) belonged to
the port that was configured this way. You would then be able to enter values for
Custom IDs six through ten whose labels are L6 through L10.
If you decide that you want to change a label for a Custom ID, you can invoke the
Administer window again, make the change, and click Apply . As mentioned
before, you would have to quit the frame relay configuration task in Network
Builder and invoke it again for the change to take effect. When you change the
label of the Custom ID, any values that were previously entered are completely
unaffected. So, if you change L2 to Label2 the value Value2 would still be stored.
If you clear the label field for a Custom ID, the effect is to delete the label. In delete
cases, Custom IDs do not get adjusted to reflect the deletion. In other words, if
you delete the first Custom ID, the label and value for the second one remain
associated with the second one and do not move to the first one.
StarKeeper II NMS Graphics System Guide, R10.0, Issue 1
8-113
Using Network Builder to Configure Your Network
Reports
Frame Relay Configuration Reports
0
Depending on what entity has been activated, the View button will provide you
with choices for getting additional data on frame relay resources as well as seeing
the task log. In general, this capability provides reports of information that was
loaded into forms in a different format so that you can save the data, or print the
data. It also provides reports for those components in the hierarchy that have
already been configured.
If the current loaded form is for an M1 port or M2 virtual port on a ChT1 or ChE1
module, a report choice for timeslot assignment will be available showing the
timeslots associated with that port or virtual port.
If the current loaded form is for a multicast DLCI, the Multicast DLCI Report will
show data for all multicast DLCIs associated with the ports to which this DLCI
belongs. Similarly, the Time Slot Assignments Report will show data for these time
slots, the Virtual Port Configuration Report will show data for those virtual ports (if
applicable), the Port Configuration Report will show data for those ports, and the
Module Configuration Report will show data for those modules.
PVC Configuration Report
0
The PVC Configuration Report sub-menu item is available from the View menu on
a PVC Configuration form. Clicking on the PVC Configuration Report menu item
gives you access to three different types of PVC configuration reports. Clicking on
the first two items brings up a popup command window.
The first menu item is View By Criteria.... When you click on this item, the View
By Criteria: PVC Configuration Report command window pops up. It supports
specifying criteria to generate a report containing one or more PVC records.
At the top of the window is the criteria data pane. This data pane is split into two
panes, labeled End 1 and End 2 each containing the Node Name, Module
Address, Port Number, Virtual Port Number, DLCI and Custom IDs controls. Any
administered Custom IDs which are specified in the Administer window as being
used for this purpose will appear. See the section on Administering Custom IDs.
All fields have Choose buttons associated with them.
All numeric fields accept single entries or ranges. All text fields accept text entries
which may contain the following wildcards in place of other characters in the
8-114
StarKeeper II NMS Graphics System Guide, R10.0, Issue 1
Using Network Builder to Configure Your Network
string. Both End 1 and End 2 criteria sets have an associated Clear button.
*
matches zero or more characters
?
matches any single character
[...]
matches any one of the enclosed characters or character ranges, e.g. [acf]
means a, or c or f; [a-f] means a, or b, or c, or d, or e, or f. If a caret (^) is
the first character within the brackets, matches occur for characters not
listed, e.g. [^abc] matches any character that is not a, b, or c.
Clicking on that button for one of the ends will clear all the data in the fields for that
end.
Selecting the OK command button at the bottom of the window generates the
report. A Full or Brief report may be selected using the Report Type option
located above the OK button.
The Full report contains all configured data for both DLCIs in each PVC
requested. The Brief report contains only Node Name, Module Address, Port
Number, Virtual Port (if applicable), DLCI, Group, PVC Service Address, and
Custom IDs (if administered).
The second menu item is View By PVC Number.... When you click on this item,
the View By PVC Number: PVC Configuration Report command window pops
up. It supports the specification of a single PVC number or a range of PVC
numbers for generation of a report containing one or more PVC records.
The PVC Number field at the top of the window will accept a single PVC number,
or a range of PVC numbers, such as "1-10" for PVC numbers 1 to 10. The
resulting report will contain PVC records matching the number(s) specified.
Selecting the last menu item, Full List..., gives you a list of all PVCs with Node
Name, Module, Port, Virtual Port (if applicable), and DLCI for each end of each
PVC.
Special Considerations
Database Values
0
If you use the isql command to view field values in the database, please
recognize that not all field values will be initialized the same way.
The values for some fields are initialized to "-1" in the database. In most cases, if
they are unused, they will retain that value. The values of some fields in the
database are changed based on conditions of other fields or other characteristics,
StarKeeper II NMS Graphics System Guide, R10.0, Issue 1
8-115
Using Network Builder to Configure Your Network
such as module type, and might not retain the initialized value. Other fields are
initialized to field-dependent default values.
0
File Management
Several operations involve the execution of complex database queries that are
executed on one or more Core Systems and result in a file that is created in
/usr/tmp on the Graphics System or Co-resident system. The size of the file can
be large, depending on the nature of the query and the size of your database. The
file is not automatically cleaned up, unless you choose to use the disk cleaner
capability to purge that directory of old files periodically. See the documentation in
the Using the Workstation Administration Application chapter for a
description of the disk cleaner capability.
0
Simultaneous Provisioning
Simultaneous database provisioning operations from two different Network
Builder sessions can yield unpredictable results. If you have multiple Network
Builder sessions in operation simultaneously, you will have to coordinate the
database operations (additions, changes, and/or deletions) so that one set of
operations does not negate or conflict with another. This applies to all Network
Builder provisioning capabilities.
One example deals with submitting a transaction and then submitting a second
transaction before the first one completes. Consider adding two new ports or
PVCs. You submit the first and then want to re-use most of the data to submit the
second one with minor differences, such as the port number, etc. Before the first
transaction completes successfully, you submit the second one. The data you see
in the second window could be different from what would appear if the first submit
had completed (e.g. timeslots used by the first transaction would not be grayed
out yet). The safest approach is to allow the first transaction to complete
successfully before re-using its data.
General Trouble Recovery Procedure
The following steps can be taken to handle cases where one or more of the
operations within a submitted task does not complete successfully. If the update
(New, Load, Delete) attempt fails:
8-116
1.
Make sure the task has stopped.
2.
Cancel the task.
3.
Fix the problem (based on the information displayed and contained in the
task log message).
StarKeeper II NMS Graphics System Guide, R10.0, Issue 1
Using Network Builder to Configure Your Network
This step might involve using pass-through commands to the node
controller to delete resources and using ISQL commands on the
StarKeeper II NMS Core System to clean up partially submitted data.
4.
Re-submit the task.
Configuring FRM and FRM-M2 Frame Relay
Modules
This section provides details on M1 and M2 Frame Relay module configuration.
Frame Relay modules must be configured before associated ports, virtual ports (if
applicable), multicast DLCIs and PVCs can be configured. Please refer to the
material presented earlier in this section for other information that may affect the
Frame Relay module configuration task.
StarKeeper II NMS Graphics System Guide, R10.0, Issue 1
8-117
Using Network Builder to Configure Your Network
Screen 8-30.
M1 Frame Relay Module Configuration Form (cht1)
M1 Frame Relay Module Parameters
Parameter
Description
Download
Server
This field specifies the source of the software to be downloaded to the
module. It must be a valid service address or the local controller.
E-Bits
This control is used to indicate whether E-bits are to be used or not by
this module.
E-bits are used to indicate a received errored sub-multiframe at the far
end (i.e., code violations). E-bits are also referred to as REBE (remote
end block error) bits. The E-bits are bit 1 of frames 13 and 15 of the
CRC4 multiframe structure. If E-Bits are enabled, the E-bits will be
used to report far-end code violations. Valid for che1 only.
8-118
StarKeeper II NMS Graphics System Guide, R10.0, Issue 1
Using Network Builder to Configure Your Network
Parameter
Equalization
Description
This field specifies the distance, in feet, to the DSX-1 interface. This
information is required by the Frame Relay module to ensure that the
incoming DS1 signal is properly preserved.
Use the option menu to obtain a list of valid entries. Valid for cht1 only.
Extended
Measurements
This setting specifies whether collection of additional DLCI
measurements is Enabled or Disabled. This feature is valid for certain
node releases and cannot be enabled if there are more than 300 DLCIs
on this module.
Framing
Format
This control is used to specify the desired framing format for che1 and
cht1 service types. When there is a need to provide additional
protection for frame alignment, and/or when there is a need for an
enhanced error monitoring capability crc4-cept should be selected for
che1 module types.
I/O Board
This setting specifies the type of I/O board to be used for che1 service.
Both a 120-ohm symmetrical pair and a 75-ohm coaxial connection are
supported.
Japanese
Remote Frame
Alarm (Yellow)
This setting specifies whether the Frame Relay module will recognize
and indicate a yellow alarm defined by the DS1 standard implemented
in Japan. Valid for cht1 only.
Line Coding
This setting specifies the line coding technique - ami or b8zs (Bipolar
Eight Zero Substitution) - to use for the DS1 signal. See Special
Considerations, below. Valid for cht1 only.
Out-of-band
Loopback Code
This setting specifies whether the Frame Relay module is to recognize
and respond to out-of-band loopback codes. When set to Recognized,
the signal received is transmitted back.
If the module is configured with an external CSU that recognizes these
codes, this parameter should be set to Not Recognized. Valid for cht1
only.
Si Bit Value
This setting specifies whether the Si bit value is 0 or 1. If the Framing
Format is cept, the first bit of timeslot 0 can be configured to be set to
1 or 0. Setting this bit to 1 indicates the Si bit is disabled, and
conversely setting it to 0 indicates the Si bit is enabled. This bit is
reserved for international use. Valid for cht1 only.
Software
Version
This field is a string of 1 to 14 characters specifying the software
version file name to be downloaded to the module.
If Download Server is controller, standard should be entered as the
file name. If Download Server is not controller, enter the file name of
a valid software release.
Timing
This setting specifies the source used to synchronize the signal. The
Frame Relay module can be configured to use an external timing
source (external), internal timing source (internal), or timing derived
from the facility (loop).
StarKeeper II NMS Graphics System Guide, R10.0, Issue 1
8-119
Using Network Builder to Configure Your Network
Parameter
Upload
Description
This setting indicates when an upload should occur: never, after a fault,
or before a download.
This control appears only when an upload server has been specified.
Upload Server
This field specifies the service address of a host that is to receive the
module memory dump prior to the Control Computer initiating a
download or after a fault.
Special Considerations
0
Line Coding
0
The line coding technique dictates how the DS1 equipment electrically encodes
the data signal. b8zs is a data encoding technique that guarantees the DS1 signal
will maintain a pulse density to allow DS1 equipment to synchronize properly on
the DS1 signal. Use of b8zs requires that all connected DS1 equipment support
b8zs. ami can be used if the equipment does not support b8zs. However, ami,
unlike b8zs, does not guarantee that the DS1 signal will maintain the minimum
pulse density required by DS1 equipment.
For the che1 service type, the line coding technique is automatically set to hdb3
coding. This is a bipolar code with a specific zero suppression scheme where no
more than three consecutive zeros are allowed to occur. This data encoding
technique guarantees the signal will maintain a pulse density to allow E1
equipment to properly synchronize.
8-120
StarKeeper II NMS Graphics System Guide, R10.0, Issue 1
Using Network Builder to Configure Your Network
0
Screen 8-31.
M2 Frame Relay Module Configuration Form (cht1)
M2 Frame Relay Module Parameters
Parameter
Description
Download
Server
This field specifies the source of the software to be downloaded to the
module. It must be a valid service address or the local controller.
I/O Board
This setting specifies the type of I/O board to be used for che1 service.
Both a 120-ohm symmetrical pair and a 75-ohm coaxial connection are
supported.
Software
Version
This field is a string of 1 to 14 characters specifying the software
version file name to be downloaded to the module.
If Download Server is controller, standard should be entered as the
file name. If Download Server is not controller, enter the file name of
a valid software release.
StarKeeper II NMS Graphics System Guide, R10.0, Issue 1
8-121
Using Network Builder to Configure Your Network
Configuring Frame Relay Ports
This section provides details on Frame Relay port configuration. Frame Relay
ports must be configured before associated DLCIs and PVCs can be configured.
In addition, M2 physical ports must be configured before associated M2 virtual
ports can be configured. The module on which a port resides must be configured
prior to configuring the port. Please refer to the material presented earlier in this
section for other information that may affect the Frame Relay port configuration
task.
There are different types of ports to be configured depending on the type of Frame
Relay service you are provisioning. M1 Frame Relay service supports a single
port level referred to as port. M2 service supports two levels: physical and virtual
ports. For a discussion of the components and their hierarchy refer to the section
Configuring Frame Relay Service.
8-122
StarKeeper II NMS Graphics System Guide, R10.0, Issue 1
Using Network Builder to Configure Your Network
Screen 8-32.
M1 Frame Relay Port Configuration Form (che1)
M1 Frame Relay Port Parameters
0
This section describes the M1 Frame Relay port parameters.
Parameter
Description
Flow Control of
Device
This setting specifies what type of flow control to use when PVC
Management Type is set to LMI. If set to Xon_Xoff, as the frame relay
module detects that a PVC is about to enter a congested state, it will
issue a status message to request that the local device cease
transmitting frames on the PVC. The module will issue another
asynchronous status message when it determines that the local device
may resume transmitting frames on the PVC.
StarKeeper II NMS Graphics System Guide, R10.0, Issue 1
8-123
Using Network Builder to Configure Your Network
Parameter
Full Status
Polling
Counter
Link Integrity
Error
Threshold
Description
This field specifies the frequency of polls requesting full status data.
Unlike the Link Integrity Polling Timer, which is measured in
milliseconds, this value is a number that specifies how frequently a
polling cycle will include requests for the full status data. For instance, if
the Full Status Polling Counter is set to 10, every tenth poll will
request the full status data while the remainder of the polls will be
limited to requests for the link integrity data.
This field specifies the number of errored events that can occur before
a link problem is declared. An errored event is the non-receipt of a
status poll or the receipt of a status poll containing an invalid sequence
number.
The value chosen for the Link Integrity Error Threshold cannot
exceed the value chosen for the Monitored Events Count.
Link Integrity
Polling Timer
This field specifies the frequency, in seconds, of link integrity status
polls. The selection of a value for this timer should be coordinated with
the value chosen for the connected access device.
Max.
Aggregate CIR
This field specifies a threshold for the sum of the Committed
Information Rates (CIRs) for calls being established on the port.
Valid entries are those listed next to the field label, and are dynamically
calculated based on other parameter settings. If a CIR is not being
used, the value 0 should be entered, which means that any call attempt
where the remote end of the PVC requires a non-zero CIR will be
rejected.
In general, any call attempt that exceeds the specified threshold will be
rejected. The threshold is based on the sum of the CIRs required for
data transmitted from remote devices. The aggregate CIR may be up
to ten times the port capacity, in bits per second (bps).
Allowed values may be input as a percentage of the line speed or as
the actual bps. Choose the desired setting to the right of the field to
indicate the units you are using.
Maximum
Frame Size
This field is a number from 262 to 4096 that specifies the maximum
allowable frame size (in bytes) that the port can receive.
Minimum
Interframe
Delay
This field is a number from 1 to 10000 specifying the minimum delay (in
microseconds) between the transmission of frames from the port to the
access device. The default value of 1 results in no added delay.
This delay, which is produced by transmitting flag characters, is
required by access devices that cannot process frames at the
maximum line rate.
Monitored
Events Count
8-124
This field specifies a value that is used with the Link Integrity Error
Threshold to determine link problems. A link problem will be declared
when the number of errors in the count of monitored events exceeds
the Link Integrity Error Threshold. The default value for Monitored
Events Count field is the value of Link Integrity Error Threshold.
StarKeeper II NMS Graphics System Guide, R10.0, Issue 1
Using Network Builder to Configure Your Network
Parameter
Description
Polling
Verification
Timer
This field specifies the maximum number of seconds the port allows
between the receipt of status polls. The expiration of this timer is
considered to be an errored event as defined in the Link Integrity
Error Threshold. The selection of a value for this timer must be
coordinated with the value chosen for the connected access device.
PVC
Management
Poll Direction
This setting specifies the role the port will perform in a bi-directional
PVC management scheme. The port, which will use the PVC
management procedure selected for the PVC Management Type
parameter, can be configured to respond to status enquiries (Receive),
initiate status enquiries (Send), or perform both functions (Both).
PVC
Management
Type
This setting specifies the technique used to manage the interface
between the access device and the Frame Relay port.
Rate
This setting specifies what rate - 56KxN or 64KxN, for clear channel
operation - is to be used for the timeslots associated with this virtual
port.
Each DS1 frame contains 24, 8-bit timeslots. 56K coding forces one bit
to be set to high for each timeslot in order to maintain the minimum
pulse density requirements of some DS1 equipment. The remaining
seven bits are used for user data, which provides 56 Kbps per timeslot.
Clear channel operation uses the entire eight bits for user data, which
yields 64 Kbps per timeslot.
Time Slot
Allocation
This setting allows you to choose the desired timeslots from those
remaining on this module. Inactive slots have already been assigned;
highlighted slots are assigned to this port.
Each Frame Relay port may be associated with one or more of the 24
DS1 timeslots for cht1 service, or one or more of the 31 E1 timeslots
for che1 service, depending on the required port speed.
Special Considerations
0
Flow Control of Device
0
If Flow Control of Device is set to "Xon_Xoff", as the Frame Relay module
detects that a PVC is about to enter a congested state, it will generate an
asynchronous status message (the R-bit will be set) to request that the
local device cease transmitting frames on the PVC. The module will
generate another asynchronous status message (the R-bit will be reset)
when it determines that the local device may resume transmitting frames
on the PVC.
StarKeeper II NMS Graphics System Guide, R10.0, Issue 1
8-125
Using Network Builder to Configure Your Network
PVC Management Type
0
Each port can be independently configured to use either the "ANSI",
"CCITT", "LMI," or “ITU-T” PVC management procedures, or they can be
configured as "Auto-Set", which causes the port to adopt the technique
being used by the access device. The option "None" is provided to disable
PVC management procedures on the port.
PVC management procedures provide the ability to verify the integrity of
the link connecting the access device to the port and report the status of
individual PVCs. The module verifies the link integrity by monitoring a
series of events and defining the maximum allowable errors that may occur
in a consecutive sequence of these events. The events being monitored
are the receipt, or nonreceipt, of status enquiries from the access device.
An errored event is the nonreceipt of a "Status Enquiry" message, or invalid
contents of the status message, such as an invalid sequence number. This
information is obtained via status polling and it may be optionally initiated
by the module, which supports bi-directional PVC management.
Related PVC management configuration parameters include defining the
number of events to monitor, error threshold, and timers for receiving and
generating status polls.
Maximum Frame Size
0
The maximum allowable frame size includes the information field of a
frame, but does not include the bytes the frame relay protocol uses in the
frame header. If a port receives a frame from an attached device that is
larger than the specified value, it is discarded and an alarm is generated.
The alarm is thresholded at one occurrence per five minutes. The
maximum frame size that a port can receive should be greater than or
equal to the frame size that the attached device transmits.
8-126
StarKeeper II NMS Graphics System Guide, R10.0, Issue 1
Using Network Builder to Configure Your Network
Network Builder: Configure M2 Frame Relay Physical Port
Help
File.....View.....Administer
Node Name: blab/node43/MR_BIG
Module Address: 50
Port Number: 4
Service Type: cht1
Show Data: Custom IDs
Port
Comment: None
Framing Format
Line Coding
cept
crc4-cept
ami
d4
esf
b8zs
Equalization: 0-131
feet
Out-of-Band Loopback Code
Recognized
Not Recognized
Japanese Remote Frame Alarm (Yellow)
Enabled
Disabled
Screen 8-33.
Timing
Stratum Clock
Loop
M2 Frame Relay Physical Port Configuration Form (cht1)
StarKeeper II NMS Graphics System Guide, R10.0, Issue 1
8-127
Using Network Builder to Configure Your Network
M2 Frame Relay Physical Port Parameters
0
This section describes the M2 Frame Relay physical port parameters.
Parameter
E-Bits
Description
This control is used to indicate whether E-bits are to be used or not by
this module.
E-bits are used to indicate a received errored sub-multiframe at the far
end (i.e., code violations). E-bits are also referred to as REBE (remote
end block error) bits. The E-bits are bit 1 of frames 13 and 15 of the
CRC4 multiframe structure. If E-Bits are enabled, the E-bits will be
used to report far-end code violations. Valid for che1 only.
Equalization
This field specifies the distance, in feet, to the DSX-1 interface. This
information is required by the Frame Relay module to ensure that the
incoming DS1 signal is properly preserved.
Use the option menu to obtain a list of valid entries. Valid for cht1 only.
Extended
Measurements
This setting specifies whether collection of additional DLCI
measurements is Enabled or Disabled. This feature cannot be
enabled if there are more than 300 DLCIs on this module.
Framing
Format
This control is used to specify the desired framing format for che1 and
cht1 service types. When there is a need to provide additional
protection for frame alignment, and/or when there is a need for an
enhanced error monitoring capability crc4-cept should be selected for
che1 module types.
Japanese
Remote Frame
Alarm (Yellow)
This setting specifies whether the Frame Relay module will recognize
and indicate a yellow alarm defined by the DS1 standard implemented
in Japan. Valid for cht1 only.
Line Coding
This setting specifies the line coding technique - ami or b8zs (Bipolar
Eight Zero Substitution) - to use for the DS1 signal. See Special
Considerations, below. Valid for cht1 only.
Out-of-band
Loopback Code
This setting specifies whether the Frame Relay physical port is to
recognize and respond to out-of-band loopback codes. When set to
Recognized, the signal received is transmitted back.
If the module is configured with an external CSU that recognizes these
codes, this parameter should be set to Not Recognized. Valid for cht1
only.
8-128
Si Bit Value
This setting specifies whether the Si bit value is 0 or 1. If the Framing
Format is cept, the first bit of timeslot 0 can be configured to be set to
1 or 0. Setting this bit to 1 indicates the Si bit is disabled, and
conversely setting it to 0 indicates the Si bit is enabled. This bit is
reserved for international use. Valid for cht1 only.
Timing
This setting specifies the source used to synchronize the signal. The
Frame Relay module can be configured to use the Stratum clock
(Stratum Clock) as the timing source, or timing derived from the
facility (loop).
StarKeeper II NMS Graphics System Guide, R10.0, Issue 1
Using Network Builder to Configure Your Network
Special Considerations
0
Line Coding
0
The line coding technique dictates how the DS1 equipment electrically encodes
the data signal. b8zs is a data encoding technique that guarantees the DS1 signal
will maintain a pulse density to allow DS1 equipment to synchronize properly on
the DS1 signal. Use of b8zs requires that all connected DS1 equipment support
b8zs. ami can be used if the equipment does not support b8zs. However, ami,
unlike b8zs, does not guarantee that the DS1 signal will maintain the minimum
pulse density required by DS1 equipment.
For the che1 service type, the line coding technique is automatically set to hdb3
coding. This is a bipolar code with a specific zero suppression scheme where no
more than three consecutive zeros are allowed to occur. This data encoding
technique guarantees the signal will maintain a pulse density to allow E1
equipment to properly synchronize.
StarKeeper II NMS Graphics System Guide, R10.0, Issue 1
8-129
Using Network Builder to Configure Your Network
Screen 8-34.
8-130
M2 Frame Relay Virtual Port Configuration Form (cht1)
StarKeeper II NMS Graphics System Guide, R10.0, Issue 1
Using Network Builder to Configure Your Network
M2 Frame Relay Virtual Port Parameters
0
This section describes the FRM-M2 virtual port parameters.
Parameter
Description
Address Field
Format
This field specifies the address field (DLCI) format in octet units. The
minimum (default) length of the address field is two octets. This can be
extended to three or four octets to support a larger DLCI address range
at the user-network interface or the network-network interface (based
on bilateral agreement). The value set here will affect the range of valid
DLCIs that can be assigned to this port.
Flow Control of
Device
This setting specifies what type of flow control to use when PVC
Management Type is set to LMI. If set to Xon_Xoff, as the frame relay
module detects that a PVC is about to enter a congested state, it will
issue a status message to request that the local device cease
transmitting frames on the PVC. The module will issue another
asynchronous status message when it determines that the local device
may resume transmitting frames on the PVC.
Full Status
Polling
Counter
This field specifies the frequency of polls requesting full status data.
Unlike the Link Integrity Polling Timer, which is measured in
milliseconds, this value is a number that specifies how frequently a
polling cycle will include requests for the full status data. For instance, if
the Full Status Polling Counter is set to 10, every tenth poll will
request the full status data while the remainder of the polls will be
limited to requests for the link integrity data.
Link Integrity
Error
Threshold
This field specifies the number of errored events that can occur before
a link problem is declared. An errored event is the non-receipt of a
status poll or the receipt of a status poll containing an invalid sequence
number.
The value chosen for the Link Integrity Error Threshold cannot
exceed the value chosen for the Monitored Events Count.
Link Integrity
Polling Timer
This field specifies the frequency, in seconds, of link integrity status
polls. The selection of a value for this timer should be coordinated with
the value chosen for the connected access device.
Max.
Aggregate CIR
This field specifies a threshold for the sum of the CIRs for calls being
established on the port. Valid entries are those listed next to the field
label, and are dynamically calculated based on other parameter
settings. If a CIR is not being used, the value 0 should be entered,
which means that any call attempt where the remote end of the PVC
requires a non-zero CIR will be rejected.
In general, any call attempt that exceeds the specified threshold will be
rejected. The threshold is based on the sum of the CIRs required for
data transmitted from remote devices. The aggregate CIR may be up
to ten times the port capacity, in bits per second (bps).
Allowed values may be input as a percentage of the line speed or as
the actual bps. Choose the desired setting to the right of the field to
indicate the units you are using.
StarKeeper II NMS Graphics System Guide, R10.0, Issue 1
8-131
Using Network Builder to Configure Your Network
Parameter
Description
Maximum
Frame Size
This field is a number from 262 to 4096 that specifies the maximum
allowable frame size (in bytes) that the port can receive.
Minimum
Interframe
Delay
This field is a number from 1 to 10000 specifying the minimum delay (in
microseconds) between the transmission of frames from the port to the
access device. The default value of 1 results in no added delay.
This delay, which is produced by transmitting flag characters, is
required by access devices that cannot process frames at the
maximum line rate.
Monitored
Events Count
This field specifies a value that is used with the Link Integrity Error
Threshold to determine link problems. A link problem will be declared
when the number of errors in the count of monitored events exceeds
the Link Integrity Error Threshold. The default value for Monitored
Events Count field is the value of Link Integrity Error Threshold.
PVC
Management
Poll Direction
This setting specifies the role the port will perform in a bi-directional
PVC management scheme. The port, which will use the PVC
management procedure selected for the PVC Management Type
parameter, can be configured to respond to status enquiries (Receive),
initiate status enquiries (Send), or perform both functions (Both).
PVC
Management
Type
This setting specifies the technique used to manage the interface
between the access device and the Frame Relay virtual port.
Polling
Verification
Timer
This field specifies the maximum number of seconds the port allows
between the receipt of status polls. The expiration of this timer is
considered to be an errored event as defined in the Link Integrity
Error Threshold. The selection of a value for this timer must be
coordinated with the value chosen for the connected access device.
Rate
This setting specifies what rate - 56KxN or 64KxN, for clear channel
operation - is to be used for the timeslots associated with this virtual
port.
Each DS1 frame contains 24, 8-bit timeslots. 56K coding forces one bit
to be set to high for each timeslot in order to maintain the minimum
pulse density requirements of some DS1 equipment. The remaining
seven bits are used for user data, which provides 56 Kbps per timeslot.
Clear channel operation uses the entire eight bits for user data, which
yields 64 Kbps per timeslot.
Time Slot
Allocation
This setting allows you to choose the desired timeslots from those
remaining on this module. Inactive slots have already been assigned;
highlighted slots are assigned to this port.
Each Frame Relay port may be associated with one or more of the 24
DS1 timeslots for cht1 service, or one or more of the 31 E1 timeslots
for che1 service, depending on the required port speed.
8-132
StarKeeper II NMS Graphics System Guide, R10.0, Issue 1
Using Network Builder to Configure Your Network
Special Considerations
0
Flow Control of Device
0
If Flow Control of Device is set to "Xon_Xoff", as the Frame Relay module
detects that a PVC is about to enter a congested state, it will generate an
asynchronous status message (the R-bit will be set) to request that the
local device cease transmitting frames on the PVC. The module will
generate another asynchronous status message (the R-bit will be reset)
when it determines that the local device may resume transmitting frames
on the PVC.
PVC Management Type
0
Each virtual port can be independently configured to use either the "ANSI",
"ITU-T", or "LMI" PVC management procedures, or they can be configured
as "Auto-Set", which causes the virtual port to adopt the technique being
used by the access device. The option "None" is provided to disable PVC
management procedures on the virtual port.
PVC management procedures provide the ability to verify the integrity of
the link connecting the access device to the virtual port and report the
status of individual PVCs. The module verifies the link integrity by
monitoring a series of events and defining the maximum allowable errors
that may occur in a consecutive sequence of these events. The events
being monitored are the receipt, or nonreceipt, of status enquiries from the
access device.
An errored event is the nonreceipt of a "Status Enquiry" message, or invalid
contents of the status message, such as an invalid sequence number. This
information is obtained via status polling and it may be optionally initiated
by the module, which supports bi-directional PVC management.
Related PVC management configuration parameters include defining the
number of events to monitor, error threshold, and timers for receiving and
generating status polls.
Maximum Frame Size
0
The maximum allowable frame size includes the information field of a
frame, but does not include the bytes the frame relay protocol uses in the
frame header. If a virtual port receives a frame from an attached device that
is larger than the specified value, it is discarded and an alarm is generated.
The alarm is thresholded at one occurrence per five minutes. The
maximum frame size that a virtual port can receive should be greater than
or equal to the frame size that the attached device transmits.
StarKeeper II NMS Graphics System Guide, R10.0, Issue 1
8-133
Using Network Builder to Configure Your Network
Configuring Frame Relay Multicast DLCIs
A PVC DLCI may be configured (using the PVC configuration form) to belong to a
specified multicast DLCI group. When data arrives for a multicast DLCI it will be
transmitted over all the DLCIs belonging to that multicast DLCI's group. Use of
multicast DLCIs is optional, but they must be configured before they can be
assigned to PVC DLCIs. This section applies to both M1 and M2 service.
Screen 8-35.
Frame Relay Multicast DLCI Configuration Form
Frame Relay MC DLCI Parameters
Parameter
Service Type
0
Description
This field specifies whether the DLCI is a one-way or bi-directional multicast
DLCI.
A one-way multicast DLCI allows the access devices to transmit frames to
multiple endpoints; each endpoint receives frames as if they were transmitted
over the PVC to that endpoint. A one-way multicast DLCI may be used only for
the transmission of frames from the access device to the Frame Relay
module; frames are never transmitted by the module on a one-way multicast
DLCI.
A bi-directional multicast DLCI allows access devices to transmit and receive
frames from multiple endpoints. This type of multicast DLCI may be used to
support the Frame Relay Forum's two-way and n-way types of service. The
fundamental difference between one-way and bi-directional multicast is that
frames are transmitted and received over multicast DLCIs in the bi-directional
case, while they are transmitted over multicast DLCIs and received through
PVC DLCIs in the one-way service.
Status Info. in
Polling Data
8-134
This field specifies whether the Frame Relay module response to full status
requests should include a PVC status message for each multicast DLCI.
StarKeeper II NMS Graphics System Guide, R10.0, Issue 1
Using Network Builder to Configure Your Network
Configuring Frame Relay PVCs
This section provides details on Frame Relay PVC configuration. The module and
ports and virtual ports (if applicable) on which the two ends of a PVC terminate
must be configured prior to configuring the PVC. Also, any multicast DLCIs to be
assigned to a PVC must be configured first. Please refer to the material presented
earlier in this section for other information that may affect the Frame Relay PVC
configuration task.
PVC configuration is supported by a form which accepts data for both DLCIs
defining the two ends of the PVC. This form applies only to DLCIs with a service
type "PVC" (multicast DLCIs are configured via a separate form).
0
Task Notes
■
Loading a PVC
PVCs can be loaded in either of two ways: By PVC Number or By Address.
Loading by address requires complete specification of at least one
endpoint of the PVC; loading by number requires entry of the PVC Number
that was assigned during "New" configuration. The PVC Configuration
Report assists in finding desired PVCs and determining their PVC
numbers, based on identifiers that you can provide.
■
Getting the Next Available PVC Number
The PVC Number field has a button associated with it labeled Next
Available which will enter the next available PVC number into the field.
“Next Available” is defined as the number following the highest number
used. As a result, any unused numbers that are lower than the highest in
use will not be provided by this button. You may manually enter a number of
your choice at any time; follow the entry by the Enter key to get
immediate confirmation of the availability of that number. New numbers are
validated against committed and pending (but not proposed) transactions.
■
Group and Service Address Lists
The group name choose list will initially show local 2-way groups. A
Configure button in the group name choose list window is provided for you
to do group name configuration.
A service address choose list with a Configure button is provided for you
to choose a local service address or configure a new service address. The
physical address portion of the other end (module.port.dlci or
module.port.virtualport.dlci) is appended for an originating DLCI of a PVC
before entry into the field when a service address is chosen or entered. You
will have to enter two-level or three-level addresses manually, since only
local service addresses are provided in the choose list.
■
Multicast DLCI List
A multicasting group id choose list with both one-way and bi-directional
multicast DLCIs is provided. The bi-directional multicast DLCI on the
StarKeeper II NMS Graphics System Guide, R10.0, Issue 1
8-135
Using Network Builder to Configure Your Network
scrolling list will have " [B] " appended to the DLCI number. Up to four
multicast DLCIs may be selected. No more then one bi-directional multicast
DLCI may be selected.
■
8-136
One-sided PVCs
Configuration of one-sided PVCs (that is, a single PVC DLCI) is supported.
This is to accommodate a variety of scenarios:
■
PVCs at the edge of the monitored network
■
one-sided PVCs resulting from erroneous deletion at a console
■
one-sided PVCs resulting from a hierarchical delete of a module or
port
■
one-sided PVCs resulting from initial migration of incomplete node
data (see Using Existing Configuration Data earlier in this
section).
■
Changing a PVC Number
The PVC number of existing PVCs can be changed as easily as any other
field on the PVC form. Simply load the PVC, change the PVC number, and
then resubmit the PVC form.
■
Multiple Originating DLCIs
Network Builder will not allow multiple originating DLCIs to connect to a
single receiving DLCI.
■
Transforming One-Sided PVCs
If you have a one-sided PVC and want to make it a two-sided PVC, you
have to delete the PVC and re-enter the data.
StarKeeper II NMS Graphics System Guide, R10.0, Issue 1
Using Network Builder to Configure Your Network
Screen 8-36.
Frame Relay PVC Configuration Form (PVC Pane)
Frame Relay PVC Parameters
Parameter
Description
CIR From Local
This field, if enabled, specifies the CIR for data transmitted on the PVC
from the local device through the network via the FRM or FRM-M2. The
maximum value for the CIR is limited to the line speed of the port
linking the FRM or FRM-M2 to the local device.
CIR From
Remote
This field, if enabled, specifies the CIR for data transmitted on the PVC
from the remote device through the network (via the FRM or FRM-M2)
to the local device. The maximum value for the CIR is limited to the line
speed of the port linking the FRM or FRM-M2 to the remote device.
This field will be disabled if the Max. Aggregate CIR parameter on the
local port is set to zero.
Committed
Burst Local
This field, if enabled, specifies the committed burst for data transmitted
on the PVC from the local device through the network via the FRM or
FRM-M2. The size of the committed burst (Bc) is specified in bits,
based on the CIR from the local device. Bc is derived as follows:
Bc = T * CIR
( where: T is a time value)
StarKeeper II NMS Graphics System Guide, R10.0, Issue 1
8-137
Using Network Builder to Configure Your Network
Parameter
Description
Committed
Burst Local
(continued)
An option menu with all calculated Bc values may be displayed
depending on the release of the node being provisioned.
Committed
Burst Remote
This field, if enabled, specifies the committed burst for data transmitted
on the PVC from the remote device through the network (via the FRM
or FRM-M2) to the local device.
The size of the committed burst (Bc) is specified in bits, based on the
CIR from the remote device.
An option menu with all calculated Bc values may be displayed
depending on the release of the node being provisioned. This field will
be disabled if the Max. Aggregate CIR parameter on the local port is
set to zero.
Excess Burst
Local
This field, if enabled, specifies the excess burst for data transmitted on
the PVC from the local device through the network via the FRM or
FRM-M2.
The size of the excess burst (Be) may be specified in bits, or it may be
entered as a percentage of the port line speed. However, specification
as a percentage is only allowed if the value entered for CIR From Local
is less than the local port line speed. If a percentage is entered, the
system calculates the maximum possible value of Be, Be(max) so that
the sum of Bc and Be(max) equals the maximum port line speed. It
then applies the specified percentage to Be(max) to obtain Be. The
following illustrates how Be is derived from Be(max) for FRM:
Be(max) = (LS * T) - Bc
Be = Be(max) * P
where: P is the specified percentage, LS is the maximum port line
speed (in bps). T is the time interval (in seconds) selected when Bc
(committed burst) was specified.
The following illustrates how Be is derived from Be(max) for FRM-M2:
Be(max) = (LS - CIR)* T
Bc = T* CIR
where: LS is the line speed (in bps) of the local FRM-M2 virtual port. T
is the time interval (in seconds) selected when Bc (committed burst)
was specified.
The field appears if CIR for this DLCI is enabled and CIR from the local
device is not equal to the port line speed of this end.
When you switch units from "%" to "bits" or vice versa, the value for
excess burst from local device is converted and displayed in the field.
8-138
StarKeeper II NMS Graphics System Guide, R10.0, Issue 1
Using Network Builder to Configure Your Network
Parameter
Excess Burst
Remote
Description
This field, if enabled, specifies the excess burst for data transmitted on
the PVC from the remote device through the network to the local device
via the FRM or FRM-M2.
The size of the excess burst (Be) may be specified in bits or it may be
entered as a percentage of the port line speed. However, specification
as a percentage is only allowed if the value entered for CIR From
Remote is less than the remote port line speed. If a percentage is
entered, the system calculates the maximum possible value of Be,
Be(max), so that the sum of Bc and Be(max) equals the maximum port
line speed. It then applies the specified percentage to Be(max) to
obtain Be.
When you switch units from "%" to "bits" or vice versa, the value for
excess burst from remote device is converted and displayed in the
field.
Group Name
This field is a string of 1 to 8 characters that identifies a bundle of
DLCIs as a logical group. DLCIs cannot be mixed in the same group
with other module types. Only two-way groups are allowed so the endpoint may originate or receive a call. Any number of DLCIs may be
associated with one group. The assignment of DLCIs to groups only
has significance if the administrator intends to make use of the
originating group security feature offered by BNS-2000 VCS and BNS2000.
Multicast DLCI
Group ID
A PVC DLCI can be configured to belong to a specified multicast DLCI
group. If data arrives (from the connected equipment) for a multicast
DLCI, it will be transmitted over the DLCIs belonging to that multicast
DLCI's group.
PVC
Destination
Address
This field is a string of 1 to 72 characters that specifies the permanent
virtual circuit destination, or the service address (module, port, and
DLCI) to which the DLCI is to be connected. If entered, the DLCI is
assumed to be the originating endpoint for the DLCI connection pair.
The string “receiving” is used to designate this end's DLCI as the
receiving endpoint for the PVC. The "PVC Dest. Address" has the form:
[network/][area/][exchange/]local.physical port address
where: network, area, exchange, and local are service addresses
defined at the specified level, and the physical port address has the
form:
[concentrator/]module.port.dlci for M1
module.pport.vport.dlci for M2
Use the abbreviated command button to obtain a choose list with all the
local service addresses configured in the node of the other end. If a
service address is selected from the choose list, the physical port
address portion of the other end (module.port.dlci) will be appended
before entry into the field. You can always override any portion of the
address entered into this field at any time.
StarKeeper II NMS Graphics System Guide, R10.0, Issue 1
8-139
Using Network Builder to Configure Your Network
Parameter
Description
PVC Number
The PVC number is a number from one to eight digits (1 to 99999999),
unique in the network used as an identifier. This number is used to
identify a pair of DLCIs that make up a PVC. Refer to the beginning of
this section for more information related to PVC numbering.The Next
Available button next to this field will enter the next available PVC
number into the field when pressed. See the corresponding Task Note
for more information.
Tuning (M1
only)
This field specifies the throughput tuning value of the PVC connection
over various trunk types in the network. The tuning value entered
indicates the size of the data window that will be transmitted through
the network. When set to a lower value, throughput tuning limits the
network resources that the DLCI can consume. If the PVC is routed
over a trunk with heavy interactive traffic and the traffic begins to
experience delays, throughput tuning should be set to a lower value. If
the PVC is routed over a trunk that covers a long distance, throughput
tuning should be set to a higher value to attain higher throughput.
0
Trouble Recovery Scenarios
The following contains additional information that will be useful if a problem occurs
when you submit a new two-sided PVC. Because this operation involves more
steps than entering a new module, port, or virtual port, it can illustrate the kinds of
steps that would apply when you encounter problems in configuring those
resources as well.
0
New PVC
When you submit a new PVC, the following activities occur:
a.
Data for End 1 is entered on its node.
b.
Data for End 1 is entered in the StarKeeper II NMS Core System database.
c.
Data for End 2 is entered on its node.
d.
Data for End 2 is entered in the StarKeeper II NMS Core System database.
e.
The DLCI for End 1 is put into service on its node.
f.
The DLCI for End 2 is put into service on its node.
If an error occurs during any step above, you can perform the corresponding step
below to recover:
a.
Use Network Builder to cancel the transaction, reconfigure this PVC, and
resubmit.
b.
Use the pass-through capability to delete the End 1 DLCI,
delete -n nodename frm d modaddr portnum [vportnum] end1_dlci
8-140
StarKeeper II NMS Graphics System Guide, R10.0, Issue 1
Using Network Builder to Configure Your Network
Use Network Builder to cancel the transaction, reconfigure this PVC, and
resubmit.
c.
Use Network Builder to cancel the transaction, delete the one-sided PVC,
and configure the new PVC again
d.
Use the pass-through capability to delete the End 2 DLCI,
delete -n nodename frm d modaddr portnum [vportnum] end2_dlci
Use Network Builder to cancel the transaction, delete the one-sided PVC,
and configure the new PVC again.
e.
Use the pass-through capability to restore the End 1 and End 2 DLCIs,
restore -n nodename frm d modaddr portnum [vportnum] end1_dlci
restore -n nodename frm d modaddr portnum [vportnum] end2_dlci
f.
Use the pass-through capability to restore the End 2 DLCI,
restore -n nodename frm d modaddr portnum [vportnum] end2_dlci
0
Changed PVC
When you submit a change to a PVC, the following activities occur:
a.
The End 1 DLCI is removed from service on its node.
b.
Data for End 1 is changed on its node.
c.
Data for End 1 is changed in the StarKeeper II NMS Core System
database.
d.
The End 2 DLCI is removed from service on its node.
e.
Data for End 2 is changed on its node.
f.
Data for End 2 is changed in the StarKeeper II NMS Core System
database.
g.
The DLCI for End 1 is restored to service on its node.
h.
The DLCI for End 2 is restored to service on its node.
If an error occurs during any step above, you can perform the corresponding step
below to recover:
a.
Use Network Builder to cancel the transaction, reconfigure this PVC, and
resubmit.
b.
Use Network Builder to cancel the transaction, reconfigure this PVC, and
resubmit.
c.
Run the skload or cfg_sync command to synchronize the DLCI data. Use
Network Builder to cancel the transaction, reconfigure this PVC, and
resubmit.
StarKeeper II NMS Graphics System Guide, R10.0, Issue 1
8-141
Using Network Builder to Configure Your Network
d.
Use Network Builder to cancel the transaction, Load the PVC, reconfigure
End 2 only, since data for End 1 has been applied to both the node and the
StarKeeper II NMS databases, and resubmit.
e.
Use Network Builder to cancel the transaction, Load the PVC, reconfigure
End 2 only, since data for End 1 has been applied to both the node and the
StarKeeper II NMS databases, and resubmit.
f.
Run the skload or cfg_sync command to synchronize the DLCI data. Use
Network Builder to cancel the transaction, reconfigure End 2 only for this
PVC, and resubmit.
g.
Use the pass-through capability to restore the End 1 and End 2 DLCIs,
restore -n nodename frm d modaddr portnum [vportnum] end1_dlci
restore -n nodename frm d modaddr portnum [vportnum] end2_dlci
h.
Use the pass-through capability to restore the End 2 DLCI,
restore -n nodename frm d modaddr portnum [vportnum] end2_dlci
The recovery procedures for a one-sided PVC are similar to those for a two-sided
PVC.
0
Deleting a PVC
When you submit a request to delete a PVC, the following activities occur:
a.
The End 1 DLCI is removed from service on its node.
b.
Data for the End 1 DLCI is deleted from its node.
c.
Data for the End 1 DLCI is deleted from the StarKeeper II NMS Core
System database.
d.
The End 2 DLCI is removed from service on its node.
e.
Data for the End 2 DLCI is deleted from its node.
f.
Data for the End 2 DLCI is deleted from the StarKeeper II NMS Core
System database.
If an error occurs during any step above, you can perform the corresponding step
below to recover:
8-142
a.
Use Network Builder to cancel the transaction and delete again.
b.
Use Network Builder to cancel the transaction and delete again.
c.
Use the pass-through capability to enter the End 1 DLCI data on the node
again. Use Network Builder to cancel the transaction and delete again.
d.
Use Network Builder to cancel the transaction, and delete the PVC as a
one-sided PVC.
StarKeeper II NMS Graphics System Guide, R10.0, Issue 1
Using Network Builder to Configure Your Network
e.
Use Network Builder to cancel the transaction, and delete the PVC as a
one-sided PVC.
f.
Use the pass-through capability to enter the End 2 DLCI on the node again.
Use Network Builder to cancel the transaction, and delete the PVC as a
one-sided PVC.
StarKeeper II NMS Graphics System Guide, R10.0, Issue 1
8-143
Using Network Builder to Configure Your Network
8-144
StarKeeper II NMS Graphics System Guide, R10.0, Issue 1
Using Network Builder to
Analyze Your Network
0
9
This chapter explains the Connectivity Analysis and Session Maintenance
simulation tools of the StarKeeper II NMS Network Builder. It contains the
following information:
■
overall functions of the Connectivity Analysis and Session Maintenance
simulation tools
■
constraints and limitations
■
Connectivity Analysis input and output data
■
how to use the Connectivity Analysis tools
— analyzing a new network
— checking the routing of an existing network
— using “What If...” scenarios to optimize network connectivity or
analyze changes
■
how to use the Session Maintenance simulation tool
■
examples of using the analysis tools
■
troubleshooting
Overall Functions
This section explains the functions performed by the Connectivity Analysis and
Session Maintenance simulation tools. These tools provide connectivity analysis
for the trunk groups and routing in a network, and simulation modeling of Session
Maintenance performance under failure conditions. The main features of these
tools are:
The Connectivity Analysis tools use data loaded from the StarKeeper II NMS Core
System database, or accept input directly from the user. The Session
Maintenance simulation tool loads its data from the StarKeeper II NMS Core
System database. The next sections provide summaries of these tools.
StarKeeper II NMS Graphics System Guide, R10.0, Issue 1
9-1
Using Network Builder to Analyze Your Network
Connectivity Analysis
The Connectivity Analysis tools examine the network of nodes,
trunk connections, and routing that represents your network.
They detect a variety of types of errors in the connectivity and
routing, and provide recommendations on ways to correct them.
They generate reports you can use to optimize the connectivity
and routing for a new network, or to modify an existing network.
They allow you to change the data model representing the
network, and analyze the results of these changes as “What
If...” scenarios. After all errors are eliminated from the input
data, the Connectivity Analysis tools recommend a set of
reliable alternative routing patterns for the network.
Session Maintenance
Trunk Failure
Simulation
The Session Maintenance simulation tool simulates the
performance of Session Maintenance routing under failure
conditions. It reports on Session Maintenance trunks, channel
sets, active and standby bandwidth, and reroute connectivity.
This tool enables you to predict the results of Session
Maintenance events. By inspecting these results, you can
adjust the Session Maintenance parameters for the network
until you obtain satisfactory results.
Connectivity Analysis
Reliable alternative routing implies the absence of dead ends and call-looping in
routing administration. As the number of nodes and trunks in a network increases,
the problem of designing reliable alternative routing becomes extremely complex.
For a network of more than a few nodes, optimizing the trunk group connectivity
and routing requires an automated approach. For this purpose, Network Builder
provides a set of connectivity analysis tools to assist you. These tools enable you
to optimize both connectivity and routing using “What If...” scenarios to analyze
the effect of changes. “What If...” scenarios are explained later in this section.
The Network Builder connectivity analysis tools consist of the following tools:
■
Topology Evaluation
■
Routing Evaluation
■
Path Analysis
NOTE:
The Connectivity Analysis tools analyze the topology of networks, based on
defined nodes and trunks in the network; the network routing, based on first
and second choice routing assignments; and the paths between endpoints
for trunk failure or node failure conditions. None of these tools use traffic
characteristics, bandwidth requirements, or other considerations in their
routing recommendations.
9-2
StarKeeper II NMS Graphics System Guide, R10.0, Issue 1
Using Network Builder to Analyze Your Network
Designs
The connectivity analysis tools work with a model of the network: a collection of
data called a design. A design contains node address and topology input data,
routing input data, and reports generated by the Connectivity Analysis tools. A
design must contain data before the tools can run. In general, data can be created
for a design in two ways:
■
Committed data includes node configuration data, trunk configuration data,
and routing data loaded from the StarKeeper II NMS Core System
database. When a design contains only committed data with no changes, it
reflects the actual configuration of the network.
■
Other data can be entered directly into the model, using input data panes
provided by the Connectivity Analysis tools. This type of data may be
limited to “What If...” changes to data loaded from the StarKeeper II NMS
Core System database, or it may be a complete network model entered in
the input data panes.
The current design contains the network connectivity and routing data that you
have loaded or generated, and that you are working on at the moment. A saved
design is a design that has been saved previously during a Connectivity Analysis
session. Each saved design is identified by a name that you assign when saving
it. You can display either the current data or the last data saved for a design in the
View windows.
If you want to study and compare the effect of several changes to a design, you
can simply save each configuration with a different design name. To use one of
the alternative designs, you can just load its data. The Connectivity Analysis tools
allow you to save up to 40 designs.
The Connectivity Analysis tools analyze one design at a time. While you are
working on a design, its data is reserved for exclusive access by the current
instance of Connectivity Analysis. If you call up another instance of Connectivity
Analysis through the Network Builder control window, you can use it to analyze
another design, but not the one that you are already analyzing.
Network Structure
Network nodes can be connected in a variety of ways to form different structures.
The key distinction, for connectivity analysis, is between flat networks and
hierarchical networks.
StarKeeper II NMS Graphics System Guide, R10.0, Issue 1
9-3
Using Network Builder to Analyze Your Network
■
A flat network is organized so that all of the nodes are in one network or
area, or are all separate networks. In a flat network, it is not necessary for a
call to be routed to a higher addressing level to reach another node. The
Connectivity Analysis tools are designed to work correctly with flat
networks.
■
A hierarchical network is organized so that nodes are separated into
different areas and exchanges. In a hierarchical network, a call may need
to be routed from the originating node to a different exchange, area, or
network to reach the destination node. The Connectivity Analysis tools do
not handle hierarchical networks. These tools may be useful for analyzing
subnetworks within a hierarchical network, such as all the nodes in one
exchange or area, but they cannot analyze such a network as a whole.
The Connectivity Analysis tools are particularly useful for analyzing the
connectivity and routing within new networks that use flat addressing.
Topology Evaluation
The Topology Evaluation tool analyzes the topology of a network—the
arrangement of trunk groups connecting the nodes. It determines whether the
network has sufficient trunks between nodes to support robust utility routing—
enabling a call to be routed from any node to any other node in the network—for
normal and failure scenarios. It performs this analysis for primary and secondary
routes; it does not consider third and fourth choice routes.
In its analysis, the Topology Evaluation tool searches for dead-end, call-looping,
and call-blocking conditions.
9-4
■
A dead-end condition occurs when a call setup request reaches a node
with no acceptable outgoing trunk groups, and cannot be routed further.
This can be caused by a trunk group or node failure, or it may be due to an
error in the initial input data.
■
A call-looping condition occurs when the path of a call setup request leads
back to one of the nodes it has already passed through. This condition is
generally caused by a trunk group or node failure, or it may be caused by
an error in the initial input data.
■
A call-blocking condition is noted when a call setup request fails due to a
node failure, and the network is being evaluated for node diversity. Node
diversity in a network means that there is at least one path remaining from
any source to any destination following any single node failure.
StarKeeper II NMS Graphics System Guide, R10.0, Issue 1
Using Network Builder to Analyze Your Network
If the network lacks sufficient connectivity, the Topology Evaluation tool generates
the best recommended routing patterns, lists connectivity errors, and identifies the
location and type of each error. It also recommends corrective actions to eliminate
the errors. Using the Connectivity Analysis input data panes to make corrections,
you can use “What If...” scenarios to evaluate and improve the corrected network
connectivity.
If the network has sufficient connectivity, the Topology Evaluation tool generates
error-free routing patterns for every node in the network. Even if routing patterns
exist for this network, the Topology Evaluation tool ignores them and generates
completely new ones.
Routing Evaluation
The Routing Evaluation tool checks the existing routing for a network. Like the
Topology Evaluation tool, it searches for dead-end routes, call looping paths, and
call-blocking paths. In addition, the Routing Evaluation tool detects the following:
■
primary routes which do not satisfy the minimum hop criterion. The
minimum hop criterion is based on the number of hops in the shortest route
between two nodes. If the primary route contains more hops than the
minimum, it does not meet the minimum hop criterion.
■
no assignment of either primary route, secondary route, or both
The Routing Evaluation tool tries to find error-free routing with the least amount of
change to the existing routing pattern for each destination address. This is
important when you modify or analyze an existing network in which the routing is
based on available trunk bandwidth, traffic, or other considerations that the
Routing Evaluation tool does not include in its analysis. The Routing Evaluation
tool generates new routing patterns only if the network has sufficient connectivity.
If the design contains errors, the Routing Evaluation tool lists them along with
recommendations for corrective actions. Using the Connectivity Analysis input
data panes to make corrections, you can use “What If...” scenarios to evaluate and
create error-free routing.
StarKeeper II NMS Graphics System Guide, R10.0, Issue 1
9-5
Using Network Builder to Analyze Your Network
Differences Between Topology Evaluation and
Routing Evaluation
The Topology Evaluation and Routing Evaluation tools differ as shown in the
following table.
Table 9-1.
Differences Between Topology Evaluation and Routing Evaluation
Topology Evaluation
Routing Evaluation
Does not require any existing routing.
Evaluates the existing routing for a destination
address, and determines whether problems exist.
If there is no existing routing, and the network
connectivity is good, the tool generates
completely new routing.
Generates best recommended routing
patterns for an entire network in one
run.
Produces the recommended routing pattern for
one destination address per run.
Generates best recommended routing
every time it completes a run.
Generates recommended routing only if the
existing routing has errors and the network has
good connectivity; if the existing routing has no
errors, no recommendation is output.
Path Analysis
The Path Analysis tool can be run after either the Topology Evaluation tool or
Routing Evaluation tool has completed an error-free run. It performs an
exhaustive analysis of every path leading from a given source address to a
specified destination. You can pick whether to analyze paths under node failure or
trunk group failure conditions.
9-6
■
If you pick node failure, the Path Analysis tool analyzes the effect of any
single node failure on all possible paths from source to destination.
■
If you pick trunk group failure, the Path Analysis tool analyzes all possible
paths from source to destination with no trunk group failures, any single
trunk group failure, and any two trunk group failures.
StarKeeper II NMS Graphics System Guide, R10.0, Issue 1
Using Network Builder to Analyze Your Network
Input to the Path Analysis tool can come from either Topology Evaluation or
Routing Evaluation. In addition, the data generated by those tools depends on
whether the evaluation was done with the node diversity option. Thus, you can
specify one of the following input sources:
■
Topology Evaluation
■
Node-Diverse Topology Evaluation
■
Routing Evaluation
■
Node-Diverse Routing Evaluation
The output from the Path Analysis tool shows completed, crankback, routeadvanced, and blocked paths under normal and failure conditions.
■
A completed path occurs when a call can be routed successfully from
source to destination.
■
A crankback path occurs when a call is dropped back to the originating
node to try an alternate path due to a trunk group or node failure.
■
A route-advanced path occurs when a call cannot be routed normally from
a node, and the route advance algorithm is used to find an alternate trunk.
■
A blocked path occurs when a call setup request fails due to a trunk group
or node failure.
You can use this information to locate possible points of failure in the network,
then change the routing to improve its robustness. The Path Analysis reports can
be used as a static call trace of each path, to pinpoint the possible source of
problems in the network. They show the maximum number of hops between
source and destination, so this information can be used to reduce the number of
hops.
The Path Analysis tool does not search for problems and make recommendations
for changes, as the Topology and Routing Evaluation tools do. It takes the errorfree routing generated by the other tools, and analyzes the effect of failures on
that routing. What that may mean in terms of network performance is a matter for
you to interpret. If you find the need to change the routing based on the Path
Analysis reports, you can use “What If...” analysis to develop connectivity and
routing that is better for your purposes.
StarKeeper II NMS Graphics System Guide, R10.0, Issue 1
9-7
Using Network Builder to Analyze Your Network
Session Maintenance Simulation Tool
The Session Maintenance simulation tool models the performance of the Session
Maintenance feature of your network under trunk failure conditions. For input, it
can use two types of data:
■
committed data—including node configuration data, trunk configuration
data, and node reroute tables (NRTs) loaded from the StarKeeper II NMS
Core System database
■
pending data—entered using the Network Builder Configuration tools, but
not yet downloaded to the StarKeeper II NMS Core databases and to the
nodes in the network. It includes node data, trunk data, and NRTs created
by the Network Builder configuration tasks in this Graphics System only.
Note that pending data from other StarKeeper II NMS workstations is not
available at this Graphics System.
Committed and pending data together make up the entire network configuration
as defined by data available at this Graphics System. Before running the Session
Maintenance simulation tool, you can choose whether to use only committed data,
or to use both committed and pending data. Using this configuration data, the
Session Maintenance simulation tool models the effect of various trunk failures, as
specified in the Run: Session Maintenance Simulation command window. The
command window allows you to specify which trunks fail during the simulation,
and whether the failures occur concurrently, sequentially, or overlapped. The
Session Maintenance simulation tool models the actions of the nodes as they
reroute channel sets under the simulated failure conditions. It records the results
and generates a set of reports based on the simulation.
Using the Connectivity Analysis Tools
This section explains the basic features of the Connectivity Analysis tools,
including their overall constraints and limitations, the user interface, and how to
use the input data panes.
Constraints
The Connectivity Analysis tools operate within the following constraints:
9-8
■
The network (or subnetwork) to be analyzed must have a flat structure, not
a hierarchical structure.
■
The node address for each node must be unique at the level used for
analysis.
StarKeeper II NMS Graphics System Guide, R10.0, Issue 1
Using Network Builder to Analyze Your Network
If you create a design without using data from the StarKeeper II NMS Core
System database, you can specify whether to analyze connectivity at the
network, area, or exchange level. If you use data from the database, the
addresses in the real network data determine what address level is used
for analysis. Whatever level is used, the node addresses must all be unique
at that level. The reason for this constraint is that the analysis tools must
know about every node in the network under analysis, and they cannot
operate correctly unless the address of every node is unique.
The input preprocessor recognizes when two nodes have the same
address, and automatically generates unique names for all nodes. If this
occurs, it is listed in the Database Validation report (explained later in this
chapter), and no existing routing data is loaded.
If the addressing level for analysis is at the exchange level, all area and
network addresses must be the same. If analysis is done at the area level,
all network addresses must be the same.
■
Nodes must all have the address type (either mnemonic or X.121) that you
select in the New Design window.
If a node does not have the same address type as you have selected, the
input preprocessor reports in the Database Validation report that the
design is an "invalid" model, and uses the node address that is available.
■
Each trunk group must contain trunks from only one end node to only one
other node.
The analysis tools do not accept trunk groups which contain trunks leading
to two or more nodes. As far as the tools are concerned, "trunk" must be
synonymous with "trunk group." A trunk group can contain more than one
trunk, but all of the trunks in one group must connect to the same nodes at
each end.
The input preprocessor recognizes when a trunk group contains trunks to
more than one node. It rejects trunks leading to any nodes other than the
first node address defined, and notifies you of the error in the Database
Validation report.
■
The analysis tools only consider the primary and secondary routing
choices.
Although the network allows you to specify up to four choices for each
destination, the analysis tools use only the first two choices.
StarKeeper II NMS Graphics System Guide, R10.0, Issue 1
9-9
Using Network Builder to Analyze Your Network
Connectivity Analysis User Interface Controls
You can display the Connectivity Analysis Base Window by choosing Network
Connectivity from the Analyze menu of the Network Builder control window. (For
instructions, see Procedure 9-1, Starting Connectivity Analysis later in this
chapter.) This section explains how to use the controls provided in the
Connectivity Analysis Base Window. The following screen shows the Connectivity
Analysis Base Window control area.
Screen 9-1.
Connectivity Analysis Base Window Controls
This window contains the following control buttons:
File
Provides a menu of commands to load, save, create, and delete
network designs
Run
Provides a menu of commands to run the Topology Evaluation,
Routing Evaluation, and Path Analysis tools
View
Provides a menu of commands and sub-menus to view input data
and the reports generated by the Topology Evaluation, Routing
Evaluation, and Path Analysis tools
Help
Provides general help for the connectivity analysis tools
After you load or create a design, the Design Name field, Address Level field, and
the Edit controls are displayed below these buttons.
9-10
StarKeeper II NMS Graphics System Guide, R10.0, Issue 1
Using Network Builder to Analyze Your Network
0
The File Menu
The file commands enable you to load, save, create, and delete designs. Using
the File menu, you can access the following commands:
Load Design
Loads a design that was created and saved previously
Save Design
Saves a design for future use
New Design
Creates a new design
Delete Design Removes a design that was saved previously
0
The Run Menu
The Run menu contains commands to run the Topology Evaluation, Routing
Evaluation, and Path Analysis tools.
Topology
Evaluation
Calls up the command window to run Topology Evaluation. This
window allows you to specify whether to use the following
options:
■
evaluate using extended routing
■
evaluate for node diversity
These options are explained in detail in Procedure 9-2.
Routing
Evaluation
Calls up the command window to run the Routing Evaluation
tool. This window allows you to specify the destination address
to be analyzed, and whether to use the following options:
■
evaluate using extended routing
■
evaluate for node diversity
These options are explained in detail in Procedure 9-3.
Path Analysis
Calls up the command window to run the Path Analysis tool.
This window allows you to specify the failure mode and input
source for analysis, and specify the source and destination
addresses to be analyzed. See Procedure 9-2.
StarKeeper II NMS Graphics System Guide, R10.0, Issue 1
9-11
Using Network Builder to Analyze Your Network
0
The View Menu
The View menu contains commands and sub-menus to enable you to view, save,
and print both input data and output reports generated by the Topology
Evaluation, Routing Evaluation, and Path Analysis tools.
Node Address
& Topology
Input
Displays the input data defining node addresses and trunk
groups in this design. Also displays the results of connectivity
validation.
Routing Input
Displays the input data defining primary and secondary routes
through the network.
Database
Validation
Report
Shows the results of data validation performed by the input
preprocessor when a design is created using data loaded from
the StarKeeper II NMS Core System database.
Topology
Evaluation
Report
Calls up a sub-menu to display the output from the network
topology evaluation. Choices on this menu include:
Destination Routing
Displays the Destination Routing report and errors detected
during Topology Evaluation.
Trunk Group Use
Displays the Trunk Group Use report.
Extended Routing Recommendations
Displays the Extended Routing Recommendations report.
Source Routing
Displays the Source Routing report.
9-12
StarKeeper II NMS Graphics System Guide, R10.0, Issue 1
Using Network Builder to Analyze Your Network
Node Address
& Topology
Input
Displays the input data defining node addresses and trunk
groups in this design. Also displays the results of connectivity
validation.
Routing
Evaluation
Report
Calls up a sub-menu to display the output from the network
routing evaluation. Choices on this menu include:
Routing Errors
Displays the Routing Errors report.
Destination Routing
Displays the Destination Routing report.
Source Routing
Displays the Source Routing report.
Path Analysis
Report
Calls up a sub-menu to display the output from the network path
analysis. Choices on this menu include:
Summary
Displays the Summary Path Analysis report
Detailed
Displays the Detailed Path Analysis report
StarKeeper II NMS Graphics System Guide, R10.0, Issue 1
9-13
Using Network Builder to Analyze Your Network
0
Report Viewing Windows
Each report viewing window contains a data pane, a header control area, and a
footer control area. See the following screen for an example.
Screen 9-2.
Report Viewing Window
Their functions are as follows:
■
Header Control Area
The header control area contains one or more controls (depending on the
type of report you are viewing). These controls enable you to specify which
data to view. The most common controls include those listed in the next
table.
9-14
StarKeeper II NMS Graphics System Guide, R10.0, Issue 1
Using Network Builder to Analyze Your Network
Field Name
Description
Report Version
Exclusive setting. Current or Saved. Use this control to choose
whether to display the current version of the report or the saved
version. The control is useful for comparing the current design to the
saved design after making “What If ...” changes. It does not apply to a
report that has been saved to a file using the View window Save to File
control (explained further on in this section).
Node Diversity
Exclusive setting. Yes or No. Use this control to choose which version
of an output report to display: a report from an evaluation with the
Node Diversity option, or a report from an evaluation without the
Node Diversity option.
Destination
Address
A scrolling list of destination addresses. This field specifies the
destination address for which a report is displayed.
Source Address
A scrolling list of source addresses. This field specifies the source
address for which a report is displayed.
■
Data Pane
The data pane displays the data in the report. Data panes usually contain a
vertical scrollbar for scrolling through the report data.
■
Footer Control Area
The footer control area contains several buttons to provide additional
functions:
StarKeeper II NMS Graphics System Guide, R10.0, Issue 1
9-15
Using Network Builder to Analyze Your Network
Use this button to search for specific data in the report. This is useful when the
report is large, and you want to look at certain parts. Enter a search string into the
text field and click Find [ Next ] .
Find [ Next ]
When you choose Find [ Next ] , the application searches in the report text for the
specified string. If the search reaches the end of the report without finding the
search string, it "wraps around" and continues at the beginning of the report. If the
text is found, the text in the data pane scrolls until the line where the match
occurred is visible.
If you plan to search repeatedly for the same string, use the
again after the first search.
Find [ Next ]
button
Use this button to send a copy of the report to the default destination of the lp
command (for information on the lp command, refer to the StarKeeper II NMS
Installation Guide).
Print
Save to File
Use this button if you want to save the report to a file. It creates a text file copy of
the report. You can edit the file, view it, or use it as input to other programs, as you
see fit.
The Save to File command saves only the report you are viewing. It is not the
same as the saved version of a report created by choosing the Save command
from the File menu, which saves the entire design.
Use this button to dismiss the window.
Cancel
0
The Edit Controls
The Connectivity Analysis Base Window contains the following data panes:
■
Node Address Input Data Pane
■
Topology Input Data Pane
■
Routing Input Data Pane
The following sections explain how to use the input data panes to display and
change the input data.
9-16
StarKeeper II NMS Graphics System Guide, R10.0, Issue 1
Using Network Builder to Analyze Your Network
0
Node Address Input Data Pane
The Node Address Input Data Pane has the following format:
Screen 9-3.
Node Address Input Data Pane
This pane contains a list of any node addresses that were loaded, and a detailed
display for the current node in the list. When you choose a node address from the
scrolling list, its data is displayed in the corresponding data fields shown in the
above screen. The information is as follows:
Field Name
Description
Node Address
Text field. Shows the address of the current node at the level used
for analysis. This is the name the Connectivity Analysis tools use
when performing evaluations. You can change the address of a
node by editing the contents of this field.
Node Name
Text field. This field is optional, and may be left blank. If you leave
it blank, the node address is used as the node name by default. If
you load the design from the database, this field contains the
StarKeeper II NMS node name.
Extended Routing
Exclusive setting. Enabled or Disabled. The default value for an
insertion is Disabled. Enabling extended routing enables the route
advance, crankback, and hop count features in the node.
StarKeeper II NMS Graphics System Guide, R10.0, Issue 1
9-17
Using Network Builder to Analyze Your Network
If necessary, you can edit the node address data as follows:
■
To add a node, fill in the data fields as needed and click
■
To delete a node, choose the node address from the scrolling list and use
Delete
.
■
To change data for an existing node, including the node address, choose it
from the scrolling list and change the contents of the editing fields, then use
Edit .
Insert
.
NOTE:
Editing a node in the node address input data pane changes all the data
associated with the node data.
■
If you delete a node, all trunk groups that have one end connected to that
node are deleted automatically. Also, all routing data is deleted that refers
to the deleted node.
■
If you change the address of a node, the address is changed in all trunk
groups that are connected to the node, and in all routing that refers to it.
Whenever you edit the node address input data, connectivity validation is
performed automatically. The results appear in the Node Address and Topology
Input report, where you can view node address data for the entire network.
Topology Input Data Pane
Screen 9-4.
Topology Input Data Pane
This pane contains a list of trunk groups, and a detailed display.
9-18
StarKeeper II NMS Graphics System Guide, R10.0, Issue 1
0
Using Network Builder to Analyze Your Network
The trunk group list contains one line for each trunk group connecting two nodes.
Each line has the following format: node–trunk:node–trunk
The line contains a pair of node addresses and trunk group names, separated by
a colon. Each node name is followed by a dash, then a trunk group name.
The detailed data fields consist of an editing field for each node address and trunk
group name in the chosen line of the trunk group list. When you choose an
existing trunk group, the detailed data fields contain the information from that line.
The fields are as follows:
Field Name
Description
Address of End
Node 1
Text entry, with abbreviated Choose command button. The
Choose command window displays the list of nodes from the node
address input data pane. If you type in a node name, it must be on
the node address list.
Trunk Group 1
Text entry. The name of this trunk group at the first end node. This
field shows the name of the trunk group chosen from the trunk
group list or entered in the data field.
Address of End
Node 2
Text entry. The node at the other end of the trunk group. Data entry
is the same as Address of End Node 1.
Trunk Group 2
Text entry. The name assigned to this trunk group at the second
end node. Data entry is the same as Trunk Group 1.
If necessary, you can edit the trunk group data as follows:
■
To add a trunk group, fill in the data fields as needed. When you are
finished entering data for the new trunk group, use Insert . The new trunk
group is inserted into the list in alphabetical order, and the list is scrolled to
display it.
■
To delete a trunk group, choose the trunk group from the scrolling list and
use Delete .
■
To change data for an existing trunk group, including the trunk group
names, choose it from the scrolling list and change the contents of the
editing fields, then use Edit .
NOTE:
Editing a trunk group in the topology input data pane changes all the data
associated with the trunk group data.
■
If you delete a trunk group, it is automatically deleted from the routing data.
■
If you change the name of a trunk group, the name is automatically
changed wherever it appears in the routing data.
StarKeeper II NMS Graphics System Guide, R10.0, Issue 1
9-19
Using Network Builder to Analyze Your Network
Whenever you edit the topology input data, connectivity validation is performed
automatically. The results appear in the Node Address and Topology Input report,
where you can view topology data for the entire network.
0
Routing Input Data Pane
The routing input data pane is organized by destination address. For each
destination address, it displays a list of source addresses. The data field display
shows the primary and secondary trunk groups assigned for each source
address.
Screen 9-5.
Routing Input Data Pane
The data fields in this window are:
Field Name
9-20
Description
Destination
Address
Text entry, with abbreviated Choose command button. The
Choose command window displays the list of nodes entered in the
node address list data pane. This field specifies the destination
address for the routing shown for each source address. If you enter
a node address, it must be on the node address list.
Source Addresses
Scrolling list. The list contains all node addresses. You can choose
any address except the destination address.
StarKeeper II NMS Graphics System Guide, R10.0, Issue 1
Using Network Builder to Analyze Your Network
Field Name
Description
Source Address
Text display field. This shows the name of the source node chosen
from the source address list.
Primary Trunk
Group
Text entry, with abbreviated Choose command button. The
Choose command window displays the list of trunk groups
connected to the source node, as listed in the topology input data
pane. This field specifies the primary trunk group from the source
address to this destination. If you type in the trunk group name, it
must be on the trunk group list.
Secondary Trunk
Group
Text entry, with abbreviated Choose command button. This field
specifies the secondary trunk group from the source address to this
destination. Data entry is the same as Primary Trunk Group.
If you do not provide routing (either from the database or entered through the
input data pane), the Routing Evaluation tool reports this as an error. The Routing
Evaluation tool attempts to generate new routing for any node where routing is
omitted. If necessary, you can edit the routing for a source address as follows:
a.
Choose the destination address.
b.
Choose one of the source addresses from the source node list.
c.
Edit the following data fields:
■
If any additions or changes are needed, choose a primary trunk
group, secondary trunk group, or both for the source address.
■
To delete the routing for a node, clear the Primary and Secondary
Trunk Group fields.
■
If you want to assign only primary routing for a node, leave the
Secondary Trunk Group field blank.
d.
After you finish entering data in all fields, use
e.
Repeat the above steps as needed for every source address and every
destination address.
Update Routing Entry
.
To view the routing for the entire network, see the Routing Input report.
Connectivity Analysis Procedures
This section explains the following basic tasks:
■
starting Network Builder for Connectivity Analysis
■
analyzing a new network
■
analyzing an existing network
■
analyzing “What If...” scenarios
StarKeeper II NMS Graphics System Guide, R10.0, Issue 1
9-21
Using Network Builder to Analyze Your Network
If you are:
See:
Starting the Network Builder for Connectivity
Analysis
Procedure 9-1
Analyzing a new network
Procedure 9-2
Checking the routing of an existing network
Procedure 9-3
Changing the topology, routing, or both in an
existing network
Procedure 9-4
These procedures provide instructions for beginning to use the network
connectivity analysis tools. Once you become familiar with using the tools, you
probably will not need to refer to these procedures very often.
Starting Network Builder for Connectivity
Analysis
This procedure explains how to:
■
start Network Builder
■
choose Connectivity Analysis
Procedure 9-1.
1.
Starting Network Builder for Connectivity Analysis
To start Network Builder, click on the Network Builder icon of the
StarKeeper II NMS subpanel.
A banner window comes up to remind you to run cfg_sync before using
Network Builder. After a few seconds the banner window disappears and
the Network Builder Control Window appears.
9-22
2.
From the Network Builder Control Window, choose Network Connectivity
from the Analyze menu. The Connectivity Analysis Base Window appears.
You can use the controls in this window to invoke the Connectivity Analysis
tools.
3.
To quit the Connectivity Analysis application at any time, choose Quit from
the Base Window menu button.
StarKeeper II NMS Graphics System Guide, R10.0, Issue 1
Using Network Builder to Analyze Your Network
Analyze a New Network
This procedure explains how to:
■
Create a design.
■
Review the Database Validation report.
■
Edit the input data.
■
Run Topology Evaluation to check the network connectivity and generate
error-free routing.
■
Run Path Analysis to check the call routing from point to point in the
network.
■
Interpret the results.
■
Save the results.
■
Evaluate designs in parallel.
■
Implement the recommendations of the analysis tools.
Before you begin this procedure, you must first start Network Builder and invoke
the Connectivity Analysis tools, as instructed in Procedure 9-1.
Procedure 9-2.
A.
Create New Design
Analyze a New Network
0
NOTE:
When you create a new design, there are two ways to enter data into it:
■
Load the data from the StarKeeper II NMS Core System database.
To load from the database, you must first enter the network
configuration as instructed in Chapter 8.
■
Use the input data panes to enter the data directly.
1.
Choose New Design from the File menu.
2.
The New Design command window appears. It has the following format:
StarKeeper II NMS Graphics System Guide, R10.0, Issue 1
9-23
Using Network Builder to Analyze Your Network
Screen 9-6.
New Design Command Window
Specify the following information:
Field Name
9-24
Description
Design Name
The name of the new design, maximum 14 characters. If you do
not enter a name, the system generates "design_N where "N" is
an integer starting at "1". Example: "design_1".
Input
If you specify "From Database", the system will use the
configuration from the StarKeeper II NMS Core System database.
If you specify "Empty", you must specify the address level and
enter configuration data in the Connectivity Analysis input data
panes.
Address Level
This control appears in the window if you specify Empty as the
input source (if you specify From Database, the tool sets the
address level based on the addresses used in the network). It
specifies what part of each node address is used for analysis.
Each node in the design must have a unique address at the
chosen level.
Address Type
Preference
This control is active only if you specify From Database as the
input source. It specifies whether to use mnemonic or X.121
addresses if a node has both types.
Use Selected Nodes
This control allows you to choose a subset of the nodes in the
network for connectivity analysis.
StarKeeper II NMS Graphics System Guide, R10.0, Issue 1
Using Network Builder to Analyze Your Network
The scrolling list on the left contains all the nodes loaded from the
database. When first displayed, the scrolling list on the right is empty.
3.
4.
Select nodes from the left hand list.
■
When you choose a node from the list of existing nodes, its name is
highlighted, and it appears in the list of selected nodes.
■
As you choose nodes from the list of existing nodes, they appear in
alphabetical order in the list of selected nodes.
■
If you click on a highlighted node name in the list of existing nodes,
its name is deleted from the list of selected nodes.
After all the information is complete, choose New Design.
The window remains busy while the tool loads from the database.
5.
B.
Once the new design is created, the Connectivity Analysis Base Window
shows the design name, address level of the new design, and input editing
controls.
Review Database Validation Report
0
Data validation occurs when data is loaded into a design from the StarKeeper II
NMS Core System database; the result of this processing is the Database
Validation report. Review this report to see whether it lists any errors that need to
be corrected before you run Topology Evaluation or Routing Evaluation. Errors
listed in the report include:
■
rejected nodes
■
nodes assigned new addresses
■
duplicate node addresses
■
trunk groups connected to more than two nodes
■
rejected trunk groups
StarKeeper II NMS Graphics System Guide, R10.0, Issue 1
9-25
Using Network Builder to Analyze Your Network
Pay close attention to this report. It lists errors in the input, and actions taken
during input processing. Table 9-2 lists the possible errors, and actions you may
need to take in response to each type of error.
Table 9-2.
Error Conditions Listed in Database Validation Report
Error Message
Node "xxx" not included in design.
Could not retrieve data - Possible
unsupported node type.
Node "xxx" not included in design.
Could not retrieve data Communication problem.
Routing data for node "xxx" not
included in design.
Could not retrieve data Communication problem.
Connectivity data for node "xxx"
may be incomplete - unsupported
node type.
9-26
Explanation and Response
Make sure that the StarKeeper II NMS Core System
database is synchronized before you load data into
the design.
Determine the cause of the communication problem
and correct it. Check that the connection to the
StarKeeper II NMS host is up and synchronized.
When ready, try to load the data for this design
again.
Determine the cause of the communication problem
and correct it. Check that the connection to the
StarKeeper II NMS host is up and synchronized.
When ready, try to load the data for this design
again.
If the node is a pre-Release 3.0 BNS-2000 VCS
node, you must enter the routing data manually.
StarKeeper II NMS Graphics System Guide, R10.0, Issue 1
Using Network Builder to Analyze Your Network
Table 9-2.
Error Conditions Listed in Database Validation Report —Continued
Error Message
Trunk "xxx" not included in design.
<reason> End Node 1 = xxx
Grp Name 1 = yyy
Mod Addr 1 = nnn
End Node 2 = xxx
Grp Name 2 = yyy
Mod Addr 2 = nnn
Explanation and Response
The response to this message depends on the
reason listed in the message:
No group name found. This message may occur if
the Core System database contains some invalid
data. Check the database.
End node(s) previously rejected. This message
appears for each trunk attached to a node that was
rejected for either of the two reasons listed above. If
you enter the node data manually, you must
manually enter the trunks also.
Could not retrieve data. A communication problem is
preventing retrieval from the Core System database.
Determine the cause and correct it, then try to load
the data for this design again.
Mismatched far end node names or far end group
names. This message may occur if the Core System
database contains some invalid data. Check the
database.
Retrieved data is inadequate. No Group Name found
or unknown end node name. This message appears
if a trunk group name has not been assigned to the
trunk group at both ends.
End node(s) not found. This message appears if one
or both nodes attached to this trunk group have been
rejected.
Trunk "ttt": Group Name at end node
= "xxx" is blank.
Connectivity Analysis tool assigns
unique Trunk Group Name to
permit evaluation to continue
without losing connectivity. End
Node 1 = xxx
Grp Name 1 = tgrp_n ** Assigned
unique name
Mod Addr 1 = nnn
End Node 2 = xxx
Grp Name 2 = yyy
Mod Addr 2 = nnn
One of the nodes does not have a trunk group name
assigned for the indicated trunk group. The program
has assigned a name so that processing can
continue. You may need to enter the trunk group
name manually.
StarKeeper II NMS Graphics System Guide, R10.0, Issue 1
9-27
Using Network Builder to Analyze Your Network
Table 9-2.
Error Conditions Listed in Database Validation Report —Continued
Error Message
Invalid Network Model at "xxx" level.
Connectivity Analysis tool assigns
unique addresses to nodes to
permit the evaluation to continue.
"xxx" level addresses in the design
are reported below:
Node Name Existing Address
Design Address
<name> <old address>
<new
address>
NOTE
One or more trunks have been
rerouted by Session Maintenance.
Topology and routing may need to
be edited to rectify entries for trunk
groups named "!routed!" in this
design.
Using default routing for destination
= "xxx"
Source = "xxx" Primary = "xxx"
Secondary = "xxx"
C.
Edit Input Data
Explanation and Response
At the level selected for use in the design, the
network contains duplicate addresses. New
addresses have been generated for Connectivity
Analysis. Each node is listed by name, with the old
address and the new address shown. Check the
topology and routing; you may need to enter this
information manually.
Use the input edit data panes to correct the trunk
groups and routing data.
Appears when no routing exists for a destination, but
default routing can be used. Check that the default
routing assignment is correct.
0
Use the View menus to review the input data that was loaded from the database.
9-28
1.
The end of the Node Address and Topology Input report contains a network
connectivity validation section. Verify that the network is connected before
running the Topology Evaluation tool.
2.
If the Node Address and Topology Input report states that the network is
disconnected, examine the subnetwork listings in the report to determine
where trunks are missing. Check the Database Validation report to see
whether data was lost or rejected during the load, and take corrective
action as needed; or add the missing trunks using the Topology input data
pane.
3.
A distinction can be made in a design between nodes that are connected to
two or more nodes, and nodes that are connected to only one other node
called leaf nodes. In some cases, it may be worthwhile to exclude the leaf
nodes from the analysis. This can simplify the network topology, reduce the
size of the input and output reports, and eliminate trivial data.
StarKeeper II NMS Graphics System Guide, R10.0, Issue 1
Using Network Builder to Analyze Your Network
■
If you are using data from the StarKeeper II NMS Core System
database, you can use the Choose Nodes option to limit the
analysis (see Procedure 9-2). Just choose non-leaf nodes from the
node address list; the leaf nodes and their associated trunks will not
be loaded into the design.
■
If you are entering the design rather than loading it from the
database (using the From Empty choice), enter all the nodes and
trunk groups except the leaf nodes.
When you are satisfied that the input data is complete, you are ready to run
Topology Evaluation.
D.
Run Topology Evaluation
0
Run the Topology Evaluation tool to evaluate the network topology for dead-end
paths, call-looping paths, and call-blocking paths (if desired). This tool enables
you to create a set of routing patterns that are free of those errors for the entire
network.
1.
Choose Topology Evaluation from the Run menu.
The Run: Topology Evaluation command window appears.
Screen 9-7.
Run Topology Evaluation Command Window
StarKeeper II NMS Graphics System Guide, R10.0, Issue 1
9-29
Using Network Builder to Analyze Your Network
2.
Decide whether to set either, both, or neither of the two options for this
command:
■
Evaluate for Node Diversity
If you use this option, the analysis will check paths for node diversity.
This can yield routing that is robust in spite of any single node
failure.
■
Evaluate Using Extended Routing
If you use this option, the analysis will consider whether each node
should use the extended routing algorithms. Extended routing
includes two components: crankback and route advance. Crankback
occurs when a call is dropped back to the originating node to try an
alternate path due to a trunk group or node failure. Route advance
occurs when a call cannot be routed normally from a node, and the
route advance algorithm is used to find an alternate trunk. If you do
not use this option, the analysis does not use extended routing, and
the Extended Routing Recommendations report recommends
disabling extended routing at all nodes.
3.
Choose
4.
If the design contains any unconnected nodes, the tool will display the
following error message in the base window footer:
OK
.
Disconnected Network - View Node Address and Topology Input Report
E.
5.
If no errors occur, the Connectivity Analysis tool displays a completion
message in the left footer area of the base window. Then use the Topology
Evaluation Report item on the View menu to call up the sub-menu of
output reports.
6.
Review the topology evaluation output reports to perform an initial analysis
of the network configuration.
■
If the Destination Routing report indicates that errors were found in
the routing, you will need to perform “What If...” analysis to work out
error-free routing. For instructions, see Procedure 9-4.
■
If the Destination Routing report states that error-free routing is
available for this network, you can run Path Analysis.
Run Path Analysis
0
Once the Topology Evaluation tool produces error-free routing, you can run the
Path Analysis tool to analyze paths from source to destination addresses in
normal and failure scenarios. The Path Analysis tool performs its analysis on all
possible paths between a source address and a destination address that you
specify.
9-30
StarKeeper II NMS Graphics System Guide, R10.0, Issue 1
Using Network Builder to Analyze Your Network
The information from the Path Analysis reports can help in optimizing the network
configuration, and in finding areas of the network that are vulnerable to failures.
It is not necessary to run the Path Analysis tool for all source and destination
addresses. Generally, you would want to run it for one of the following reasons:
■
troubleshooting
In case of a problem in an operating network, you can load the network
configuration from the StarKeeper II NMS Core System database into a
design. If there are any topology or routing errors, they must be corrected
before the Path Analysis tool will run. It may be productive to see whether
those errors played any part in the trouble you are investigating.
Once error-free routing patterns are generated, run the Path Analysis tool
for the nodes where trouble is occurring. By examining the Detailed Path
Analysis reports, you may be able to isolate possible problem sources in
the alternate paths used under failure conditions.
■
important applications
In many cases, you know in advance that certain traffic is subject to
stringent requirements (such as protocol timeouts) that require it to be
carried only on specific trunk types, or limited to a certain number of hops.
You can use the Detailed Path Analysis reports to examine which trunk
groups may be used, and how many hops may be needed; if necessary,
you can change the routing to make certain that this traffic is routed to
trunk groups with the proper trunk types.
0
Constraints
■
The Path Analysis tool can run only if the topology evaluation is error-free.
To confirm this, examine the Destination Routing report, and make sure
that the Source Routing report was produced.
■
You must specify the correct input source for the routing data. After running
topology evaluation, be sure to specify whether to use Topology Evaluation
or Node-Diverse Topology Evaluation.
Use the following steps:
1.
Choose Path Analysis from the Run menu.
StarKeeper II NMS Graphics System Guide, R10.0, Issue 1
9-31
Using Network Builder to Analyze Your Network
The Run: Path Analysis command window is displayed.
Screen 9-8.
2.
Run Path Analysis Command Window
Choose the settings and data values for this run:
Field Name
Description
Analysis Mode
Exclusive setting. Node Failure, Trunk Group Failure. Choose the
setting for the type of path analysis you want performed.
Input Source
Exclusive Setting. Routing Evaluation, Node-Diverse Routing
Evaluation, Topology Evaluation, Node-Diverse Topology
Evaluation. If you ran the topology evaluation with the node
diversity option, use Node-Diverse Topology Evaluation; otherwise,
use Topology Evaluation. (Topology Evaluation is the default.)
Destination
Address
Select the proper entry from the scrolling list.
Source Address
Select the proper entry from the scrolling list.
NOTE:
If you plan to run Path Analysis for several source and destination
addresses, you can speed up data entry for this command by pinning the
command window.
9-32
StarKeeper II NMS Graphics System Guide, R10.0, Issue 1
Using Network Builder to Analyze Your Network
3.
Choose OK . The button displays a busy pattern until the analysis
completes.
4.
Choose Path Analysis Report from the View menu to call up the Path
Analysis sub-menu.
Use the Path Analysis reports to study the effect of node or trunk group
failure on the routing paths to the chosen destination address. For
information about the report layouts and contents, see Output Reports in
Connectivity Analysis Input and Output Data.
The menu offers two choices:
Summary
The Summary Path Analysis report shows overall information that
applies to all of the paths. The same information also appears in the
header of the detailed report.
Detailed
The Detailed Path Analysis report shows how each path works under
node failure and trunk group failure conditions.
5.
Choose which report you want to display. The report appears on the
Graphics System display screen.
NOTE:
The Path Analysis reports apply to just one source address and one
destination address. A separate path analysis run is required for each pair
of nodes you want to analyze.
F.
Interpret the Results
0
Review the Path Analysis output reports to complete your initial analysis of the
network configuration.
■
If your review of the reports indicates the need to change the network, you
can perform “What If...” analysis to examine the effect of various changes.
For instructions, see Procedure 9-4.
■
If the Path Analysis report indicates acceptable performance for this
network, the connectivity analysis is finished.
StarKeeper II NMS Graphics System Guide, R10.0, Issue 1
9-33
Using Network Builder to Analyze Your Network
0
G. Save the Results
You can save the current design at any time. To save a design, do the following:
1.
Choose the Save Design command from the File menu.
The File: Save Design command window appears.
Screen 9-9.
2.
You can use the design name you originally assigned to this design, or
change it in the Design Name field.
3.
Choose
4.
If you try to save a design with the same name as an existing saved design,
a notice is displayed:
Screen 9-10.
9-34
File: Save Design Command Window
OK
.
Save Design Notice
StarKeeper II NMS Graphics System Guide, R10.0, Issue 1
Using Network Builder to Analyze Your Network
■
To save the design in the existing files, choose
■
To preserve the existing files (and not save the current design),
choose Cancel .
Overwrite
.
You can retry the Save Design command using a different name.
H.
Evaluating Designs in Parallel
0
If you want to compare the effect of making different changes concurrently to the
same design:
1.
Save the current design using a different name than the current one (if you
have assigned a name to it).
2.
Run Connectivity Analysis by invoking it from the Network Builder Control
Window.
3.
From the new Connectivity Analysis Base Window, load the saved design
using its new name.
This allows you to compare reports side-by-side on the screen, for example, and
more quickly judge the effect of changes.
I.
Implement the Recommendations
0
Topology Evaluation produces the recommended routing patterns in the Source
Routing reports, and extended routing recommendations in the Destination
Routing and Extended Routing Recommendation reports. To implement the
recommended routing patterns and extended routing, they must be entered
separately for each node in the network. This can be done through Network
Builder configuration tasks. See Chapter 8 for instructions.
Analyze an Existing Network
This procedure shows how to perform the following tasks:
■
Create a design from an existing network or load an existing design.
■
Run Routing Evaluation to check the existing routing.
■
Run Path Analysis to check call routing from point to point in the network.
■
Interpret the results of the analysis.
■
Save the results.
■
Implement the recommendations.
StarKeeper II NMS Graphics System Guide, R10.0, Issue 1
9-35
Using Network Builder to Analyze Your Network
NOTE:
If you are analyzing an existing network, but you want to ignore the existing
routing patterns, use Procedure 9-2.
Before you begin this procedure, you must first start Network Builder and invoke
the Connectivity Analysis tools, as instructed in Procedure 9-1.
Procedure 9-3.
A.
Analyze an Existing Network
0
Create or Load Design
1.
If you are analyzing the configuration of an existing network that has not
been analyzed before, and the StarKeeper II NMS Core System database
contains the configuration for this network, perform step A. Create a New
Design in Procedure 9-2. Be sure to specify "From Database" for the Input
Source.
After creating the new design, continue this procedure at step B. Run
Routing Evaluation.
B.
2.
If the existing network has been analyzed previously, and a design already
exists, choose Load Design from the File menu.
3.
Enter the design name, or use the abbreviated Choose button and choose
the design name from the list.
4.
Use the
Load Design
Run Routing Evaluation
button to load the data for the design.
0
If you want to evaluate the existing routing patterns in the network, use the
Routing Evaluation tool as explained here.
0
Constraints
If any node addresses are non-unique at the level used for analysis, routing data
is not loaded into the design, and the Routing Evaluation tool generates new
routing. You can find out if this error occurred in the Database Validation report.
1.
9-36
Choose Routing Evaluation from the Run menu.
StarKeeper II NMS Graphics System Guide, R10.0, Issue 1
Using Network Builder to Analyze Your Network
The Run: Routing Evaluation command window is displayed.
Screen 9-11.
2.
Run Routing Evaluation Command Window
Decide whether to set either, both, or neither of the two options for this
command:
■
Evaluate for Node Diversity
If you use this option, the analysis will check paths for node diversity.
This can yield routing that is robust in spite of any single node
failure.
■
Evaluate Using Extended Routing
If you use this option, the analysis will consider whether each node
should use the extended routing algorithms. Extended routing
includes two components: crankback and route advance. Crankback
occurs when a call is dropped back to the originating node to try an
alternate path due to a trunk group or node failure. Route advance
occurs when a call cannot be routed normally from a node, and the
route advance algorithm is used to find an alternate trunk. If you do
not use this option, the analysis does not use extended routing, and
the routing recommendations recommend disabling extended
routing at all nodes.
3.
Fill in the Destination Address field.
StarKeeper II NMS Graphics System Guide, R10.0, Issue 1
9-37
Using Network Builder to Analyze Your Network
Field Name
Destination
Address
C.
Description
Select the proper entry from the scrolling list.
4.
Choose the
5.
After the routing evaluation is complete, call up the menu of reports by
choosing Routing Evaluation Report from the View menu.
6.
The Routing Evaluation reports show the results of analyzing the routing
for the specified destination address. Use this information to eliminate
routing errors or to reduce the vulnerability of the routing to failures. For
information about the report layouts and contents, see Output Reports in
Connectivity Analysis Input and Output Data.
OK
button.
■
If the Routing Evaluation reports indicate routing errors, and no
routing recommendation can be made, you will need to perform
“What If...” analysis to work out error-free routing. For instructions,
see Procedure 9-4.
■
If the reports indicate that the Routing Evaluation tool generated
error-free routing, you can run the Path Analysis tool.
■
If the Routing Evaluation tool found no routing errors in the existing
routing, you can run the Path Analysis tool.
Run Path Analysis
0
Once the Routing Evaluation tool produces an error-free routing, you can run the
Path Analysis tool. If you want to run Path Analysis, follow the instructions for step
E. Run Path Analysis in Procedure 9-2, but specify Routing Evaluation (or
Node-Diverse Routing Evaluation) as the input source.
D.
Interpret the Results
0
When the Path Analysis tool completes its processing, you can view the Path
Analysis reports. Review these reports to complete your initial analysis of the
network configuration.
9-38
■
If your review of the reports indicates the need to change the network, you
can perform “What If...” analysis to examine the effect of various changes.
For instructions, see Procedure 9-4.
■
If the Path Analysis reports indicate acceptable performance for this
network, the connectivity analysis is finished.
StarKeeper II NMS Graphics System Guide, R10.0, Issue 1
Using Network Builder to Analyze Your Network
E.
Save the Results
0
To save the results of analysis, follow the instructions for step G. Save the
Results in Procedure 9-2.
F.
Implement the Recommendations
0
Routing Evaluation produces extended routing recommendations in the
Destination Routing reports, and recommended routing patterns in the Source
Routing reports. To implement the recommended routing patterns and extended
routing, they must be entered separately for each node in the network. This can
be done through Network Builder configuration tasks. See Chapter 8 for
instructions.
Perform ''What If...'' Analysis
This procedure explains how to analyze changes to a network after conducting an
initial analysis. It covers changes to add or delete nodes, add or delete trunks, and
change routing. The procedure includes the following steps:
■
Load the design to be analyzed.
■
Determine whether to modify the design.
■
Re-run an analysis with extended routing.
■
Add a trunk to the design.
■
Run Path Analysis.
■
Interpret Path Analysis reports.
■
Save the results.
■
Implement the recommendations.
0
Assumptions
This procedure is based on the following assumptions:
■
You are familiar with Procedures 9-2 and 9-3.
■
The network being changed has been analyzed with the Topology
Evaluation or Routing Evaluation tools, using Procedure 9-2 or 9-3.
Before you begin this procedure, you must first start Network Builder and invoke
the Connectivity Analysis tools, as instructed in Procedure 9-1.
StarKeeper II NMS Graphics System Guide, R10.0, Issue 1
9-39
Using Network Builder to Analyze Your Network
Procedure 9-4.
A.
Perform ''What If...'' Analysis
Load the Design to be Analyzed
0
If you are analyzing the current design, this step is not needed; go to step B:
Determine Whether to Modify Design.
If you are not analyzing the current design, you must either load a saved design
containing the configuration to be changed, or create a new design from data from
the StarKeeper II NMS Core System database.
B.
■
If the design you want to analyze has been saved from an earlier run, use
Load from the File menu to load it, then use it as the current design.
■
If the existing network configuration corresponds to the design you want to
analyze, you can create a new design and load data from the StarKeeper II
NMS Core System database.
■
If you wish, you can create a new design From Empty.
Determine Whether to Modify Design
0
Once you have a current design loaded, decide whether to make modifications,
and what to modify, based on the situation.
— If you ran the Topology Evaluation tool with the Evaluate Using Extended
Routing option off, you will find recommendations for correcting errors in
the Destination Routing report.
— If you ran the Routing Evaluation tool with the Evaluate Using Extended
Routing option off, this information is in the Routing Errors report.
In both cases, the possible recommendations include:
— Re-run the tool, with the Evaluate Using Extended Routing option on.
— Add one or more trunk groups to the configuration.
You can follow either recommendation.
9-40
■
If you decide to re-run the Topology Evaluation or Routing Evaluation tool
with the Evaluate Using Extended Routing option on, proceed to Step C.
■
If you decide to add a trunk group, proceed to Step D.
■
If you ran the Routing Evaluation or Routing Evaluation tool with the
Evaluate Using Extended Routing option on, the only method
recommended for correcting connectivity errors is to add trunks. Proceed
to Step D.
StarKeeper II NMS Graphics System Guide, R10.0, Issue 1
Using Network Builder to Analyze Your Network
C.
Re-Run with Extended Routing
0
If you decide to re-run the Topology Evaluation or Routing Evaluation tool with the
Evaluate Using Extended Routing option on, do so; then repeat this procedure,
starting at Step B, until error-free routing is generated.
D.
Add a Trunk
0
If you decide to add a trunk and re-run the Topology Evaluation or Routing
Evaluation tool, use the following method:
1.
Review the output reports and choose the most important destination in the
network, such as a main data center site, and look at the recommendations
for that destination.
If the network does not have a preferred destination, choose the
recommendation that occurs most frequently.
2.
Add one trunk group to the design as instructed for the destination you
have chosen.
3.
Re-run the tool.
When the re-run is completed, examine the output report to see if any errors were
found:
■
After re-running the Topology Evaluation tool, review the Destination
Routing report.
■
After re-running the Routing Evaluation tool, review the Routing Errors
report.
If the report indicates further errors, repeat this procedure, starting at Step B, until
error-free routing is generated.
E.
Run Path Analysis
0
Once the Topology Evaluation or Routing Evaluation tool produces error-free
routing, you can run the Path Analysis tool. If you want to run Path Analysis, follow
the instructions for step E. Run Path Analysis in Procedure 9-2. Be sure to
specify the correct input source for the Path Analysis tool:
■
Topology Evaluation
■
Node-Diverse Topology Evaluation
■
Routing Evaluation
■
Node-Diverse Routing Evaluation
StarKeeper II NMS Graphics System Guide, R10.0, Issue 1
9-41
Using Network Builder to Analyze Your Network
F.
Interpret Path Analysis Reports
0
If the Path Analysis reports indicate potential problems with the routing patterns,
such as blocked paths or paths with too many hops, you may need to redesign the
network. Once you have planned the changes you want to make, proceed as
follows:
1.
Change the network topology or routing for specific destinations, and rerun the Topology Evaluation or Routing Evaluation tool. Then review the
output reports for errors.
If the tool finds routing errors, correct them according to the methods
explained in Step B of this procedure.
2.
G.
Once error-free routing is generated by either the Topology Evaluation or
Routing Evaluation tool, re-run the Path Analysis tool to see the effect of
the change. Continue this process until the Path Analysis reports are
satisfactory.
0
Save the results
To save the results of analysis, follow the instructions for step G. Save the
Results in Procedure 9-2.
H.
Implement the recommendations
0
To implement the recommended routing patterns and extended routing from the
Topology Evaluation or Routing Evaluation reports, they must be entered
separately for each node in the network. This can be done through Network
Builder configuration tasks.
9-42
StarKeeper II NMS Graphics System Guide, R10.0, Issue 1
Using Network Builder to Analyze Your Network
Connectivity Analysis Input and
Output Data
The StarKeeper II NMS Network Builder enables you to view the input to the
analysis tools, and the output that they generate, by using capabilities of the View
menu. This section explains the layout and contents of the viewable input and
output reports.
The analysis tools use directories in the StarKeeper II NMS Graphics System file
system to store this data. They are organized into a set of files for each design,
with current and saved versions stored separately. Each input or output report is
contained in a separate file.
Input Reports
The connectivity analysis input reports present the input data for viewing, printing,
and saving to files. They are accessed through the View menu. The reports are as
follows:
■
Node Address and Topology Input
■
Routing Input
■
Database Validation
StarKeeper II NMS Graphics System Guide, R10.0, Issue 1
9-43
Using Network Builder to Analyze Your Network
Node Address and Topology Input Report
0
The Node Address and Topology Input report presents the same information as
the Node Address input and Topology input data panes. The header control area
of the report viewing window contains a Report Version field. The report format is
as follows:
NODE ADDRESS & TOPOLOGY INPUT REPORT
Created: 02/09/98 14:42
Design Name: design_10
Total Nodes: 4
=============================================
Node
Extended
Node
Address
Routing
Name
--------------------------------------------beans2
enabled
us/gold/beans2/node_F
beans3
enabled
us/gold/beans3/node_G
beans4
enabled
us/gold/beans4/hubnode
beans5
enabled
us/gold/beans5/new_node
=============================================
Total Trunk Groups: 5
==============================================
End Node 1
End Node 2
Address
Trunk group
Trunk Group
Address
---------------------------------------------beans2
g1007
g1006
beans3
beans2
g1009
g1006
beans4
beans2
g1010
g1006
beans5
beans3
g1009
g1007
beans4
beans4
g1010
g1009
beans5
==============================================
NETWORK CONNECTIVITY VALIDATION
The network is connected.
==============================================
Screen 9-12.
9-44
Node Address and Topology Input Report
StarKeeper II NMS Graphics System Guide, R10.0, Issue 1
Using Network Builder to Analyze Your Network
0
Routing Input Report
The Routing Input report contains the same information that is presented in the
Edit Routing data pane. The header control area of the report viewing window
contains two fields: the Report Version field and a Destination Address field. The
report format is as follows:
ROUTING INPUT REPORT
Created: 02/09/98 10:46
Design Name: net_2000
Destination Address: aus
Destination Node Name: us/test/aus/austin
Total Nodes: 10
Total Trunk Groups: 14
=========================================
Source Node
Primary
Secondary
Address
Trunk Group
Trunk Group
----------------------------------------atl
atl_ny
atl_mia
cin
cin_ok
(none)
den
den_aus
den_min
mia
mia_atl
mia_ny
min
min_ok
min_den
ny
ny_min
ny_cin
ok
ok_aus
ok_por
por
por_ok
por_min
sac
sac_den
sac_por
=========================================
Screen 9-13.
Routing Input Report
Database Validation Report
0
This report is produced when you create a new design from the database. It
indicates whether the network model is valid. It lists trunk groups that were
connected to more than one node at each end, nodes for which data could not be
StarKeeper II NMS Graphics System Guide, R10.0, Issue 1
9-45
Using Network Builder to Analyze Your Network
retrieved from the database, and any other data validation errors. The report
format is as follows:
DATABASE VALIDATION REPORT
Created: 02/09/98 14:38
Design Name: design_10
Address Type Preference: Mnemonic
=====================================================================
Valid Network Model at "Exchange" level
Trunk t5 not included in design.
Retrieved data is inadequate. No Group Name found.
End Node 1 = us/gold/east3/node_D
Grp Name 1 =
Mod Addr 1 = 58
End Node 2 = us/gold/beans3/node_G
Grp Name 2 = !routed!
Mod Addr 2 = 59
Trunk
not included in design
Retrieved data is inadequate. No Group Name found or unknown end node name
End Node 1 = us/gold/east3/node_D
Grp Name 1 =
Mod Addr 1 = 57
End Node 2 = us/gold/east2/node_C
Grp Name 2 =
Mod Addr 2 = 56
Trunk t6 not included in design
Mismatched far end node names or far end group names.
End Node 1 = us/gold/beans2/node_F
Grp Name 1 = !routed!
Mod Addr 1 = 61
End Node 2 = us/gold/beans3/node_G
Grp Name 2 = g1006
Mod Addr 2 = 60
Using default routing for destination = beans5
Source = east3
Primary = g1007Secondary = g1003
Using default routing for destination = beans5
Source = beans2
Screen 9-14.
9-46
Primary = g1003Secondary = g1007
Database Validation Report
StarKeeper II NMS Graphics System Guide, R10.0, Issue 1
Using Network Builder to Analyze Your Network
Output Reports
Each tool produces a set of analysis reports. The Topology Evaluation tool
generates the following reports:
■
Destination Routing
■
Trunk Group Use
■
Extended Routing Recommendations
■
Source Routing
The Routing Evaluation tool generates the following reports:
■
Routing Errors
■
Destination Routing
■
Source Routing
The Path Analysis tool generates the following reports:
■
Summary
■
Detailed
Topology Evaluation Reports
0
The Topology Evaluation reports are produced by the Topology Evaluation tool.
0
Destination Routing Report
This report shows the recommended routing patterns for all destination
addresses, from each source address. It contains a section for every destination
address in the network. The report also includes an extended routing
recommendation for each source address.
NOTE:
If you run Topology Evaluation without checking off the Evaluate Using
Extended Routing option, the extended routing recommendation field in
this report always states: "disabled."
The Destination Routing report indicates whether the network contains dead-end
paths, call-looping paths, or call-blocking paths. If any of these problems exist, the
report lists them, and recommends corrective actions.
If errors are found, and you ran Topology Evaluation without setting the Evaluate
Using Extended Routing option, the tool recommends that you re-run Topology
StarKeeper II NMS Graphics System Guide, R10.0, Issue 1
9-47
Using Network Builder to Analyze Your Network
Evaluation with the option. In addition, it may recommend adding trunk groups.
The report indicates where a trunk group may be needed.
The header control area of the report viewing window contains two fields: Node
Diversity and Report Version. This information also appears in the report. The
report is formatted as shown in the following example.
TOPOLOGY EVALUATION REPORT: DESTINATION ROUTING
Created: 02/02/98 10:50
Design Name: net_2000
Evaluated For Node Diversity: No
Evaluated Using Extended Routing: No
Total Nodes: 10
Total Trunk Groups: 14
=================================================================
Routing Table For Destination Address: atl
Destination Node Name: us/test/atl/atlanta
----------------------------------------------------------------Source Node
Address
Primary
Secondary
Extended
Trunk Group
Trunk Group
Routing
----------------------------------------------------------------mia
mia_atl
mia_ny
disable
ny
ny_atl
ny_mia
disable
sac
sac_den
sac_por
disable
.
.
----------------------------------------------------------------Dead Ends: 1
----------------------------------------------------------------Failed
Trunk Group
Final Hop In Dead End Path
----------------------------------------------------------------Recommendations:
Run "Topology Evaluation" again, using Extended Routing
Screen 9-15.
9-48
Topology Evaluation Report: Destination Routing
StarKeeper II NMS Graphics System Guide, R10.0, Issue 1
Using Network Builder to Analyze Your Network
0
Trunk Group Use Report
This report lists trunk groups that are not used in any of the routing
recommendations that the Topology Evaluation tool made. The header control
area of the report viewing window contains two fields: Node Diversity and Report
Version. This information also appears in the report. The report is formatted as
shown in the following example.
TOPOLOGY EVALUATION REPORT: TRUNK GROUP USE
Created: 02/02/98 14:38
Design Name: tg.unused
Evaluated For Node Diversity: No
Evaluated Using Extended Routing: Yes
Total Nodes: 3
Total Trunk Groups: 8
The following Trunk Groups are unused
===================================================
End Node 1
Address
End Node 2
Trunk Group
Trunk group
Address
--------------------------------------------------a1b2c3
gab3
ga13
abcdef
abcdef
g12b
gab2
123456
abcdef
g12c
gab3
123456
--------------------------------------------------Number of Unused Trunk Groups = 3
===================================================
Screen 9-16.
Topology Evaluation Report: Trunk Group Use
0
Extended Routing Recommendations Report
This report indicates whether to enable extended routing at each node to support
the recommended utility network routing. Unlike the Destination Routing report,
which gives extended routing recommendations for each destination
independently of other destinations, this report gives a coherent set of extended
routing recommendations for the entire network. If you are interested in the
routing for a subset of the nodes in the network, (rather than a utility network), use
the Destination Routing report rather than this one. To implement the extended
routing recommendations, extended routing must be enabled for each node
separately. You can use the Network Builder configuration tasks to do that.
StarKeeper II NMS Graphics System Guide, R10.0, Issue 1
9-49
Using Network Builder to Analyze Your Network
NOTE:
If you run Topology Evaluation without checking off the Evaluate Using
Extended Routing option, the extended routing recommendation field in
this report always states: "disabled."
The report is formatted as shown in the following example.
TOPOLOGY EVALUATION REPORT: EXTENDED ROUTING RECOMMENDATION
Created: 02/02/98 11:45
Design Name: net_2000
Evaluated For Node Diversity: No
Evaluated Using Extended Routing: Yes
Total Nodes: 10
Total Trunk Groups: 14
===========================================================
Source Node
Extended
Address
Routing
----------------------------------------------------------atl
enable
aus
enable
cin
disable
den
enable
mia
enable
min
enable
ny
enable
ok
enable
por
enable
sac
disable
===========================================================
Screen 9-17.
Topology Evaluation Report: Extended Routing
Recommendations
Source Routing Report
This report is available only if the topology evaluation produced an error-free set
of routing patterns. It contains a set of routing patterns, one for each source
address. The information in these tables is arranged so that it may be used to
update the routing patterns manually at each node. The header control area of the
report viewing window contains two fields: Node Diversity and Report Version.
9-50
StarKeeper II NMS Graphics System Guide, R10.0, Issue 1
0
Using Network Builder to Analyze Your Network
This information also appears in the report. The report is formatted as shown in
the following example.
TOPOLOGY EVALUATION REPORT: SOURCE ROUTING
Created: 02/03/98 13:13
Design Name: design_1
Evaluated For Node Diversity: No
Evaluated Using Extended Routing: No
Total Nodes: 6
Total Trunk Groups: 10
==================================================
Routing For Source Node Address: us
Node Name: us/beans/ci
-----------------------------------------------Destination
Node Address
Primary
Secondary
Trunk Group
Trunk Group
-----------------------------------------------node_1
trkusn1
trkusn2
node_2
trkusn2
trkusn1
node_3
trkusn3
trkusn4
node_4
trkusn4
trkusn2
node_5
trkusn5
trkusn1
-----------------------------------------------==================================================
Screen 9-18.
Topology Evaluation Report: Source Routing
Routing Evaluation Reports
0
The Routing Evaluation reports are produced by the Routing Evaluation tool.
0
Routing Errors Report
This report shows the errors in the routing for the specified destination address. It
lists dead-end paths, call-looping paths, and call-blocking paths. It also indicates if
a node does not have primary or secondary routing assigned, or if the primary
route does not meet the minimum hop criterion. This occurs when the route is
longer than the shortest possible path between the two nodes.
StarKeeper II NMS Graphics System Guide, R10.0, Issue 1
9-51
Using Network Builder to Analyze Your Network
The Routing Errors report provides recommendations for correcting any errors
found during the evaluation. If errors are found, and you ran Routing Evaluation
without setting the Evaluate Using Extended Routing option, the tool
recommends that you re-run Routing Evaluation with the option. In addition, it may
recommend adding trunk groups. The report indicates where a trunk group may
be needed.
9-52
StarKeeper II NMS Graphics System Guide, R10.0, Issue 1
Using Network Builder to Analyze Your Network
The header control area of the report viewing window contains three fields: Node
Diversity, Report Version, and Destination Address. This information also appears
in the report. The report is formatted as shown in the following example.
TOPOLOGY EVALUATION REPORT: SOURCE ROUTING
Created: 02/03/98 14:42
Design Name: design_10
Evaluated For Node Diversity: No
Evaluated Using Extended Routing: Yes
Total Nodes: 4
Total Trunk Groups: 5
=================================================================
Routing For Source Node Address: beans2
Source Node Name: us/gold/beans2/node_F
-------------------------------------Destination
Node Address
Primary
Secondary
Trunk Group
Trunk Group
-------------------------------------beans3
g1007
g1009
beans4
g1009
g1007
beans5
g1010
g1009
-------------------------------------Routing For Source Node Address: beans3
Source Node Name: us/gold/beans3/node_G
-------------------------------------Destination
Node Address
Primary
Secondary
Trunk Group
Trunk Group
-------------------------------------beans2
g1006
g1009
beans4
g1009
g1006
beans5
g1006
g1009
-------------------------------------Routing For Source Node Address: beans4
Source Node Name: us/gold/beans4/hubnode
-------------------------------------Destination
Node Address
Screen 9-19.
Primary
Secondary
Trunk Group
Trunk Group
Routing Evaluation Report: Routing Errors
StarKeeper II NMS Graphics System Guide, R10.0, Issue 1
9-53
Using Network Builder to Analyze Your Network
If the report contains dead-end paths, it lists the total number of dead-end paths
first, then identifies each one. Each dead-end path is listed on a line containing
the failed trunk group that caused the dead end, and the final hop in the path
leading to the dead end. The Final Hop In Dead End Path field contains the node
address where the final hop started, and an arrow leading to the node where the
path dead-ended.
The arrow is marked with the trunk group name that was used, as in this example:
Final Hop In Dead End Path
--------------------------------
If the final hop in a dead-end path goes to a leaf node, the trunk group name
appears as "(none)" in the report.
Destination Routing Report
This report shows recommended routing patterns for a specific destination
address, from each source address.
NOTE:
If you run Routing Evaluation without checking off the Evaluate Using
Extended Routing option, the extended routing recommendation field in
this report always states: "disabled."
9-54
StarKeeper II NMS Graphics System Guide, R10.0, Issue 1
0
Using Network Builder to Analyze Your Network
The header control area of the report viewing window contains three fields: Node
Diversity, Report Version, and Destination Address. This information also appears
in the report. The report is formatted as shown in the following example.
ROUTING EVALUATION REPORT: DESTINATION ROUTING
Created: 02/02/98 13:38
Design Name: net_2000
Destination Address: aus
Destination Node Name: us/test/aus/austin
Evaluated For Node Diversity: No
Evaluated Using Extended Routing: Yes
Total Nodes: 10
Total Trunk Groups: 14
=======================================================
Routing Table For Destination Address: aus
------------------------------------------------------Source Node
Address
Primary
Secondary
Trunk Group
Trunk Group
Extended
Routing
------------------------------------------------------den
den_aus
den_min
disable
ok
ok_aus
ok_min
disable
min
min_den
min_ok
enable
sac
sac_den
sac_por
disable
cin
cin_ok
cin_ny
disable
por
por_ok
por_min
disable
ny
ny_min
ny_cin
enable
atl
atl_ny
atl_mia
enable
mia
mia_ny
mia_atl
enable
------------------------------------------------------=======================================================
Screen 9-20.
Routing Evaluation Report: Destination Routing
0
Source Routing Report
This report contains routing recommendations for the specified source address,
ordered by destination address. The contents of this report depend on the extent
and type of errors found in the existing routing:
StarKeeper II NMS Graphics System Guide, R10.0, Issue 1
9-55
Using Network Builder to Analyze Your Network
■
If the Routing Evaluation tool finds errors and cannot generate error-free
routing, it does not produce this report. The base window message
indicates that errors were detected and no routing is recommended. In that
case, refer to the Routing Errors report.
■
If the Routing Evaluation tool finds errors, but it can generate error-free
routing, this report contains recommendations for making changes to the
existing routing to correct the errors that were found. Those parts of the
existing routing that are already free of errors are not listed in this report.
■
If the Routing Evaluation tool determines that the existing routing is already
error-free, this report contains no recommendations for making changes.
The report detail area contains a statement that the routing input has no
errors.
The Source Routing report is formatted as shown in the following example.
ROUTING EVALUATION REPORT: SOURCE ROUTING
Created: 02/03/98 14:42
Design Name: design_10
Evaluated For Node Diversity: No
Evaluated Using Extended Routing: Yes
Total Nodes: 4
Total Trunk Groups: 5
=====================================================================
Routing For Source Node Address: magic4
Source Node Name: us/beans/magician/hubnode
------------------------------------------------------------------Destination
Node Address
Primary
Secondary
Trunk Group
Trunk Group
Remarks
------------------------------------------------------------------magic2
g1006
g1007
magic3
(none)
(none)
** Routing evaluation not run
magic5
(none)
(none)
** Routing evaluation not run
=====================================================================
Note: "(none)" indicates that no Trunk Group is recommended.
See remarks for explanation.
Screen 9-21.
9-56
Routing Evaluation Report: Source Routing
StarKeeper II NMS Graphics System Guide, R10.0, Issue 1
Using Network Builder to Analyze Your Network
0
Path Analysis Reports
The Path Analysis reports are produced by the Path Analysis tool.
0
Summary Report
This report contains a summary of the information from the path analysis. The
header control area of the report viewing window contains the Report Version
field. This information also appears in the report. The report is formatted as shown
in the following example.
PATH ANALYSIS REPORT: SUMMARY ANALYSIS
Created: 02/03/98 13:44
Design Name: design_2
Destination Address: mj1
Destination Node Name: us/duster/mj1/usnode01
Source Address: mj3
Source Node Name: us/duster/mj1/usnode03
Analysis Mode: Trunk Groups Failure
Input Source: Topology Evaluation
Total Nodes: 3
Total Trunk Groups: 3
===================================================================
Maximum Hops: 1 (Normal Operation)
Maximum Hops: 2 (Failure Mode)
Completed Paths: 3
Blocked Paths: 1
Crank-Back Paths: 0
===================================================================
Screen 9-22.
Path Analysis Summary Report
StarKeeper II NMS Graphics System Guide, R10.0, Issue 1
9-57
Using Network Builder to Analyze Your Network
0
Detailed Report
This report includes the same information as the Summary Report, plus detailed
routing paths. The header control area of the report viewing window contains the
Report Version field. The report is formatted as shown in the following example.
PATH ANALYSIS REPORT: DETAILED ANALYSIS
Created: 02/02/98 12:00
Design Name: net_2000
Destination Address: atl
Destination Node Name: us/test/atl/atlanta
Source Address: aus
Source Node Name: us/test/aus/austin
Analysis Mode: Node Failure
Input Source: Node Diverse Topology Evaluation
Total Nodes: 10
Total Trunk Groups: 15
=====================================================
Maximum Hops: 4 (Failure Mode)
Node Diversity: 100%
Completed Paths: 8
Blocked Paths: 0
Crank-Back Paths: 0
----------------------------------------------------Network Routing Paths:
FAILED
NODE ADDR
HOP
COUNT
PATH
STATUS
PATH
----------------------------------------------------sac
2
c
aus
ok
atl
----------------------------------------------------den
2
c
aus
ok
atl
----------------------------------------------------cin
2
c
aus
ok
atl
----------------------------------------------------mia
2
c
aus
ok
atl
-----------------------------------------------------
Screen 9-23.
9-58
Path Analysis Detailed Report
StarKeeper II NMS Graphics System Guide, R10.0, Issue 1
Using Network Builder to Analyze Your Network
The detailed part of this report shows the paths taken from the specified source to
the specified destination under failure conditions. The left-hand column of the
report lists each failure, while the rightmost column lists the path. The path is
denoted by the node addresses that it passes through. The center columns of the
report show the hop count for each path, and its status: completed (c), blocked
(b), or cranked-back (cb). If a path is route-advanced, this is indicated where it
occurs in the list of nodes in the path.
Input and Output Report Data Fields
The Connectivity Analysis reports contain many of the same data fields. For each
data field in Table 9-3, the "Field Name" column contains the name that appears
on the reports, either as a field label or a column heading. The "Reports" column
indicates which reports contain this information for each data field.
Both the Topology Evaluation tool and Routing Evaluation tool generate reports
titled "Destination Routing" and "Source Routing." If the same data field appears
in both versions of one of these reports, the table lists the report name, but not the
tool name. If a data field appears in only one version of one of the reports, the
table indicates whether it is generated by the Routing Evaluation (RE) or Topology
Evaluation (TE) tool.
Data fields that appear in the Summary Path Analysis report also appear in the
Detailed Path Analysis report. They are indicated by "Path Analysis" in the table.
Data fields listed as "Detailed Path Analysis" appear only in the Detailed Path
Analysis report.
Table 9-3.
Input and Output Report Data Fields
Field Name
Reports
Description
Analysis Mode
Path Analysis
This field indicates which failure mode was
chosen: trunk group failure or node failure.
Blocked Paths
Path Analysis
This field shows the number of blocked paths in
this path analysis.
Call Blocking
Paths
Destination
Routing (TE),
Routing Errors
This field lists the paths where call blocking
occurred in node diversity analysis.
Call Looping
Paths
Destination
Routing (TE),
Routing Errors
This column shows the list of nodes and trunks in
a loop, starting from the source address and
ending where the loop is closed.
Completed
Paths
Path Analysis
This field shows the number of completed paths
from source to destination in this path analysis.
Crank-Back
Paths
Path Analysis
This field shows the number of paths where
crank-back was needed to complete the call.
StarKeeper II NMS Graphics System Guide, R10.0, Issue 1
9-59
Using Network Builder to Analyze Your Network
Table 9-3.
Input and Output Report Data Fields —Continued
Field Name
9-60
Reports
Description
Created
All
This field contains the date and time when this
data was created or last modified.
Dead Ends
Destination
Routing (TE),
Routing Errors
This field shows the number of dead-end paths
found.
Design Name
All
This field shows the name assigned to this
design.
Destination
Node Address
Source Routing
This field shows the node address that is the
destination of the routing information displayed.
End Node 1
Address
Topology Input,
Trunk Group Use
This column lists the first node address for each
trunk group.
End Node 1
Trunk Group
Topology Input,
Trunk Group Use
This column lists the name of this trunk group in
the first node.
End Node 2
Address
Topology Input,
Trunk Group Use
This column lists the second node address for
each trunk group.
End Node 2
Trunk Group
Topology Input,
Trunk Group Use
This column lists the name of this trunk group in
the second node.
Evaluated For
Node Diversity
All output, except
Path Analysis
This field indicates whether the report is based
on node diversity analysis.
Evaluated
Using Extended
Routing
All output, except
Path Analysis
This field indicates whether the extended routing
algorithm was used in this analysis.
Extended
Routing
Node Address &
Topology Input,
Destination
Routing,
Extended Routing
Recommendations
In input, this column of the destination routing
pattern indicates whether extended routing is
enabled or disabled for each source address. In
output reports, it contains the recommendation
for extended routing.
Failed Node
Address
Destination
Routing (TE),
Routing Errors
This field shows the address of the failed node
which caused call-blocking paths in a node
diversity analysis.
Failed Node
Address
Detailed Path
Analysis
This column lists the address of the failed node in
the path analysis report generated by a node
failure analysis.
Failed Trunk
Group
Destination
Routing (TE),
Routing Errors
This column lists the failed trunk group causing
call-looping paths or dead ends.
Failed Trunk
Groups
Detailed Path
Analysis
This column lists the failed trunk groups (if any)
that were used for path analysis in trunk group
failure mode.
StarKeeper II NMS Graphics System Guide, R10.0, Issue 1
Using Network Builder to Analyze Your Network
Table 9-3.
Input and Output Report Data Fields —Continued
Field Name
Reports
Description
Final Hop in
Dead End Path
Destination
Routing (TE),
Routing Errors
This column shows the last hop in a dead-end
path found during topology or routing evaluation.
Hop Count
Detailed Path
Analysis
This column shows the number of hops for each
path.
Input Source
Path Analysis
This field shows whether the data used for path
analysis came from topology or routing
evaluation.
Maximum Hops
Path Analysis
This field shows the number of hops in the
longest path found in path analysis.
Node Address
Source Routing
This column lists the node addresses in
alphabetical order.
Node Diversity
Path Analysis
This field shows the percentage of paths that
were completed (in other words, that reached
their destinations in spite of a single node failure).
Node Name
Node Address &
Topology Input,
Source Routing
This column lists the node name for each node
address.
Number of Call
Blocking Paths
Destination
Routing (TE),
Routing Errors
This field shows the number of call-blocking
paths found during a node diversity analysis. It is
followed by a list of these paths.
Number of Call
Loops
Destination
Routing (TE),
Routing Errors
This field shows the number of call-looping paths
found in the analysis.
Path
Detailed Path
Analysis
This column lists the details of each path that was
found during analysis.
Path Status
Detailed Path
Analysis
This column lists the status of each path shown in
path analysis. It shows whether the call is
completed (c), blocked (b), or cranked back (cb).
Primary Trunk
Group
Routing Input,
Destination
Routing, Source
Routing
This column lists the primary trunk group for each
routing assignment from a source address to a
destination address.
Routing For
Source Address
Source Routing
This field shows the address of the node for
which this source routing pattern has been
generated.
Routing Table
For Destination
Address
Destination
Routing
This field shows the address of the node for
which this destination routing pattern has been
generated.
Secondary
Trunk Group
Routing Input,
Destination
Routing, Source
Routing
This column lists the secondary trunk group for
each routing assignment from a source address
to a destination address.
Source Node
Address
Destination
Routing
This column lists the source address for which
routing assignments have been generated in this
routing pattern.
StarKeeper II NMS Graphics System Guide, R10.0, Issue 1
9-61
Using Network Builder to Analyze Your Network
Table 9-3.
Input and Output Report Data Fields —Continued
Field Name
Reports
Description
Subnetwork
Node Address
and Topology
Input
This column lists the subnetwork number
assigned to each subnetwork in a disconnected
network.
Total Nodes
All
This field shows the total number of nodes in the
design.
Total Trunk
Groups
All
This field shows the total number of trunk groups
in the design.
Unused Trunk
Groups
Trunk Group Use
This column lists the trunk groups that were not
used in any of the paths in this topology
evaluation.
Using the Session Maintenance
Simulation Tool
This section explains how to use the Session Maintenance simulation tool to
analyze Node Reroute Tables (NRTs) created with the Network Builder
Configuration tools. The simulation tool makes use of windows that serve as input
screens that allow you to specify parameters for the simulation and then view the
results.
Session Maintenance Simulation User Interface
Controls
The Session Maintenance simulation tool Base Window control area has the
following layout:
Screen 9-24.
9-62
Session Maintenance Simulation Tool: Control Area
StarKeeper II NMS Graphics System Guide, R10.0, Issue 1
Using Network Builder to Analyze Your Network
The control area of the base window contains four buttons. Their functions are as
follows:
File
Displays a menu for choosing the type of data to use for
simulations.
Run
Performs a simulation using the data chosen with the File menu.
View
Displays a menu of output reports to view the output of a
simulation run.
Help
Displays help text on the screen.
0
The File Menu
The File menu presents a sub-menu for you to choose the input data source. It
has two options:
Load
This option gives you the following choices for loading data for the
simulation tool:
Use Committed
Data Only
Use committed data loaded from the StarKeeper II
NMS Core databases
Use Committed
and Pending
Data
Committed and pending data together make up the
entire network configuration as defined by data
available at this Graphics System. Note that pending
data from other StarKeeper II NMS workstations is
not available at this Graphics System.
Use Pending
Data Only
Use pending data that has been created by Network
Builder configuration Tasks
Reset The Reset option resets the Session Maintenance Simulation base
window controls. If you have not run a simulation from this base window,
it sets the controls to the default values. If you have run a simulation from
this base window, it sets the controls to the values used for the last
simulation.
StarKeeper II NMS Graphics System Guide, R10.0, Issue 1
9-63
Using Network Builder to Analyze Your Network
0
The Run Simulation Menu
The Run Simulation menu presents a sub-menu with a Simulation menu item
used to start simulation, using the parameters specified.
0
The View Menu
The View menu contains three choices of output reports to view:
Summary Report
Displays the Summary Report from a simulation run. This
report contains overall summary information for network
simulation as a whole.
Detailed Report
Displays the Detailed report from a simulation run. This
report contains the same information as the Summary
Report, plus descriptions of every path followed and results
for each request generated.
Engineering Data Contains calculations that are useful for understanding why
reroute path selections followed the paths shown in the
Detailed Report
For information on how to use the contents of these reports in configuring Session
Maintenance, refer to the node's Session Maintenance Guide.
Quitting the Session Maintenance Simulation
Tool
0
To quit using the Session Maintenance simulation tool, choose Exit from the File
menu.
Session Maintenance Simulation
Procedure
This procedure explains how to perform the following tasks:
9-64
■
Start the Session Maintenance simulation tool.
■
Load simulation data.
■
Choose a data source for the simulation.
■
Specify Run command parameters.
■
Specify node tuning data override values.
■
Start a simulation run.
■
View the output reports.
StarKeeper II NMS Graphics System Guide, R10.0, Issue 1
Using Network Builder to Analyze Your Network
0
Assumptions
The procedure assumes:
■
You are familiar with Session Maintenance concepts and terminology from
the node's Session Maintenance Guide.
■
The Network Builder application has been started as explained in
Procedure 9-1.
Procedure 9-5.
A.
Run Session Maintenance Simulation
Start Session Maintenance Simulation
0
Choose Session Maintenance Simulation from the Analyze menu of the
Network Builder Control Window. The Session Maintenance Simulation Base
Window appears. You can use the controls in this window to invoke Session
Maintenance simulation tool functions.
To quit the Session Maintenance simulation tool at any time, choose Exit from the
File menu.
B.
Load Simulation Data
0
Choose the Load item from the File menu on the Session Maintenance simulation
Base Window. The tool displays a sub-menu with the following options:
■
Use Committed Data Only
■
Use Pending Data Only
■
Use Committed and Pending Data
StarKeeper II NMS Graphics System Guide, R10.0, Issue 1
9-65
Using Network Builder to Analyze Your Network
C.
0
Choose Data Source
Choose the source to use for the simulation:
Field Name
Description
Use Committed
Data Only
Committed data includes node configuration data, trunk
configuration data, and node reroute tables (NRTs) loaded from the
StarKeeper II NMS Core System database. It represents the actual
network configuration.
Use Pending Data
Only
Use pending data only requires that all data for the simulation be in
the pending state. Pending data includes node data, trunk data,
and NRTs created by the Network Builder configuration tasks in
this Graphics System only. It has been entered using the
Network Builder Configuration tools, but not downloaded to the
StarKeeper II NMS Core System databases and to the nodes in the
network. You can use this choice to test a configuration before
putting Session Maintenance into service. All nodes and trunks in a
virtual subnetwork being operated on must be pending in order for
the simulation to be successful. Note that if there are any
committed nodes between pending trunks, those nodes must be
resubmitted as held before proceeding.
Use Committed
and Pending Data
This choice allows you to use both committed and pending data.
Choose one of the items on this sub-menu. This initiates data collection from the
data sources you chose from the menu. Once the data is loaded, the Session
Maintenance Simulation Base Window activates the Simulation menu item.
9-66
StarKeeper II NMS Graphics System Guide, R10.0, Issue 1
Using Network Builder to Analyze Your Network
Screen 9-25.
Session Maintenance Base Window after Load
StarKeeper II NMS Graphics System Guide, R10.0, Issue 1
9-67
Using Network Builder to Analyze Your Network
D.
Specify Run Command Parameters
0
Specify the following information:
Field Name
Failure Mode
Description
Exclusive setting. Sequential, Concurrent, Overlap. A sequential
mode simulation fails the chosen trunks one at a time, in sequence.
The simulation tool restores the network to its initial routing before
failing the next trunk in sequence.
A concurrent mode simulation fails all of the chosen trunks at the
same time, with the trunk failures detected in the order listed. Use
the concurrent mode to model simultaneous trunk failures.
An overlap mode simulation fails the chosen trunks in the order
listed, allowing enough time between failures for the effects of the
previous failure to be completed, but without restoring the network
between failures.
Fail All Trunks
Checkbox. This control appears only for sequential failure mode. If
checked, the simulation fails all trunks in the network in sequence.
Session
Maintenance
Trunks
This scrolling list appears if you have not checked the Fail All
Trunks checkbox. It lists the names of all the network trunks. Up to
ten trunks can be chosen from the list. If you choose a trunk
already in the Failed Trunks list, it is removed from that list.
Clear Failed Trunk
List
This button clears all trunks from the Failed Trunks list.
Failed Trunks
This list appears if you have not checked the Fail All Trunks
checkbox. It contains the list of trunks you chose from the list of
Session Maintenance trunks. Trunks appear on the list in the order
chosen, not in alphabetical order. The simulation tool will fail them
in the order listed.
Override Node
Tuning Data
This control provides access to other controls that allow you to
override node tuning parameters (but only for the current
simulation). If you check off this box, the window expands to add
more controls. Two parameters are affected by these controls:
• Additional Reroute Requests
• Reroute Bandwidth Reduction
9-68
StarKeeper II NMS Graphics System Guide, R10.0, Issue 1
Using Network Builder to Analyze Your Network
E. Specify Node Tuning Data Override Values 0
Specify the values for these controls as follows:
F.
Field Name
Description
Additional Reroute
Requests
Use these controls to specify the range of additional reroute
requests made by the primary node. If you specify a larger value
for the stop value than for the start value, the simulation uses a
series of values instead of a single one. Beginning at the start
value, it increases the percentage of additional reroute requests by
ten percent each time, until it reaches the stop value.
Reroute
Bandwidth
Reduction
Use these controls to specify the range of reroute bandwidth
reduction values the primary node will accept. If you specify a
larger value for the stop value than for the start value, the
simulation uses a series of values instead of a single one.
Beginning at the start value, it increases the reroute bandwidth
reduction value by ten percent each time, until it reaches the stop
value.
Start Simulation
0
Select Simulation from the Run menu to start the simulation.
G.
View Output Reports
0
Use the View menu in the Session Maintenance Simulation Base Window to
choose output reports for viewing.
Session Maintenance Simulation
Output Reports
The Session Maintenance simulation tool provides three reports based on the
results of running the Session Maintenance simulation tool.
■
Summary Report
■
Detailed Report
■
Engineering Data
Use the View menu in the Session Maintenance Simulation Base Window to
choose these reports for viewing.
StarKeeper II NMS Graphics System Guide, R10.0, Issue 1
9-69
Using Network Builder to Analyze Your Network
Summary Report
Screens 9-27 through 9-31 show four Summary reports. Each report represents
the output from a different type of simulation run:
■
sequential failure mode for all trunks
■
sequential failure mode for up to ten trunks
■
concurrent failure mode for up to ten trunks
■
overlap failure mode for up to ten trunks
In each report, the first column, "FAIL MODE," shows the chosen failure mode.
The second column, "FAILED TRUNKS," contains a list of the trunks that were
chosen to fail, or "ALL" if you chose sequential failure mode for all trunks. See
Table 9-4 for descriptions of the other data fields in each report.
0
Sequential Failure Mode, All Trunks Failed
When the simulation run uses node administered tuning parameters, the report
produces one row of information. The following screen is an example of output
from a sequential mode failure using "ALL".
SESSION MAINTENANCE SIMULATION: SUMMARY REPORT
Created: 02/03/98 07:35
FAIL
FAILED
MODE
TRUNKS
ADD'L BW
CS
CS
REQS REQS REQS SUCC AVG
REQS REDUC NEED SUCC SENT REJ
DEAD
%
HOPS
--------------------------------------------------------------------seq
ALL
Screen 9-26.
48
48
65
13
4
100%
1.96
Summary Report (Sequential, ALL)
Since the simulation used node administered tuning parameters, there is one row
of information for all the remaining columns that represents a compilation of the
outcome of routes for "ALL" the failed trunks.
Sequential Failure Mode, Selected Trunks Failed 0
The following screen is an example of a sequential mode failure using a list of five
trunks. This output is also based on a simulation that used node administered
tuning parameters. The five trunks are listed in column two.
9-70
StarKeeper II NMS Graphics System Guide, R10.0, Issue 1
Using Network Builder to Analyze Your Network
The single row of additional information for all the remaining columns represents a
compilation for all routes, given the five trunk failures.
SESSION MAINTENANCE SIMULATION: SUMMARY REPORT
Created: 02/03/98 09:27
FAIL
FAILED
MODE
TRUNKS
ADD'L BW
CS
CS
REQS REQS REQS SUCC AVG
REQS REDUC NEED SUCC SENT REJ
DEAD
%
HOPS
---------------------------------------------------------------------seq
samtra1
24
24
33
6
3
100%
1.96
lacsam
samtra2
chotra
chosam
Screen 9-27.
Summary Report (Sequential, List)
Concurrent Failure Mode
0
The following screen is an example of a concurrent mode failure using a list of two
trunks. For this simulation, the "Override Node Tuning Data" control was chosen,
and the following values were chosen for the override:
■
Additional Reroute Requests, 0 to 30%
■
Reroute Bandwidth Reduction, 0 to 20%
StarKeeper II NMS Graphics System Guide, R10.0, Issue 1
9-71
Using Network Builder to Analyze Your Network
The following screen includes twelve rows of output. This represents one row of
output per combination of tuning parameters. For example, for the two trunks
failed (lacsam and chotra) in the simulation shown in this screen, the first row
represents 0% Additional Reroute Requests and 0% Reroute Bandwidth
Reduction. Each additional row represents another combination of the parameters
that were overridden in the simulation.
SESSION MAINTENANCE SIMULATION: SUMMARY REPORT
Created: 02/03/98 09:30
FAIL
FAILED
MODE
TRUNKS
ADD'L BW
CS
CS
REQS REQS REQS SUCC AVG
REQS REDUC NEED SUCC SENT REJ
DEAD
%
HOPS
---------------------------------------------------------------------conc
lacsam
chotra
Screen 9-28.
9-72
0%
0%
10
8
10
0
2
80%
2.38
0%
10%
10
8
10
0
2
80%
2.38
0%
20%
10
8
10
0
2
80%
2.38
10%
0%
10
4
12
1
7
40%
2.00
10%
10%
10
4
12
1
7
40%
2.00
10%
20%
10
4
12
1
7
40%
2.00
20%
0%
10
4
13
1
8
40%
2.00
20%
10%
10
4
13
1
8
40%
2.00
20%
20%
10
4
13
1
8
40%
2.00
30%
0%
10
4
13
1
8
40%
2.00
30%
10%
10
4
13
1
8
40%
2.00
30%
20%
10
4
13
1
8
40%
2.00
Summary Report (Concurrent)
StarKeeper II NMS Graphics System Guide, R10.0, Issue 1
Using Network Builder to Analyze Your Network
0
Overlap Failure Mode
The following screen shows the Summary Report for a simulation using overlap
failure mode.
SESSION MAINTENANCE SIMULATION: SUMMARY REPORT
Created: 02/03/98 09:27
FAIL
FAILED
MODE
TRUNKS
ADD'L BW
CS
CS
REQS REQS REQS SUCC AVG
REQS REDUC NEED SUCC SENT REJ
DEAD
%
HOPS
---------------------------------------------------------------------ovrlp
samtra1
24
24
33
6
3
90%
1.96
lacsam
samtra2
Screen 9-29.
Summary Report (Overlap)
Session Maintenance Simulation Summary
Report Data Fields
0
Table 9-4 lists the data fields that appear in Summary reports, and explains the
contents of each field.
Table 9-4.
Session Maintenance Simulation Summary Report Fields
Field Name
Description
FAIL MODE
The failure mode field shows which failure mode was used, sequential
(Seq) or concurrent (Con), or overlap (Ovrlp).
FAILED TRUNKS
This field shows the list of trunks failed. If all the trunks were failed, this
field will say "ALL".
ADD'L REQTS
The additional requests field shows the percent of additional channel
sets requested. If "Override Node Tuning Data" was not chosen, this
field is left blank.
BW REDUC
The bandwidth reduction field shows the percent of reduced
bandwidth. If "Override Node Tuning Data" was not chosen, this field is
left blank.
CS NEED
The channel sets needed field shows the number of channel sets
needed. If this is for a single trunk failure it represents the number of
active channel sets on that trunk. Otherwise, it represents the sum of
all the active channel sets on all the chosen trunks.
CS SUCC
The channel sets successful field shows the number of channel sets
that were successfully rerouted.
StarKeeper II NMS Graphics System Guide, R10.0, Issue 1
9-73
Using Network Builder to Analyze Your Network
Table 9-4.
Session Maintenance Simulation Summary Report Fields —
Field Name
Description
REQS SENT
The requests sent field shows the number of reroute requests sent by
the primary node(s). This is a function of the number of channel sets
needed and the additional reroute request value.
REQS REJ
The requests rejected field shows the number of requests rejected at
the secondary node as being superfluous. These requests followed a
valid reroute path but other requests made it to the secondary node
first.
REQS DEAD
The requests dead field shows the requests that followed a path that
did not end up at the secondary node. A look at the detailed report
illustrates the reason.
SUCC %
The success percentage field shows the reroute success as a
percentage of the combination of the Additional Reroute Requests and
Reroute Bandwidth Reduction parameters for the specified trunks. If
any value in this column is less than 100%, it is preceded by a pound
sign (#). You can use this feature to quickly locate these values using
Find in the View window.
AVG HOPS
The average hops field shows the average number of hops.
Detailed Report
The following screen shows an example of Detailed report output.
FAILED
PRIMARY
SECONDARY
ADD'L
TRUNK
NODE
NODE
REQS
BW
CS
CS
REQS
REQS REQS
SUCC
SENT
REJ
REDUC NEED
SUCC
AVG
%
HOPS
DEAD
-----------------------------------------------------------------------------lacsam
lacylane samabala
REQUEST
RESULT
10%
NODE
10%
6
MODADDR
0
TRUNK
7
0
7
MODADDR
# 0%
0.00
NODE
-----------------------------------------------------------------------------1
no CS
lacylane
29
cholac
20
chong
3
no CS
lacylane
29
cholac
20
chong
5
no CS
lacylane
29
cholac
20
chong
6
insuf. BW
lacylane
27
lacgud2
7
no CS
lacylane
29
cholac
2
insuf. BW
lacylane
27
lacgud2
gudapati
4
insuf. BW
Screen 9-30.
lacylane
8
27
gudtra
9
gudapati
20
chong
9
gudapati
5
tranlee
lacgud2 anlee
View: Detailed Report
The detailed report consists of two parts for each trunk. In the upper part of the
report for each trunk, the first three columns give the trunk name, primary node,
and the secondary node. The remaining columns contain the same data fields as
9-74
StarKeeper II NMS Graphics System Guide, R10.0, Issue 1
Using Network Builder to Analyze Your Network
the Summary Report for a single trunk. The lower part of the Detailed report for
each trunk gives a description of the paths followed and the result for each
request generated. Table 9-5 contains summaries of the report fields contained
only in the Detailed report. For explanations of the report fields that also appear in
the Summary Report, see Table 9-4.
Session Maintenance Simulation Detailed Report
Fields
0
Table 9-5 lists the data fields that appear in the Detailed report and explains the
contents of each field.
Table 9-5.
Session Maintenance Simulation Detailed Report Fields
Field Name
Description
FAILED TRUNK
This field shows the trunk name of the failed trunk.
PRIMARY NODE
This field shows the name of the primary node.
SECONDARY NODE
This field shows the name of the secondary node.
Common fields
See Table 9-4 for the ADD'L REQS, BW REDUC, CS NEED, CS
SUCC, REQS SENT, REQS REJ, REQS DEAD, SUCC %, and
AVG HOPS fields.
REQUEST
The request field identifies the request number. There is a
maximum of 32, so a report may contain up to 32 request numbers.
The typical number of requests is about ten.
RESULT
The result field contains the status of the request. The values are
as follows:
acc = Accepted
rej = Rejected
insuf. BW = Insufficient Bandwidth
no CS = No Channel Sets
hop limit = Hop Limit
drop = Drop
NODE
This column shows the node name at one end of one trunk in the
path.
MODADDR
The module address column shows the module address of the
trunk in the first node.
TRUNK
This column shows the trunk group name.
MODADDR
The second module address column shows the module address of
the trunk in the second node.
NODE
This column shows the node name at the other end of the trunk.
StarKeeper II NMS Graphics System Guide, R10.0, Issue 1
9-75
Using Network Builder to Analyze Your Network
The last five fields in this table represent reroute paths. Each row represents a
hop. The reroute can include up to four hops, so each reroute path can include up
to four rows.
Engineering Data Report
The Engineering Data report is shown in the following screen. Table 9-6 contains
brief explanations of the data fields in the report. For more information about
applying the report data, refer to the node's Session Maintenance Guide.
SESSION MAINTENANCE ENGINEERING DATA
Created: 02/03/98 09:04
TRUNK
EXP. BW/
ACTIVE CHNLS/
NAME
ACTIVE CS
ACTIVE CS
TOTAL
STANDBY BW
REROUTE NODE
CONNECTIVITY
--------------------------------------------------------------------samtra2
855k
83
1674k
P=S
samtra1
466k
100
1908k
P=S
lacgud2
628k
121
3600k
P<S
chotra
530k
125
2120k
P<S
chosam
733k
100
3600k
P<S
cholac
728k
120
4360k
P<S
lacgud1
634k
92
3560k
P<S
lacsam
673k
83
3960k
P=S
gudtra
466k
110
1908k
P<S
--------------------------------------------------------------------
Screen 9-31.
9-76
View: Engineering Data Report
StarKeeper II NMS Graphics System Guide, R10.0, Issue 1
Using Network Builder to Analyze Your Network
Table 9-6.
Session Maintenance Simulation Engineering Data Report Fields
Field Name
Description
TRUNK NAME
This column shows the name of each Session Maintenance trunk
in the network.
EXP. BW / ACTIVE CS
The Expected Bandwidth / Active Channel Sets column contains
the ratio of expected bandwidth to active channel sets for each
trunk.
ACTIVE CHNLS /
ACTIVE CS
The Active Channels / Active Channel Sets column contains the
ratio of active channels to active channel sets for each trunk.
TOTAL STANDBY BW
The total standby bandwidth column shows the total standby
bandwidth for each trunk.
REROUTE NODE
CONNECTIVITY
This column indicates whether the primary node for this trunk has
greater or lesser connectivity than the secondary node (it normally
should have lesser connectivity). If the primary node has more, the
difference is shown in parentheses at the end of the row.
StarKeeper II NMS Graphics System Guide, R10.0, Issue 1
9-77
Using Network Builder to Analyze Your Network
Connectivity Analysis Example
This section contains an example of using the Connectivity Analysis tools to
analyze a network and improve the routing.
The net_2000 Network
The network for this example consists of ten nodes in cities across the United
States. The network layout is illustrated in the following figure.
por
mi
ny
cin
sac
den
ok
atl
aus
mia
Figure 9-1.
9-78
Example Network Layout
StarKeeper II NMS Graphics System Guide, R10.0, Issue 1
Using Network Builder to Analyze Your Network
The Network Topology
The Node Address & Topology Input report shows the list of node names and
trunks.
NODE ADDRESS & TOPOLOGY INPUT REPORT
Created: 02/02/98 10:46
Design Name: net_2000
Total Nodes: 10
==================================================
Node
Extended
Node
Address
Routing
Name
-------------------------------------------------atl
enabled
us/test/atl/atlanta
aus
disabled
us/test/aus/austin
cin
disabled
us/test/cin/cincinnati
den
disabled
us/test/den/denver
mia
enabled
us/test/mia/miami
min
disabled
us/test/min/minneapolis
ny
disabled
us/test/ny/newyork
ok
disabled
us/test/ok/oklahoma
por
enabled
us/test/por/portland
sac
disabled
us/test/sac/sacramento
==================================================
Total Trunk Groups: 14
==================================================
End Node 1
Address
End Node 2
Trunk Group
Trunk group
Address
--------------------------------------------------atl
atl_mia
cin
cin_ny
den
den_aus
aus_den
aus
den
den_min
min_den
min
min
min_ny
ny_min
ny
min
min_ok
ok_min
ok
ny
ny_atl
atl_ny
atl
Screen 9-32.
mia_atl
ny_cin
mia
ny
Node Address & Topology Input Report
StarKeeper II NMS Graphics System Guide, R10.0, Issue 1
9-79
Using Network Builder to Analyze Your Network
Initial Routing
The initial routing, based on the topology given in the following screen, is listed in
the Routing Input report.
ROUTING INPUT REPORT
Created: 02/02/98 10:46
Design Name: net_2000
Destination Address: aus
Total Nodes: 10
Total Trunk Groups: 14
================================================
Source Node
Primary
Secondary
Address
Trunk Group
Trunk Group
-----------------------------------------------atl
atl_ny
atl_mia
cin
cin_ok
(none)
den
den_aus
den_min
mia
mia_atl
mia_ny
min
min_ok
min_den
ny
ny_min
ny_cin
ok
ok_aus
ok_por
por
por_ok
por_min
sac
sac_den
sac_por
================================================
Screen 9-33.
Initial Routing Input Report
Initial Topology Evaluation
The initial Topology Evaluation finds several dead-end paths, as the following
screen shows (the last part of this report listing is omitted)
9-80
StarKeeper II NMS Graphics System Guide, R10.0, Issue 1
Using Network Builder to Analyze Your Network
.
TOPOLOGY EVALUATION REPORT: DESTINATION ROUTING
Created: 02/02/98 10:50
Design Name: net_2000
Evaluated For Node Diversity: No
Evaluated Using Extended Routing: No
Total Nodes: 10
Total Trunk Groups: 14
====================================================================
Routing Table For Destination Address: atl
-------------------------------------------------------------------Source Node
Address
Primary
Secondary
Extended
Trunk Group
Trunk Group
Routing
-------------------------------------------------------------------mia
mia_atl
mia_ny
disable
ny
ny_atl
ny_mia
disable
cin
cin_ny
cin_ok
disable
min
min_ny
(none)
disable
den
den_min
den_aus
disable
ok
ok_min
ok_cin
disable
por
por_min
por_ok
disable
aus
aus_ok
aus_den
disable
sac
sac_den
sac_por
disable
-------------------------------------------------------------------Dead Ends: 1
----------------------------------------------------- Failed
Trunk Group
Final Hop In Dead End Path
--------------------------------------------------------------------min-min_ny:ny-ny_min
den -------den_min--> min
--------------------------------------------------------------------Recommendations:
Run "Topology Evaluation" again, using Extended Routing
OR
Add a new trunk group between "min" & "cin"
Screen 9-34.
Destination Routing Report Shows Errors
StarKeeper II NMS Graphics System Guide, R10.0, Issue 1
9-81
Using Network Builder to Analyze Your Network
The analysis is re-run using the Evaluate Using Extended Routing option. This
results in generating error-free routing. The Source Routing report shows the
results.
TOPOLOGY EVALUATION REPORT: SOURCE ROUTING
Created: 02/02/98 11:44
Design Name: net_2000
Evaluated For Node Diversity: No
Evaluated Using Extended Routing: Yes
Total Nodes: 10
Total Trunk Groups: 14
========================================
Routing For Source Node Address: atl
Node Name: us/test/atl/atlanta
-------------------------------------Destination
Node Address
Primary
Secondary
Trunk Group
Trunk Group
-------------------------------------aus
atl_ny
atl_mia
cin
atl_ny
atl_mia
den
atl_ny
atl_mia
mia
atl_mia
atl_ny
min
atl_ny
atl_mia
ny
atl_ny
atl_mia
ok
atl_ny
atl_mia
por
atl_ny
atl_mia
sac
atl_ny
atl_mia
--------------------------------------
Screen 9-35.
9-82
Source Routing Report Gives Error-Free Routing
StarKeeper II NMS Graphics System Guide, R10.0, Issue 1
Using Network Builder to Analyze Your Network
Following the successful Topology Evaluation run, the user runs Path Analysis to
study the routing in the network. This analysis shows some blocked paths.
PATH ANALYSIS REPORT: DETAILED ANALYSIS
Created: 02/02/98 11:39
Design Name: net_2000
Destination Address: atl
Source Address: aus
Analysis Mode: Trunk Groups Failure
Input Source: Topology Evaluation
Total Nodes: 10
Total Trunk Groups: 14
===================================================================
Maximum Hops: 4 (Normal Operation)
Maximum Hops: 7 (Failure Mode)
Completed Paths: 32
Blocked Paths: 4
Crank-Back Paths:
------------------------------------------------------------------Network Routing Paths:
FAILED
TRUNK GROUPS
HOP
PATH
COUNT
STATUS PATH
------------------------------------------------------------------4
c
aus
ok
min
ny
atl
------------------------------------------------------------------atl-atl_mia
ny-ny_atl
4
b
(cb)
aus
den
min
ny
mia
-------------------------------------------------------------------
Screen 9-36.
Path Analysis Report Shows Blocked Paths
Next, the user re-runs Topology Analysis with the Evaluate for Node Diversity
option. This analysis shows the need to add a trunk, perhaps between the Atlanta
node and the rest of the network.
StarKeeper II NMS Graphics System Guide, R10.0, Issue 1
9-83
Using Network Builder to Analyze Your Network
TOPOLOGY EVALUATION REPORT: DESTINATION ROUTING
Created: 02/02/98 11:47
Design Name: net_2000
Evaluated For Node Diversity: Yes
Evaluated Using Extended Routing: Yes
Total Nodes: 10
Total Trunk Groups: 14
==================================================
Routing Table For Destination Address: atl
-------------------------------------------------Source Node
Address
Primary
Secondary
Trunk Group
Trunk Group
Extended
Routing
-------------------------------------------------mia
mia_atl
mia_ny
disable
ny
ny_atl
ny_mia
disable
cin
cin_ny
cin_ok
disable
.
---------------------------------------------------Node Diversity Failure
---------------------Number of Blocked Paths: 1
Blocked Path #1:
Failed Node Address: ny
----------------------sac -------sac_den-->
den -------den_min-->
min -------min_ok--->
ok --------ok_cin--->
cin
-----------------------------Recommendations:
Add a new trunk group between "cin" & "mia"
==================================================
Routing Table For Destination Address: aus
--------------------------------------------------
Screen 9-37.
9-84
Destination Routing Report with Node Diversity
StarKeeper II NMS Graphics System Guide, R10.0, Issue 1
Using Network Builder to Analyze Your Network
To decide what changes are needed, the user begins a “What If ...” analysis.
Performing ''What If ...'' Analysis
The user adds a trunk between Atlanta and Oklahoma City. The Topology
Evaluation re-run generates error-free routing.
TOPOLOGY EVALUATION REPORT: DESTINATION ROUTING
Created: 02/02/98 11:57
Design Name: net_2000
Evaluated For Node Diversity: Yes
Evaluated Using Extended Routing: Yes
Total Nodes: 10
Total Trunk Groups: 15
==========================================================
Error-Free Node_diverse routing
tables
are available for this network
View: Topology Evaluation: Source Routing
==========================================================
Routing Table For Destination Address: atl
---------------------------------------------------------Source Node
Address
Primary
Secondary
Trunk Group
Trunk Group
Extended
Routing
---------------------------------------------------------mia
mia_atl
mia_ny
disable
ok
ok_atl
ok_cin
disable
ny
ny_atl
ny_mia
disable
min
min_ok
min_ny
disable
aus
aus_ok
aus_den
disable
por
por_ok
por_min
disable
cin
cin_ny
cin_ok
disable
den
den_min
den_aus
disable
sac
sac_por
sac_den
disable
----------------------------------------------------------
Screen 9-38.
Destination Routing Report with Error-Free Routing
StarKeeper II NMS Graphics System Guide, R10.0, Issue 1
9-85
Using Network Builder to Analyze Your Network
As the Path Analysis Detailed report shows, this routing is also node-diverse, and
satisfies the user's concerns.
PATH ANALYSIS REPORT: DETAILED ANALYSIS
Created: 02/02/98 12:00
Design Name: net_2000
Destination Address: atl
Source Address: aus
Analysis Mode: Node Failure
Input Source: Node Diverse Topology Evaluation
Total Nodes: 10
Total Trunk Groups: 15
=====================================================
Maximum Hops: 4 (Failure Mode)
Node Diversity: 100%
Completed Paths: 8
Blocked Paths: 0
Crank-Back Paths: 0
-------------------------------------------------------------Network Routing Paths:
FAILED
NODE ADDR
HOP
COUNT
PATH
STATUS
PATH
-----------------------------------------------------sac
aus
ok
atl
2
c
-----------------------------------------------------den
aus
ok
atl
2
c
-----------------------------------------------------cin
aus
ok
atl
2
c
-----------------------------------------------------por
aus
ok
atl
2
c
"Path Status" Legend: c=completed; b=blocked; cb=cranked-back.
"Path" Legend: (cb)=crank-back path; (ra)=route advance point.
Screen 9-39.
9-86
Path Analysis Report with Node-Diverse Routing
StarKeeper II NMS Graphics System Guide, R10.0, Issue 1
Administering Network Monitor 0
10
This chapter explains the administrative tasks that you must perform before you
begin monitoring your network with Network Monitor. It explains the relationship
between maps and alarms; understanding this relationship is fundamental to
planning and building a map hierarchy.
The tutorial in this chapter illustrates the steps involved in building a map
hierarchy. The first phase of the tutorial describes how to plan a map hierarchy
and the second phase describes how to create network maps with Network
Monitor. The chapter concludes with instructions for defining user notices,
specifying which alarm filters to use, updating network maps, and distributing
maps to other Graphics Systems.
Figure 10-1 presents the window architecture for Network Monitor. The two
windows that are highlighted are the primary subjects in this chapter and include:
■
the Control Window
■
the Edit Maps Window
Adding Users
See Chapter 2 for information on adding users.
Removing Users
See Chapter 2 for information on removing users.
StarKeeper II NMS Graphics System Guide, R10.0, Issue 1
10-1
Administering Network Monitor
The remaining Network Monitor windows may also be briefly mentioned within this
chapter.
NETWORK MONITOR
CONTROL WINDOW
EDIT
MAPS
WINDOW
NETWORK
STATUS
WINDOW
NETWORK
MAP
WINDOW
LIST ALARMS
WINDOW
DIAGNOSTICS
WINDOW
Figure 10-1. Window Architecture
Tutorial on Map Hierarchy
After Network Monitor has been properly installed on your Graphics System, you
are ready to begin planning and creating a map hierarchy. The tutorial that follows
guides you step-by-step to illustrate the two-phase process for planning a map
hierarchy (Phase I) and building a map hierarchy with Network Monitor (Phase II)
using a sample network.
The intent of this tutorial is to get you up and running as quickly as possible; it
does not describe every command in detail—see Chapter 12 for more detailed
information on each command.
NOTE:
This is a paper-only tutorial and is NOT interactive. You can try to follow the
tutorial on your Graphics System, but your network, as well as the
configuration data in your Core System database(s), will differ from what is
presented here. Therefore, you will not be able to build the sample map
hierarchy on your own Graphics System.
10-2
StarKeeper II NMS Graphics System Guide, R10.0, Issue 1
Administering Network Monitor
If you are planning or creating a map hierarchy for the first time, you will want to
read this tutorial in depth. If you are familiar with the topics, you can skip certain
sections and immediately access the section you need or go directly to Chapter
12.
Map Hierarchy Principles
When planning and creating your map hierarchy, it is very important that you
understand a few key principles. These principles enable you to design and
implement a map hierarchy optimally suited to your needs.
This section covers the following four principles:
■
how a top map and map pointers define a map hierarchy
■
how map symbols are updated based on a hierarchical network addressing
scheme
■
how map symbols are updated based on the trickle-up of alarms and clear
messages from the bottom of a map hierarchy to the top of the hierarchy
■
how map symbols reflect the highest severity alarms on the represented
objects
NOTE:
Network address and trickle-up can operate together to determine how an
individual map symbol is updated.
Map Hierarchy Definition
A map hierarchy is defined by designating one map as the top map. Without a top
map, you will not be able to display either the Network Map Window or the
Network Status Window, as described in Chapter 1 and Chapter 12 in this guide.
When the Network Map Window and the Network Status Window are invoked (this
is done with the View Network Status option in the Control Window), the top map
is the first map to be loaded into memory. Symbols on the top map can also be
defined to point down to other maps. These pointers further define the map
hierarchy. The maps pointed to by symbols on the top map are loaded next. These
maps may also have symbols defined to point to other maps that are
subsequently loaded, and so on, stopping when a map does not have any symbol
pointing to another map.
StarKeeper II NMS Graphics System Guide, R10.0, Issue 1
10-3
Administering Network Monitor
NOTE:
Although with Network Monitor you can navigate up and down a map
hierarchy, you only need to define pointers for symbols that point down to
other maps. Up is automatically defined during the map loading process, as
described above.
Hierarchical Addressing
The hierarchical addressing scheme, used by StarKeeper II NMS for networks,
enables Network Monitor to dynamically color a map symbol representing a piece
of network equipment. The color reflects alarms or clear messages on any
component of the represented equipment. For more information on the
hierarchical addressing scheme, see the StarKeeper II NMS Core System Guide.
For example, a map symbol representing a node, named AREA1/EXCH1/node1,
will dynamically change color to reflect alarms on any module, port or channel in
the node AREA1/EXCH1/node1. Since a concentrator is linked to the node via a
module in the node, concentrator alarms are also included.
Another way of describing this principle is that a symbol with a particular address
(for example, AREA1/EXCH1/node1) will dynamically change color to reflect any
alarm or clear message with that address or any address hierarchically under the
one specified (for example, AREA1/EXCH1/node1 or AREA1/EXCH1/node1:3.2/
1.2.4).
Trickle-Up
The second principle determining how a map symbol is updated to reflect alarms
and clear messages is referred to as trickle-up. This is best illustrated with some
simple drawings. The following diagram shows symbols on a map that are
specified to point to other maps; for example symbol A on MAP 1 points to MAP 2
and symbol B on MAP 1 points to MAP 3.
10-4
StarKeeper II NMS Graphics System Guide, R10.0, Issue 1
Administering Network Monitor
.
MAP 1
A
B
C
MAP 2
MAP 3
D
E
H
I
F
G
J
K
Figure 10-2. Symbols Point Down to Lower-Level Maps
Symbol A on MAP 1 will dynamically change color to reflect any alarms on
symbols D, E, F and G found on MAP 2. Symbol B on MAP 1 will dynamically
change color to reflect any alarms on symbols H, I, J and K found on MAP 3. In
other words, alarms on lower level maps, in effect, trickle-up to the pointing
symbol on the higher level map as illustrated in the following diagram:
MAP 1
A
B
C
MAP 2
MAP 3
D
E
H
I
F
G
J
K
Figure 10-3. Alarms Trickle up to Symbols on Higher-Level Maps
StarKeeper II NMS Graphics System Guide, R10.0, Issue 1
10-5
Administering Network Monitor
You must keep in mind how trickle-up works when planning your map hierarchy, so
that your displays will behave in the intended fashion.
The tutorial in this chapter provides examples to show how trickle-up can
influence your decisions in planning and creating your maps to prevent confusion
in interpreting map displays.
Highest Severity Alarm(s)
Regardless of whether a map symbol is updated due to the network address or to
trickle-up, or both, the color of a symbol will always reflect the highest outstanding
alarm(s) on the network equipment represented by a symbol.
For example, suppose a node, (node1), is represented by a map symbol, (S1),
and that S1 is green reflecting no alarms on any component of node1. If a major
alarm occurs on module 3 of node1, the S1 symbol will become yellow. If a minor
alarm on module 12 of node1 occurs, when the S1 symbol is updated, its color will
not be changed because S1 is already colored to reflect an alarm of a higher
severity (that is, S1 will remain yellow). However, if a critical alarm is received on
any component of node1, when S1 is updated, its color will change from yellow to
red. Similarly, if the critical and only the critical alarm is cleared, when S1 is
updated, its color will change from red to yellow, still reflecting the highest severity
alarm that is still outstanding on that node.
10-6
StarKeeper II NMS Graphics System Guide, R10.0, Issue 1
Administering Network Monitor
Phase I: Planning a Map Hierarchy on
Paper
Before you begin creating network maps with Network Monitor, it is recommended
that you thoroughly plan your map hierarchy on paper. This ensures that the map
hierarchy that you eventually create is useful, and that all the maps work well
together. Refer to the following table and follow the next few sections to
understand the suggested planning sequence.
Table 10-1. Phase I: Planning a Map Hierarchy on Paper
Step #
Task
1
Identify Network Equipment
2
Place all Equipment on a Paper Map
3
Decide on Equipment Grouping
4
Plan for Scratch Pad Information
5
Decide on Detailed Maps
6
Decide on Shelf Maps
7
Sketch the Map Hierarchy
Step 1: Identify Network Equipment
Equipment in your network may include StarKeeper II NMS, BNS-2000 VCS,
BNS-2000, LCS50 Datakit II VCS Network Interface, Datakit II VCS Network
Access Controller (NAC), AT&T Paradyne COMSPHERE 6800 Series Network
Management System, and other products. To determine the number of maps
needed to represent your network, you must first identify all your network
equipment, its location, and network addresses.
The following tables identify all equipment in a sample network. For tutorial
purposes, pretend that this is your network and that you are going to plan and
create network maps for this network.
Table 10-2 lists nodes and systems in the sample network by location, node/
system type, and address.
StarKeeper II NMS Graphics System Guide, R10.0, Issue 1
10-7
Administering Network Monitor
Table 10-2.
Nodes and Systems in Sample Network
Physical Location
of Equipment
New York
Node/System Type
BNS-2000 VCS
Network Address
USA/NY/Albany/ny1
BNS-2000 VCS
USA/NY/NYC/ny2
BNS-2000
USA/NY/Bingham/ny3
StarKeeper II NMS
eastSK
Total= 4(2 BNS-2000 VCS nodes, 1 BNS-2000 node, 1 StarKeeper II NMS.)
Illinois
BNS-2000 VCS
USA/IL/Chicago/il1
BNS-2000 VCS
USA/IL/Chicago/il2
BNS-2000 VCS
USA/IL/Blooming/il3
BNS-2000
USA/IL/Peoria/il4
Total= 4(3 BNS-2000 VCS nodes, 1 BNS-2000 node.)
Texas
BNS-2000 VCS
USA/TX/Dallas/tx1
BNS-2000 VCS
USA/TX/Houston/tx2
BNS-2000
USA/TX/Austin/tx3
LCS50 Datakit II VCS Network Interface
TXnik1
COMSPHERE 6800 Series NMS
TXcom1
Total= 5(2 BNS-2000 VCS nodes, 1 BNS-2000 node, 1 LCS50, 1 COMSPHERE 6800 Series NMS.)
California
BNS-2000 VCS
USA/CA/Oakland/ca1
BNS-2000 VCS
USA/CA/Irvine/ca2
BNS-2000 VCS
USA/CA/SF/ca3
BNS-2000 VCS
USA/CA/LA/ca4
Network Access Controller
CAnac1
StarGROUP Network Manager
CAsg1
StarKeeper II NMS
westSK
Total= 7 (4 BNS-2000 VCS nodes, 1 NAC, 1 StarGROUP Network Manager, 1 StarKeeper II NMS.)
TOTAL for network= 11 BNS-2000 VCS nodes, 3 BNS-2000 nodes, 1 LCS50,
1 COMSPHERE 6800 Series NMS, 1 NAC, 1 StarGROUP Network Manager, 2 StarKeeper II NMS.
Table 10-3 lists all the trunks connecting the equipment in the sample network.
For each trunk, the trunk location and name is listed, as well as the names of the
two nodes connected by the trunk and the interface boards supporting the
connection at each end.
10-8
StarKeeper II NMS Graphics System Guide, R10.0, Issue 1
Administering Network Monitor
Table 10-3. Trunks in Sample Network
Location
New York
Trunk Name
Node 1 Endpoint
Node 2 Endpoint
NYtrk1
USA/NY/Albany/ny1:3
USA/NY/NYC/ny2:5
NYtrk2
USA/NY/Albany/ny1:5
USA/NY/Bingham/ny3:17
NYtrk3
USA/NY/Albany/ny1:17
USA/NY/Bingham/ny3:19
NYtrk4
USA/NY/NYC/ny2:3
USA/NY/Bingham/ny3:21
NYTXtrk1
USA/NY/Bingham/ny3:3
USA/TX/Dallas/tx1:5
NYTXtrk2
USA/NY/Bingham/ny3:5
USA/TX/Dallas/tx1:17
NYILtrk1
USA/NY/Bingham/ny3:23
USA/IL/Chicago/il1:25
Total= 7 (4 reside in NY, 2 go to TX, 1 goes to IL.)
Illinois
ILCAtrk1
USA/IL/Chicago/il1:3
USA/CA/Oakland/ca1:5
ILtrk1
USA/IL/Chicago/il1:5
USA/IL/Chicago/il2:4
ILtrk2
USA/IL/Chicago/il2:6
USA/IL/Blooming/il3:4
ILtrk3
USA/IL/Chicago/il2:18
USA/IL/Peoria/il4:3
Total= 4 (1 goes to CA, 3 reside in IL.)
Texas
TXtrk1
USA/TX/Dallas/tx1:3
USA/TX/Houston/tx2:4
TXtrk2
USA/TX/Houston/tx2:3
USA/TX/Austin/tx3:4
TXtrk3
USA/TX/Austin/tx3:5
USA/TX/Dallas/tx1:19
TXCAtrk1
USA/TX/Austin/tx3:3
USA/CA/Irvine/ca2:3
Total= 4 (3 reside in TX, 1 goes to CA.)
California
CAtrk1
USA/CA/Oakland/ca1:3
USA/CA/Irvine/ca2:4
CAtrk2
USA/CA/Irvine/ca2:5
USA/CA/SF/ca3:18
CAtrk3
USA/CA/SF/ca3:19
USA/CA/LA/ca4:5
CAtrk4
USA/CA/LA/ca4:3
USA/CA/Oakland/ca1:4
Total= 4 (all reside in CA.)
TOTAL for network= 19 trunks.
Table 10-4 shows all the concentrators and Synchronous/Asynchronous
Multiplexers (SAMs) in the sample network. For each concentrator or SAM, its
physical location, type, network address, and name (if applicable) are shown:
StarKeeper II NMS Graphics System Guide, R10.0, Issue 1
10-9
Administering Network Monitor
Table 10-4. Concentrators/SAMs in Sample Network
Physical
Location
Type
Network Address
New York
SAM504
USA/NY/NYC/ny2:17
Illinois
SAM64
USA/IL/Chicago/il1:4
Texas
California
Name
SAM64
USA/IL/Chicago/il1:2
SAM8
USA/TX/Houston/tx2:6
RRS
USA/TX/Austin/tx3:25
TXconc1
FRS
USA/TX/Austin/tx3:26
TXconc2
SAM64
USA/TX/Austin/tx3:27
SAM8
USA/CA/LA/ca4:8
Table 10-5 presents information about other systems in the sample network. The
location, system name, and the node to which the system is connected, including
the slot number of the Computer Port Module (CPM) board supporting the
connection, is shown:
Table 10-5. Connections to Other Systems in Sample Network
Location
Texas
California
System Name
Node and CPM
Address
TXnik1
USA/TX/Austin/tx3:19
TXcom1
USA/TX/Houston/tx2:17
CAnac1
USA/CA/LA/ca4:7
CAsg1
USA/CA/Oakland/ca1:35
Step 2: Place All Equipment on A Paper Map
After you have identified all your equipment and locations, you need to decide
whether to represent the equipment geographically, organizationally, or in another
fashion. If you decide to represent your network on geographic maps, this is a
good time to think about which geographic maps, if any, you would like to use.
Backgrounds available with Network Monitor include the world, the U.S.A., and
the individual states.
For the sample network, assume you choose a geographical representation.
Since the location of the equipment in the sample network spans from coast to
coast, choose a map of the continental United States as the background for the
top map.
10-10
StarKeeper II NMS Graphics System Guide, R10.0, Issue 1
Administering Network Monitor
A geographic background allows you to better represent the physical layout of a
network. The background provides a topological view of the network so that you
can discern distances between equipment.
NOTE:
A map background is purely optional.
Figure 10-4. Planning Background of Top Map
You can now begin to lay out the network topology on paper on the background
chosen for the sample network. In this case, it is a map of the USA.
Using Tables 10-2 through 10-5, place all the equipment in the sample network
on the USA background. Throughout the remainder of this tutorial, you may need
to refer to these tables again.
StarKeeper II NMS Graphics System Guide, R10.0, Issue 1
10-11
Administering Network Monitor
CAsg1
west SK
4
35
ca3
ILCAtrk1
il1
ca1
il2
ca2
ca4
east SK
ny1
NYILtrk1
ny3 ny2
1
trk
TX
17
NY
2
il3
il4
8
7
CAnac1
2
trk
TX
TX
CA
trk
1
NY
TXnik1
TXconc1
19
25
TXconc2
tx1
tx3
26
TXcom1
17
tx2
27
6
Figure 10-5. Planning the Top Map
The symbols on the above figure correspond to those used in the Network Monitor
application. In addition, every symbol has a label. You should incorporate your
labels at this point to ensure the maps you build later on are correctly interpreted.
Most labels (for example, node/system names and trunk names) are automatically
associated with a symbol when you place the symbol on a map. These labels are
only automatically assigned to objects that are monitored by a Core System to
which a Graphics System is logically connected. Other labels (for example,
aggregate symbols) must be manually associated with the symbol.
Notice that Figure 10-5 displays the node, system, and trunk labels that are
automatically assigned by Network Monitor. Concentrators and SAMs are
automatically labeled by the local node and address (for example, tx3:27). In
Figure 10-5, only the slot number is shown to save space.
As you can see, the top map in Figure 10-5 is rather busy. This might be
cumbersome to use in an on-line display, so continue on to the next step, which
discusses grouping the equipment into manageable chunks. In general, each
group should contain no more than five to ten symbols per group.
10-12
StarKeeper II NMS Graphics System Guide, R10.0, Issue 1
Administering Network Monitor
Step 3: Decide on Equipment Grouping
Observe that from the cluttered sketch in Figure 10-5, four distinct regions stand
out. You could group these components into logical clusters; pretend that you
decide to do this for the sample network. Network Monitor provides you with an
aggregate location symbol that can represent the components contained in a
particular cluster. It is recommended that each aggregate location symbol
represent anywhere from three to 15 nodes.
NOTE:
Aggregate location symbols do not have a network address of their own;
they serve only as pointers to other maps.
To unclutter the preceding busy top map, you can create a top map depicting four
aggregate location symbols— one for each state with network equipment. This
map can also include two StarKeeper II NMSs, since in general, you may want to
place StarKeeper II NMS symbols on the top map or on a map with multiple
aggregate locations.
You also need to represent all the trunks in your network on your top map. The
principle of grouping equipment together can be extended to trunks. Network
Monitor provides a trunk aggregate symbol to represent two or more trunks.
Assume that for the sample network you place the three individual inter-state
trunks (NYILtrk1, ILCAtrk1, and TXCAtrk1) on the top map, plus an aggregate
trunk symbol (see Figure 10-6) to represent the two trunks between New York
and Texas (NYTXtrk1, and NYTXtrk2).
StarKeeper II NMS Graphics System Guide, R10.0, Issue 1
10-13
Administering Network Monitor
The top map now looks something like the following figure:
east SK
rk1
YILt
N
west SK
CAaggr
ILCAtrk1
TX
NYAggr
ILaggr
CA
k
Tr
trk1
Ag
gr
1
TXaggr
Figure 10-6. Planned Top Map
Each aggregate location symbol on this map represents the network components
that are located in an area. Since there are four chunks of equipment in this
sample network —one in New York, one in Illinois, one in Texas, and one in
California—plan to have four regional maps, each using the appropriate state's
geographical background.
To accomplish this, place the equipment represented by each aggregate location
symbol and the associated trunks on a separate map. Refer to Figure 10-6 to see
what aggregate location symbol corresponds to which equipment (you may also
want to refer to Table 10-2 through Table 10-5). When placing the Texas
equipment on the Texas regional map, it will be a bit crowded if you put all the
concentrators in this area onto the map; besides, as discussed later on in Step 5,
Decide on Detailed Maps, you would like to show some of the Front End
Processors (FEPs) and hosts associated with tx3, so decide to leave the
concentrators associated with tx3 off the Texas regional map, and make a note to
get back to them later.
Finally, recall that you want each aggregate location symbol on the top map to
point to the corresponding regional map. As a result of all the decisions made up
to this point, the top map and the four regional maps representing the sample
network now look like the following figure:
10-14
StarKeeper II NMS Graphics System Guide, R10.0, Issue 1
Administering Network Monitor
USA
NYILtrk1
ILCAtrk1
TXC
A
Trk
Atrk
1
gg
r1
ILLINOIS
CALIFORNIA
CAsg1
TO
IL
35
ca3
ca4
TO
CA
2
4
il1
ca1
il2
ca2
7
TO
NY TO
IL
8
il3
TO
TX
ny3 ny2
il4
TO
TX
CAnac1
17
NEW YORK
TO
NY
TXnik1
TO
CA
ny1
tx1
19
17
tx2
tx3
TXcom1
6
TEXAS
Figure 10-7. Planned Regional Maps
At this point, it is also a good idea to plan for map titles for each map as well as file
names for each map. Devising a naming scheme will assist you in locating the
map(s) when you want them. Plan on using the names of the states and the
United States as the file names for the regional maps and top map, respectively.
StarKeeper II NMS Graphics System Guide, R10.0, Issue 1
10-15
Administering Network Monitor
Step 4: Plan for Scratch Pad Information
Network Monitor provides a Scratch Pad feature so you can associate important
notes with a map symbol. For example, you may want to enter notes that aid in
solving certain network problems. Now is a good time to plan for such notes, so on
the paper map, write your notes near the equipment that you think would benefit
from these notes the most. For the sample network, plan on entering Scratch Pad
notes on the number of the carrier company for the heavily loaded trunk between
Texas and California (that is, TXCAtrk1). It may also be helpful to enter the name
of the technician who has previously repaired the trunk, if applicable.
NOTE:
Scratch Pad information is stored on an appropriate Core System and is
available to any Graphics System that is logically connected to the Core
System.
Step 5: Decide on Detailed Maps
Detailed maps depict more detail of network equipment. The sections that follow
describe detailed maps for a node and a trunk aggregate symbol.
Detailed Map of a Node
0
Recall that you decided to leave some equipment associated with tx3 off the
Texas regional map where tx3 is represented. However, you want to represent this
equipment somewhere. You can plan to do this on a detailed map dedicated to the
tx3 BNS-2000 VCS node.
What you would like to show on this map is the tx3 node itself, the two
concentrators and one SAM associated with it, some CPM-connected hosts,
FEPs, and two Automated Teller Machines (ATMs). StarKeeper II NMS does not
monitor the hosts, FEPs, and ATMs, so when these symbols are placed on the
map, they appear white and will never turn colors in response to alarms. However,
the presence of these unmonitored objects is useful in showing network topology.
Additionally, you can include the connections to these objects (for example, the
CPM connection to Host C) on your map so you will be alerted to any problems
with the connections.
Assume that you would like to include on the detailed map of tx3 the LCS50
Datakit II VCS Network Interface (that is, TXnik1) and the connection between
TXnik1 and tx3. TXnik1 already has been placed on the Texas regional map. But,
it is important to keep TXnik1 unmonitored (white) on the detailed map of tx3; you
can do this by placing a NIK symbol without a network address. Otherwise, due to
trickle-up, the tx3 symbol on the Texas regional map will not only reflect alarms on
tx3, but also will reflect alarms on TXnik1. This would result in confusion and
should be avoided.
10-16
StarKeeper II NMS Graphics System Guide, R10.0, Issue 1
Administering Network Monitor
NOTE:
See Trickle-Up of the Map Hierarchy Principles section in the
beginning of this chapter.
On the other hand, the CPM connection between tx3 and TXnik1 does not present
a problem with trickle-up, since the CPM module is actually part of the tx3 node.
For every CPM or other type of connection, you must know the exact address and
make a note of it when building maps with Network Monitor. If you have many
connections, you may want to make a table similar to Table 10-5.
Continuing on, the detailed map for the tx3 node now looks something like this:
TXconc1
CPM
25
HOST A
TXconc2
TXnik1 (unmonitored)
CPM
tx3
26
19
CP
M
FEP
17
HOST B
ATM1
27
ATM2
HOST C
Figure 10-8. Planned Detailed Map for Node tx3
Later, when you simulate translating this map into an on-line map on Network
Monitor (in Phase II of this tutorial), you will need to specify that the tx3 node on
the Texas regional map should point to this detailed map for tx3. One possible
naming convention for detailed maps of nodes is to specify the local node/system
name, followed by 'node' or 'system'—in this case, tx3node.
Detailed Map of a Trunk Aggregate Symbol
0
Another type of detailed map you might need is a detailed map of trunks. If you
choose to use a trunk aggregate symbol on one map, create an associated
detailed map of trunks which shows the individual trunks represented by the
StarKeeper II NMS Graphics System Guide, R10.0, Issue 1
10-17
Administering Network Monitor
aggregate trunk symbol; otherwise, the aggregate trunk symbol will not reflect the
alarms from the intended trunks. This case will be obvious to you because the
trunk aggregate symbol will be white to indicate an unmonitored object.
It is a good idea to plan your detailed maps of trunks ahead of time, along with
your other maps. This gives you the option to show collections of trunks on some
maps, and specific trunks on regional maps and/or on detailed maps for trunks.
Recall that for the sample network, you placed a trunk aggregate symbol on the
top map between the New York and the Texas aggregate location symbols (see
Figure 10-6). The detailed map corresponding to the trunk aggregate symbol
should represent the two trunks between New York and Texas, and will look like
this:
NYTXtrk1
NYTXtrk2
Figure 10-9. Planned Detailed Map for Trunk Aggregate Symbol
Later, when you simulate creating this map in Network Monitor (in Phase II of this
tutorial), you will need to specify that the trunk aggregate symbol on the top map
points to this corresponding detailed map. One possible naming convention for
detailed maps of trunks is to specify the name of the trunk aggregate symbol - in
this case, TrkAggr1.
Step 6: Decide on Shelf Maps
At this point in your planning, your should decide whether you would like any shelf
maps for your nodes and concentrators, and if so, select the nodes of interest.
With Network Monitor, you can automatically generate shelf maps for all nodes
and concentrators that are monitored by the Core System to which your Graphics
System is logically connected.
For the purposes of this tutorial, pretend that this is what you decide for the
sample network. Later in this tutorial, you will simulate requesting that shelf maps,
10-18
StarKeeper II NMS Graphics System Guide, R10.0, Issue 1
Administering Network Monitor
displaying the shelves and modules for all the nodes and concentrators in your
sample network, be automatically generated.
Step 7: Sketch the Map Hierarchy
Now you can combine the results of the previous steps to determine how the map
hierarchy representing the sample network will look. Linking together the top map,
the four regional maps, the detailed map for the tx3 node, the detailed map for the
trunk aggregate, and the shelf maps for each node and associated concentrators
produces the following map hierarchy:
StarKeeper II NMS Graphics System Guide, R10.0, Issue 1
10-19
Administering Network Monitor
TOP MAP: USA
east SK
west SK
NYILtrk1
ILCAtrk1
T XC
r1
gg
A
Trk
Atrk
1
map pointers set by user
CALIFORNIA
REGIONAL MAP: calif
CAsg1
ca3
35
ca1
ca2
ca4
7
TO
IL
TEXAS
REGIONAL MAP: texas
TO
TXnik1 NY
TO 19
tx1
CA
tx3
tx2
8
TO
TX
6
ILLINOIS
NEW YORK
TrkAggr1
REGIONAL MAP: illinois REGIONAL MAP: new york DETAIL MAP: trkaggr1
4
TO
CA
2
il1
TO
NY
il3
TXcom1
ny1
ny3
il4
TO
TX
CAnac1
NS NS CS NS NS
NYTXtrk1
TO
IL
il2
17
CS
NS NS
NS NS NS NS CS CS
ny2
NYTXtrk2
17
NS NS NS CS
map pointers automatically
set by Network Monitor
DETAIL MAP: tx3 node
TXconc1 25
HOST A
TXnik1 (unmonitored)
CPM
19
tx3
TXconc2
26
CP
M
FEP
HOST B
ATM1
17
27
ATM2
HOST C
NS
CS CS CS
Legend:
NS = Node Shelf Map
CS = Concentrator Shelf Map
Figure 10-10. Planned Map Hierarchy
Notice that Figure 10-10 reflects map titles. You will be assigning both a map title
and a file name, to serve as a pointer, for each regional and detailed map. Figure
10-10 also shows the node and concentrator shelf maps—labeled NS and CS,
respectively—which are linked to the appropriate node or concentrator/SAM
symbols lowest in the hierarchy. This will be automatically done for you by
Network Monitor when you generate shelf maps.
10-20
StarKeeper II NMS Graphics System Guide, R10.0, Issue 1
Administering Network Monitor
For example, the symbol representing tx3 on the detailed map for tx3 is
automatically linked to the shelf map for tx3. Other shelf maps are linked directly
to the appropriate symbol on one of the regional maps.
Figure 10-10 also illustrates that you can choose any number of levels for
different branches of your map hierarchy. For example, the shortest branch has
only two levels—the top map and the trunk detail map, while other branches have
three or four levels. Looking at Figure 10-10, an example of four levels is: the top
map, the Texas regional map, the detailed map for tx3, and the shelf map for tx3.
You have complete flexibility in deciding the number of levels for your map
hierarchy and the level of detail you wish to represent for each branch of the
hierarchy. For example, the detailed map of trunks in Figure 10-10 is on the same
level as the regional maps and the shelf maps appear on both levels three and
four.
StarKeeper II NMS Graphics System Guide, R10.0, Issue 1
10-21
Administering Network Monitor
Phase II: Building a Map Hierarchy
with Network Monitor
Phase II of this tutorial simulates how you would define a map hierarchy with
Network Monitor. This is accomplished by outlining the procedures needed to
create a representative sample of the maps planned for the sample network.
Specifically, Phase II simulates how to create the top map, the Texas regional
map, the detailed maps for tx3 and the trunk aggregate, how to request the
automatic generation of shelf maps, and how to link these maps together.
The same type of top-down approach used in Phase I is recommended for Phase
II. The following table illustrates the steps to use when creating and generating
network maps, once you have planned your map hierarchy on paper
Table 10-6.
Phase II: Steps for Building a Map Hierarchy
Step #
Task
1
Setting Up Connections to StarKeeper II NMS
2
Synchronizing the Database(s)
3
Starting Network Monitor
4
Starting the Map Editor
5
Creating the Top Map
Adding a Geographic Background
Adding Aggregate Location Symbols
Setting the Map Pointer for Texas Aggregate Location Symbol
Adding the Label for Texas Aggregate Location Symbol
Adding StarKeeper II NMS Symbols
Adding Trunks
Moving a Label
Adding the Trunk Aggregate Symbol
Adding the Label for Trunk Aggregate Symbol
Setting the Map Pointer for Trunk Aggregate Symbol
Setting the Map Title for Top Map
Saving the Top Map
6
Setting Top Map Parameter
7
Editing a Regional Map
Loading a Regional Map
Adding a Geographic Background
Adding Nodes
Adding Other Systems
10-22
StarKeeper II NMS Graphics System Guide, R10.0, Issue 1
Administering Network Monitor
Table 10-6.
Phase II: Steps for Building a Map Hierarchy—Continued
Step #
Task
Adding a Concentrator/SAM
Moving a Label
Adding Trunks and Labels
Adding a Concentrator/SAM Link
Adding Other Connecting Symbols
Adding Scratch Pad Information
Setting the Map Pointer for a Node Symbol
Setting the Map Title for Regional Map
Saving the Regional Map
8
Editing a Detailed Map of tx3 Node
Adding the tx3 Node Symbol
Adding Concentrators/SAMs
Adding Concentrator/SAM Links
Adding Unmonitored Objects
Adding Other Connecting Symbols
Adding Labels
Setting the Map Title for Detailed Map
Saving the Detailed Map
9
Editing a Detailed Trunk Map for TrkAggr1
10
Generating Shelf Maps
11
Testing Maps Checklist
Step 1: Setting Up Connections to StarKeeper II
NMS
Prior to starting the map editor, you must set-up your Graphics System's logical
connection(s) to one or more Core Systems. Refer to the StarKeeper II NMS Core
System Guide for more information.
Step 2: Synchronizing the Database(s)
Before editing maps or generating shelf maps, ensure that the Core System
databases to which your Graphics System is logically connected are in
synchronization with the appropriate node databases. To accomplish this, use the
StarKeeper II NMS commands, skload and cfg_sync. Use the Core System help
command for more information on these commands.
StarKeeper II NMS Graphics System Guide, R10.0, Issue 1
10-23
Administering Network Monitor
Additionally, ensure that your Graphics System can access the latest configuration
data on the Core System to which the Graphics System is logically connected.
See Chapter 2 for more information on synchronizing connections.
Step 3: Starting Network Monitor
To start Network Monitor, click on the Network Monitor icon on the StarKeeper II
NMS subpanel.
A banner window appears briefly and is replaced by the Network Monitor Control
Window.
Screen 10-1.
Network Monitor Control Window
Step 4: Starting the Map Editor
To start the map editor, start from the Control Window.
Procedure 10-1.
10-24
Starting the Map Editor
1.
In the Control Window, choose
2.
In the Administer menu, choose
3.
In the Administer Maps menu, choose
Administer
.
Administer Maps
.
Edit Maps
.
StarKeeper II NMS Graphics System Guide, R10.0, Issue 1
Administering Network Monitor
The Edit Maps Window is then displayed.
Screen 10-2.
Edit Maps Window
NOTE:
Expect a delay when the editor process starts. This is due to the fact that
the editor must retrieve configuration information from all the Core Systems
that are logically connected to your Graphics System. This collected
information will then be available in lists to aid in the selection and
placement of equipment on your network maps.
Instructional messages appear in the Edit Maps Window footer as you perform
tasks with the map editor. Look for these messages to remind you how to perform
various tasks (for example, placing symbols on a map). Now follow the next few
sections that illustrate how to create network maps.
StarKeeper II NMS Graphics System Guide, R10.0, Issue 1
10-25
Administering Network Monitor
Step 5: Creating the Top Map
As Figure 10-6 in Phase I illustrates, the top map for the sample network consists
of two Core Systems, four aggregate location symbols that point to four regional
maps, and trunks inter-connecting the equipment in the four regions.
Adding a Geographic Background
0
Now add the USA geographic background to the top map.
Procedure 10-2.
1.
In the Edit menu, choose Background.
2.
In the pop-up window, scroll down and select U.S.A. from the list of
backgrounds, then choose OK .
Screen 10-3.
10-26
Adding Background for Top Map
Choosing Background
StarKeeper II NMS Graphics System Guide, R10.0, Issue 1
Administering Network Monitor
The USA background appears on the blank screen.
Screen 10-4.
Adding Background for Top Map
NOTE:
The setting of a map background is optional. If no action is taken, a
background is not associated with the map.
Adding Aggregate Location Symbols
0
The top map for the sample network contains four aggregate location symbols
which correspond to four regional maps. Now add aggregate location symbols to
the sample top map.
Procedure 10-3.
1.
Adding Aggregate Location Symbols
In the Edit Maps Window, choose Edit, then choose Equipment, then
choose Pick From Legend.
StarKeeper II NMS Graphics System Guide, R10.0, Issue 1
10-27
Administering Network Monitor
The editor legend is displayed:
Screen 10-5.
10-28
Editor Legend
2.
Place an aggregate location symbol for the New York region on the top
map. To do this, click on an aggregate location symbol in the editor legend.
Notice that the mouse cursor automatically jumps to the center of the map
and changes to a cross-hair shape inside a small square. This indicates
that the system is waiting for an object to be placed.
3.
To place the aggregate location symbol on the map, point to the New York
region on the map with the mouse and click.
4.
Repeat Steps 2 and 3 to place the aggregate location symbols for Illinois,
Texas, and California.
StarKeeper II NMS Graphics System Guide, R10.0, Issue 1
Administering Network Monitor
The top map now looks similar to this:
Screen 10-6.
Adding Aggregate Location Symbols
The aggregate location symbols are white. This is because they are not pointing
to any other maps. You must sat a map pointer for each one, as the next section
illustrates.
NOTE:
To cancel the operation without placing an object when adding equipment,
click the third (right) mouse button.
Setting the Map Pointer for Texas Aggregate
Location Symbol
0
For each aggregate location symbol, you must set a map pointer.
Procedure 10-4.
1.
Setting the Map Pointer for Texas Aggregate Location
Symbol
Click on the Texas aggregate location symbol on the map.
StarKeeper II NMS Graphics System Guide, R10.0, Issue 1
10-29
Administering Network Monitor
When selected, an object is highlighted (a yellow box appears behind the
object).
2.
In the Edit Maps Window, choose Options, then choose Set Map Pointer.
3.
In the Edit Maps: Set Map Pointer pop-up window, type texas.region for
the name of Texas regional map, then choose OK .
Screen 10-7.
Setting a Map Pointer for an Aggregate Location Symbol
The Texas aggregate location symbol now points to the Texas regional map and
turns green to indicate that a map pointer has been set. Setting a map pointer
also creates an empty map file with the name of texas.region. You can edit this
map later to add the symbols for the Texas equipment you want to display.
Using the same procedure, set pointers for the other three aggregate location
symbols.
Adding the Label for Texas Aggregate Location
Symbol
0
Now add a label for the Texas aggregate location symbol.
Procedure 10-5.
10-30
Adding the Label for Texas Aggregate Location Symbol
1.
Click on the Texas aggregate location symbol on the map.
2.
Choose Edit, choose Labels, then choose Add.
3.
In the pop-up window, type the desired label, TXaggr, then choose
OK
StarKeeper II NMS Graphics System Guide, R10.0, Issue 1
.
Administering Network Monitor
Screen 10-8.
Adding Label for Texas Aggregate Location Symbol
The mouse cursor automatically jumps to the object selected and changes
to a cross-hair shape inside a small square.
4.
To place the label on the map, click near the Texas aggregate location
symbol.
5.
Repeating Steps 1 through 4, add the respective labels for the other three
aggregate location symbols in New York, Illinois, and California.
Adding StarKeeper II NMS Symbols
0
To place network equipment on a map, including StarKeeper II NMS, it is
recommended that the lists of equipment be used, instead of selecting and
placing symbols from the legend. Now add StarKeeper II NMS symbols.
Procedure 10-6.
1.
Adding StarKeeper II NMS Symbols
In the Edit Maps Window, choose Edit, then choose Equipment, then
choose Add Nodes/Systems.
In a pop-up window, a list appears that contains an entry for each
StarKeeper II NMS Core System, to which the Graphics System is logically
connected, and for each node and system that the Core System monitors.
2.
In the pop-up window, choose the Core System, eastSK, then choose
OK . If you want the symbol to appear in other than the default size,
choose Select Object Size first, then select the desired size and choose
OK . You can also resize the object after it is placed.
StarKeeper II NMS Graphics System Guide, R10.0, Issue 1
10-31
Administering Network Monitor
The mouse cursor automatically jumps to the center of the map and changes to a
cross-hair shape inside a small square.
Screen 10-9.
3.
Picking Equipment from a List
Point to New York region near the aggregate symbol and click.
The star symbol appears. By picking equipment from the list, the editor
automatically assigns the correct network address to the symbol. Thus, the
symbol appears green. Also, a label automatically appears, with the name
of the Core System.
NOTE:
Aggregate location symbols appear green in the editor if a map pointer has
been associated with the aggregate symbol. All other symbols appear
green in the editor if a network address has been associated with the
symbol.
4.
10-32
Repeating Steps 2 and 3, place a second Core System symbol, westSK, in
California near the aggregate symbol.
StarKeeper II NMS Graphics System Guide, R10.0, Issue 1
Administering Network Monitor
0
Adding Trunks
Figure 10-6 in Phase I displays the trunks connecting the different aggregate
locations in the sample network. With Network Monitor, individual trunks can be
chosen from a list of trunks for placement on the map, or a trunk aggregate
symbol can be chosen from the editor legend to represent multiple trunks. Now
place the individual trunks.
Procedure 10-7.
1.
Adding Trunks
In the Edit Maps Window, choose Edit, then choose Equipment, then
choose Add Trunks.
In a pop-up window, a list appears that contains an entry for each trunk in
the network (that is, all trunks known by the Core System logically
connected to the Graphics System).
NOTE:
Choose Multi Lines to display the trunk name and both endpoint
addresses. You can also sort the trunk list by Name, by Endpoint 1, or by
Endpoint 2 if you choose the Sort Criteria option.
2.
Scroll down and choose the trunk, NYILtrk1, which connects node ny3 in
New York with node il1 in Illinois, then choose OK .
The mouse cursor automatically jumps to the center of the map and
changes to a cross-hair shape.
StarKeeper II NMS Graphics System Guide, R10.0, Issue 1
10-33
Administering Network Monitor
Screen 10-10.
3.
Picking Trunks from a List
Specify the placement of both ends of the trunk. Place the cursor on the
center of the aggregate location symbol for New York and click. Then place
the cursor on the center of the aggregate location symbol for Illinois and
click.
The trunk symbol is drawn between the two points just specified. The trunk
symbol is automatically given the addresses of the trunk modules on both
ends of the trunk and subsequently appears green. The trunk name, as
known by the Core System, appears as the trunk label (that is, NYILtrk1).
NOTE:
In the editor, any “line” type symbol (for example, a trunk) that has an
endpoint within another symbol is automatically associated with that
symbol. In the above example, trunk line symbol NYILtrk1 is associated
with the aggregate location symbols for New York and Illinois. If the
aggregate location symbols for New York or Illinois are moved or deleted,
the associated trunk symbol also is moved or deleted.
10-34
StarKeeper II NMS Graphics System Guide, R10.0, Issue 1
Administering Network Monitor
4.
Repeat Steps 3 and 4 to add ILCAtrk1 and TXCAtrk1 to the map,
connecting the appropriate aggregate location symbols.
0
Moving a Label
When a trunk is added, a trunk label is automatically placed just below the center
of the line. If so desired, now move a label.
Procedure 10-8.
Moving a Label
1.
Click on the TXCAtrk1 label.
2.
In the Edit Maps Window, choose Edit, then choose Move Object.
The mouse cursor automatically jumps to the map and changes to a crosshair shape inside a small square.
3.
Point to the new location for the label and click.
4.
Repeat Steps 1 through 3 for the remaining trunk labels.
When a trunk line, or any line, is moved, a label is automatically
repositioned to be under the center of the line.
Adding the Trunk Aggregate Symbol
0
To add the trunk aggregate symbol for the two trunks between New York and
Texas, you must use the editor legend.
Procedure 10-9.
Adding the Trunk Aggregate Symbol
1.
In the Edit Maps Window, choose Edit, then choose Equipment, then
choose Pick From Legend.
2.
In the editor legend, click on the trunk aggregate symbol.
The mouse cursor automatically jumps to the center of the map and
changes to a cross-hair shape.
3.
Click on the center of the New York aggregate location symbol and then
click on the center of the Texas aggregate location symbol on the map.
The trunk aggregate symbol initially appears white, since a map pointer
has not yet been defined for this aggregate symbol.
StarKeeper II NMS Graphics System Guide, R10.0, Issue 1
10-35
Administering Network Monitor
Adding the Label for Trunk Aggregate Symbol
0
To add a label for the trunk aggregate symbol, click on the trunk aggregate symbol
on the map and add the label, TrkAggr1, in the same way as you did for the
aggregate location symbol (see Procedure 10-5, Adding the Label for Texas
Aggregate Location Symbol).
Setting the Map Pointer for Trunk Aggregate
Symbol
0
Similar to Procedure 10-4, Setting the Map Pointer for Texas Aggregate
Location Symbol, set the map pointer for the trunk aggregate symbol.
Procedure 10-10. Setting the Map Pointer for Trunk Aggregate Symbol
1.
Click on the trunk aggregate symbol in the map if it is not already selected.
2.
In the Edit Maps Window, choose Options, then choose Set Map Pointer.
3.
In the pop-up window, type TrkAggr1, that the trunk aggregate symbol
points to, then choose OK .
This creates an empty map file, TrkAggr1 and the aggregate location
symbol turns green. You can edit this map later to show the individual
trunks represented by the trunk aggregate symbol.
10-36
StarKeeper II NMS Graphics System Guide, R10.0, Issue 1
Administering Network Monitor
After adding trunks, a trunk aggregate symbol, and a label, the map now looks
similar to the following screen:
Screen 10-11.
Adding Trunks and Trunk Aggregate Symbols
Setting the Map Title for Top Map
0
Each map can have a title that is displayed in the window title bar (window header
of the Edit Maps Window or Network Map Window). Now set the title for the
sample top map.
Procedure 10-11. Setting the Map Title for Top Map
1.
In the Edit Maps Window, choose Options, then choose Set Title.
2.
In the pop-up window, enter the title, USA Network, then choose
OK
.
The title then appears in the Edit Maps Window title bar.
StarKeeper II NMS Graphics System Guide, R10.0, Issue 1
10-37
Administering Network Monitor
0
Saving the Top Map
Now that you have supplied a background, added aggregate location symbols,
added StarKeeper II NMS symbols, and have connected the components, you are
ready to save the top map. Each map is a separate file and must be named
according to HP-UX file naming conventions. The file name must be all one word
of 14 characters or less and must contain no spaces. It cannot begin with a
character that is not a letter or number; never use special characters (for example,
!, ", *, ;, \, &, >, <, |, $, @, /, or ?).
The map is automatically placed in the appropriate directory so that after
choosing View Network Status from the Control Window, the maps can be found.
Now save the top map.
Procedure 10-12. Saving the Top Map
1.
In the Edit Maps Window, choose File, then choose Save.
2.
In the pop-up window, enter the file name, USA, then choose
OK
.
The map is saved in a file, USA, and an informational message appears in the
Edit Maps Window footer.
NOTE:
If you have not entered a map title, the file name you supply becomes the
default title and appears in the window title bar.
Step 6: Setting the Top Map Parameter
As discussed earlier in the Map Hierarchy Definition section, one map must be
designated as the top map for the hierarchy. The file name of the map to be used
as the top map is set from the Control Window Administer menu. Now set the top
map parameter.
Procedure 10-13. Setting Top Map Parameter
10-38
1.
In the Control Window, choose Administer, choose Administer Maps,
then choose Set Top Map.
2.
In the pop-up window, choose the map, USA, then choose
3.
A pop-up message window will appear advising the operator that the new
Top Map will not appear on the Network Monitor Map until the “View
Network Status” task is reinvoked. Choose “OK.”
OK
.
StarKeeper II NMS Graphics System Guide, R10.0, Issue 1
Administering Network Monitor
The next time you choose View Network Status from the Control Window, the
map hierarchy is loaded into memory using this new top map setting.
Step 7: Editing a Regional Map
After creating and saving the top map, the next step is to edit regional maps for
New York, Illinois, California, and Texas. These maps are pointed to from the
aggregate location symbols on the top map. For tutorial purposes, only the Texas
regional map will be edited.
An empty map file name, texas.region, was created when the map pointer was set
for the aggregate location symbol, labeled TXaggr. This regional map contains
more detail of the network in the Texas region. As drawn on the paper map shown
in Figure 10-7 of Phase I, the Texas regional map contains two BNS-2000 VCS
nodes, a BNS-2000 node, a COMSPHERE 6800 Series NMS, an LCS50
Datakit II VCS Network Interface, a concentrator, and four trunks.
Loading a Regional Map
0
To begin editing this map, you must load it first.
Procedure 10-14. Loading a Regional Map
1.
In the Edit Maps Window, choose File, then choose Load.
In a pop-up window, a list appears that contains the file names of all the
network maps.
2.
In the pop-up window, scroll down and choose texas.region, then choose
OK .
An empty Texas map now appears in the Edit Maps Window.
Adding a Geographic Background
0
Similar to Procedure 10-2, Adding Background for Top Map, add the
geographic background to the Texas regional map.
Procedure 10-15. Adding Background for Regional Map
1.
In the Edit Maps Window, choose Edit, then choose Background.
2.
In the pop-up window, choose Texas, then choose
StarKeeper II NMS Graphics System Guide, R10.0, Issue 1
OK
.
10-39
Administering Network Monitor
NOTE:
The setting of a map background is optional. If no action is taken, a
background is not associated with the map. Not choosing a background is
acceptable.
0
Adding Nodes
Now place the node symbols on the Texas regional map.
Procedure 10-16. Adding Nodes
1.
In the Edit Maps Window, choose Edit, then choose Equipment, then
choose Add Nodes/Systems.
In a pop-up window, a list appears that contains an entry for each Core
System, to which the Graphics System is logically connected, and for each
node and system that the Core System monitors.
2.
In a pop-up window, scroll down and choose [westSK]/USA/TX/Dallas/tx1,
then choose OK . If you want the symbol to appear in other than the
default size, choose Select Object Size first, then select the desired size
and choose OK . You can also resize the object after it is placed.
Screen 10-12.
Adding Nodes
The mouse cursor automatically jumps to the center of the map and
changes to a cross-hair shape inside a small square.
10-40
StarKeeper II NMS Graphics System Guide, R10.0, Issue 1
Administering Network Monitor
3.
Point to the area where you want to place the node and click.
The node symbol appears green, indicating that the network address for
this node symbol was automatically set to what was chosen from the list.
The local nodename, tx1, appears as a label.
4.
Repeating Steps 3 and 4, choose nodes tx2 and tx3 from the list and place
them on the map.
Adding Other Systems
0
The Texas area also has an LCS50 Datakit II VCS Network Interface and a
COMSPHERE 6800 Series NMS, which are monitored by the Core System,
westSK. Any node or system that is monitored by a Core System logically
connected to your Graphics System, as well as the Core System themselves,
appears in the list of nodes and systems.
Now add these systems.
Procedure 10-17. Adding Other Systems
1.
In the Edit Maps Window, choose Edit, Equipment, and then choose Add
Nodes/Systems. Choose [westSK]TXnik1, then choose OK .
The mouse cursor automatically jumps to the center of the map and
changes to a cross-hair shape inside a small square.
2.
Point to the area where you want to place TXnik1 and click.
3.
Repeat Steps 1 and 2 for the COMSPHERE 6800 Series NMS, TXcom1.
The COMSPHERE 6800 Series NMS is represented by the general
Element Management System (EMS) symbol (E).
The Texas map now looks similar to the following screen:
StarKeeper II NMS Graphics System Guide, R10.0, Issue 1
10-41
Administering Network Monitor
0
Screen 10-13.
Adding Other Systems
Adding a Concentrator/SAM
0
To add a Synchronous/Asynchronous Multiplexer (SAM), as shown in Figure 10-7
in Phase I on the Texas regional map, use the following procedure:
Procedure 10-18. Adding a Concentrator/SAM
1.
In the Edit Maps Window, choose Edit, then choose Equipment, then
choose Add Concentrators/SAMs.
In a pop-up window, a list appears that contains all known concentrators/
SAMs in the network.
2.
In the pop-up window, scroll down and choose the SAM with the network
address of [westSK]USA/TX/Houston/tx2:6, then choose OK .
The mouse cursor automatically jumps to the center of the map and
changes to a cross-hair shape inside a small square.
3.
10-42
Point to the area where you want to place the SAM on the map and click.
StarKeeper II NMS Graphics System Guide, R10.0, Issue 1
Administering Network Monitor
The concentrator symbol is green since its network address has already
been set to that chosen from the list. The local node name and module
address of the link module in the node that connects to the concentrator
appears as a label.
Moving a Label
0
Sometimes, a symbol's label is blocking the path for drawing a trunk line or other
connection (for example, the label for the BNS-2000 VCS tx3).
Adding Trunks and Labels
0
As shown in Figure 10-7 and Table 10-3 of Phase I, six trunks are located in part
or entirely in the Texas region. Similar to Procedure 10-7, Adding Trunks, use
the list of trunks to place these trunks on the map in the same way that was done
for the top map.
Trunks TXtrk1, TXtrk2, and TXtrk3 connect the nodes within the Texas region.
Trunks TXCAtrk1, NYTXtrk1, and NYTXtrk2 connect the Texas region to other
areas in the network. The latter trunks can be placed on the map so that one end
is on the appropriate Texas node and the other end is placed at the edge of the
map.
Adding a label to these trunks is similar to Procedure 10-5, Adding a Label for
Texas Aggregate Symbol.
StarKeeper II NMS Graphics System Guide, R10.0, Issue 1
10-43
Administering Network Monitor
Add a label to indicate that the other end is in a different region (for example, "To
New York" and "To California"). The regional Texas map now looks similar to this:
Screen 10-14.
Adding Trunks and Labels
Adding a Concentrator/SAM Link
0
Now show the connection between the SAM symbol and the node to which the
SAM is subordinate, tx2.
Procedure 10-19. Adding a Concentrator/SAM Link
1.
In the Edit Maps Window, choose Edit, then choose Equipment, then
choose Pick From Legend.
2.
In the editor legend, click on the Concentrator/SAM Link symbol.
This symbol looks like a trunk, but has different properties (that is, one
address instead of two).
10-44
StarKeeper II NMS Graphics System Guide, R10.0, Issue 1
Administering Network Monitor
The mouse cursor automatically jumps to the center of the map and
changes to a cross-hair shape.
3.
Point to the center of the SAM symbol and click.
This identifies what address to give the concentrator link, since a
concentrator link has the same network address as the concentrator.
4.
Point to the center of the tx2 node symbol and click.
The concentrator link appears in green with its network address already
set.
Adding Other Connecting Symbols
0
A CPM connection is not considered a trunk or a concentrator link. To show these
connections, or any other generic single address connection on a map, use the
following procedure:
Procedure 10-20. Adding Other Connecting Symbols
1.
In the Edit Maps Window, choose Edit, then choose Equipment, then
choose Pick From Legend.
2.
In the editor legend, click on one of the two unlabeled line symbols at the
bottom of the legend.
The mouse cursor automatically jumps to the center of the map and
changes to a cross-hair shape.
3.
Point to the center of the tx3 node symbol and click.
4.
Point to the center of the TXnik1 symbol and click.
The line initially appears white, since a network address has yet to be set
for it.
5.
To set the network address, click on the white line symbol on the map.
6.
In the Edit Maps Window, choose Options, then choose Set Network
Address.
7.
In the pop-up window, type [westSK]USA/TX/Austin/tx3:19, the fully
qualified network address for the CPM module, then choose OK .
NOTE:
Square brackets around the Core System name, the slashes, and the colon
must be entered correctly.
The line turns green, indicating the address has been set. Add other
connecting symbols that are to be reflected on the detail map.
StarKeeper II NMS Graphics System Guide, R10.0, Issue 1
10-45
Administering Network Monitor
Adding Scratch Pad Information
0
As discussed in Phase I, Scratch Pad information can be associated with map
symbols to aid in solving certain network problems. The information entered for a
particular piece of equipment will be displayed when the symbol is selected and
you choose Commands, then choose Display Info in the Network Map Window.
You can add Scratch Pad Text only for locally monitored objects (for example,
trunks, nodes, and concentrators).
Now add Scratch Pad information for the trunk that exists between the Texas and
California nodes.
Procedure 10-21. Adding Scratch Pad Information
1.
In the map, click on the trunk symbol for trunk TXCAtrk1.
2.
In the Edit Maps Window, choose Options, then choose Scratch Pad
Text.
3.
The pop-up window displays Scratch Pad information that has already
been entered—none in this case:
Screen 10-15.
4.
Adding Scratch Pad Information
Enter whatever information is useful for fault management tasks into the
Scratch Pad window and when finished, choose OK .
NOTE:
The Scratch Pad text is stored in the configuration database on the Core
System and can be a maximum of 200 characters.
10-46
StarKeeper II NMS Graphics System Guide, R10.0, Issue 1
Administering Network Monitor
Special characters such as the "|" and the "&" should be avoided when
entering text into the Scratch Pad window. These characters may interfere
with the window formatting.
Setting the Map Pointer for a Node Symbol
0
The next step in creating this Texas regional map is to set the map pointer for the
tx3 node symbol to point to a detailed map showing the tx3 node and its
associated concentrators. Now set the map pointer for tx3.
Procedure 10-22. Setting the Map Pointer for a Node Symbol
1.
Click on the tx3 node symbol in the map.
2.
In the Edit Maps Window, choose Options, then choose Set Map Pointer.
3.
In the pop-up window, overwrite the existing File Name (which will be a
pointer to the shelf map) with tx3node, then choose OK .
A blank file, tx3node, is automatically created.
NOTE:
If a map pointer is not set for a node symbol or a concentrator or SAM
symbol, those symbols automatically point to empty shelf maps and an
associated file name has already been assigned; you need not set a map
pointer for these symbols if you want them to point to the respective shelf
maps. However, if you want to set map pointers to point to other maps
besides shelf maps, overwrite the file name that is supplied.
Setting the Map Title for Texas Regional Map
0
Similar to Procedure 10-11, Setting Map Title for Top Map, set the map title for
the regional map in the same way.
Procedure 10-23. Setting the Map Title for Texas Regional Map
1.
In the Edit Maps Window, choose Options, then choose Set Title.
2.
In the pop-up window, overwrite any existing title that may be present with
Texas Region. Then choose OK .
The title then appears in the Edit Maps Window title bar.
StarKeeper II NMS Graphics System Guide, R10.0, Issue 1
10-47
Administering Network Monitor
0
Saving the Regional Map
After supplying a background and title, adding equipment, adding connections,
and setting the map pointer for the tx3 node, it is time to save this regional map.
Similar to Procedure 10-12, Saving the Top Map, save the regional map.
Procedure 10-24. Saving the Regional Map
1.
In the Edit Maps Window, choose File, then choose Save.
In the pop-up window, the file name texas.region appears, since this file
existed before you started editing it.
2.
In the pop-up window, choose
OK
.
A confirmation notice appears, asking you if you want to overwrite the file that
currently exists. Since you have made changes, choose OK to confirm the
overwriting. The map is then saved in the appropriate file and an informational
message appears in the Edit Maps Window footer.
Step 8: Editing a Detailed Map of tx3 Node
As shown in Figure 10-8 of Phase I, it was decided that a map displaying more
detail of the tx3 node was needed. This map contains the node itself, two
concentrators (TXconc1, TXconc2), a SAM (tx3:27), some unmonitored
equipment—hosts, a FEP, an LCS50 Datakit II VCS Network Interface (TXnik1)
and ATMs. To begin editing this detailed map of the tx3 node, load it first.
Procedure 10-25. Loading a Regional Map of tx3 Node
1.
In the Edit Maps Window, choose File, then choose Load.
2.
In the pop-up window, scroll down and choose tx3node, then choose
OK .
This reads in the blank map created when the map pointer was set for the tx3
node symbol on the Texas regional map.
Adding the tx3 Node Symbol
0
Similar to Procedure 10-16, Adding Nodes, add the tx3 node to the center of the
map using the list of nodes.
10-48
StarKeeper II NMS Graphics System Guide, R10.0, Issue 1
Administering Network Monitor
Adding Concentrators/SAMs
0
Similar to Procedure 10-18, Adding a Concentrator/SAM, add the concentrator/
SAM symbols for the tx3 node to the map by using the list of concentrators/SAMs.
Adding Concentrator/SAM Links
0
Similar to Procedure 10-19, Adding a Concentrator/SAM Link, add the
concentrator/sam links between the concentrators/sams and the node symbol
using the editor legend.
NOTE:
Remember to place the concentrator/SAM endpoint of the link first on the
appropriate concentrator/SAM symbol.
Adding Unmonitored Objects
0
Now place the unmonitored objects that were planned in Figure 10-8 of Phase I
on the detailed map for tx3.
Procedure 10-26. Adding Unmonitored Objects
1.
In the Edit Maps Window, choose Edit, then choose Equipment, then
choose Pick From Legend.
The editor legend is displayed as in Screen 10-10.
2.
In the editor legend, click on the Front End Processor (FEP) symbol and
place it on the map.
3.
In the editor legend, click on the Host symbol and place it on the map.
4.
Repeat Step 3 two more times to place two more Host symbols on the
map.
5.
In the editor legend, click on the Terminal symbol and place it on the map
to represent a terminal as shown in Figure 10-8 of Phase I.
6.
Repeat Step 5 to place another terminal on the map.
7.
As discussed in Step 5 of Phase I, place an unmonitored LCS50 Datakit II
VCS Network Interface on the map. To do so, click on the NIK symbol in
the editor legend and place it on the map.
Adding Other Connecting Symbols
0
Similar to Procedure 10-20, Adding Other Connecting Symbols, add the lines
representing connections to unmonitored equipment. Set the network address for
the lines so that they will reflect alarm activity on those connections.
StarKeeper II NMS Graphics System Guide, R10.0, Issue 1
10-49
Administering Network Monitor
0
Adding Labels
Similar to Procedure 10-5, Adding a Label for Texas Aggregate Location
Symbol, add labels for all equipment placed on the detailed map for the tx3 node.
Setting the Map Title for Detailed Map
0
Similar to Procedure 10-23, Setting the Map Title for Texas Regional Map, set
the map title for the detailed map of the tx3 node to Detailed Map for USA/TX/
Austin/tx3 node
The detailed map of the tx3 node now looks similar to this:
Screen 10-16.
Adding Unmonitored Objects and Connections
Saving the Detailed Map
0
Similar to Procedure 10-24, Saving the Regional Map, save the detailed map of
the tx3 node to a file named tx3node.
10-50
StarKeeper II NMS Graphics System Guide, R10.0, Issue 1
Administering Network Monitor
Step 9: Editing a Detailed Map for TrkAggr1
The last map to be edited in this tutorial is the empty trunk detail map, TrkAggr1.
This empty map was created when you set the pointer for the trunk aggregate
symbol on the top map (refer to Procedure 10-10, Setting Map Pointer for
Trunk Aggregate Symbol). Now begin editing the detailed trunk map so that it
matches the detailed trunk map as planned in Figure 10-9 of Phase I:
Procedure 10-27. Loading a Detailed Map of TRKAggr1
1.
In the Edit Maps Window, choose File, then choose Load.
2.
In the pop-up window, choose TrkAggr1, then choose
OK
.
This reads in the existing empty map.
3.
In the Edit Maps Window, choose Edit, then choose Equipment, then
choose Add Trunks.
4.
In the pop-up window, scroll down and choose NYTXtrk1, then choose
OK .
5.
Place the first trunk on the map, as shown in Figure 10-9 of Phase I.
6.
In the pop-up window, choose NYTXtrk2 and place it on the map so the
final map looks similar to the following screen:
Screen 10-17.
7.
Adding Trunks to a Detailed Map of TrkAggr1
Similar to Procedure 10-24, Saving the Regional Map, save the map and
close all pop-up windows.
StarKeeper II NMS Graphics System Guide, R10.0, Issue 1
10-51
Administering Network Monitor
NOTE:
For tutorial purposes, editing the remaining maps will not be described.
Each remaining map would be built by using the same procedures as
outlined here, until all the planned regional maps depicted in Phase I had
been edited.
Step 10 Generating Shelf Maps
When planning the map hierarchy, it was decided to generate shelf maps for all
nodes and concentrators in the sample network. These maps are generated
automatically with just a few mouse clicks.
Node and concentrator/SAM symbols are automatically linked to the appropriate
shelf map file. Using Generate Shelf Maps replaces the contents of the
appropriate shelf file. Shelf maps can be kept up to date with changing
configurations by re-generating any shelf maps for nodes or concentrators/SAMs
that have changed.
Shelf maps can be generated only for nodes and concentrators that are monitored
by a Core System to which a Graphics System is logically connected. Information
about each module must reside on the Core System. This information can be
uploaded from the nodes using the StarKeeper II NMS skload and cfg_sync
commands. For more information on these commands, use the Core System help
command.
Shelf Map generation takes some time to complete. A notice is sent to the Bulletin
Board when all the shelf maps have been generated. Any error messages that
may result from the shelf map generation are sent to the Bulletin Board with more
detailed errors messages being sent to the current log file in $EVENTLOG
directory.
Generating Shelf Maps for All Nodes
0
Now generate the shelf maps for all nodes.
Procedure 10-28. Generating Shelf Maps for All Nodes
10-52
1.
In the Control Window, choose Administer, then choose Administer
Maps.
2.
In the Administer Maps menu, choose Generate Shelf Maps.
3.
In the Generate Shelf Maps menu, choose All Nodes.
4.
A pop-up message window will appear advising the operator that the new
shelf maps will not appear on a Network Monitor shelf map until the “View
Network Status” task is reinvoked. Choose “OK.”
StarKeeper II NMS Graphics System Guide, R10.0, Issue 1
Administering Network Monitor
The shelf maps for all nodes are populated with the configuration data of the Core
System database(s) to which your Graphics System is logically connected.
Generating Shelf Maps for Selected Nodes
0
Instead of generating shelf maps for all nodes, you can alternatively be selective.
Procedure 10-29. Generating Shelf Maps for Selected Nodes
1.
In the Control Window, choose Administer, then choose Administer
Maps.
2.
In the Administer Maps menu, choose Generate Shelf Maps.
3.
In the Generate Shelf Maps menu, choose Selected Nodes.
A pop-up window appears, that contains a scrolling list of nodes.
4.
In the pop-up window, choose as many nodes as desired in the list.
5.
Choose OK when the correct set of nodes have been highlighted to
begin the shelf map creation process.
6.
A pop-up message window will appear advising the operator that the new
shelf maps will not appear on a Network Monitor shelf map until the “View
Network Status” task is reinvoked. Choose “OK.”
The shelf maps for the selected nodes are populated with the configuration data
from the Core System database(s) to which your Graphics System is logically
connected.
Generating Shelf Maps for All Concentrators/
SAMs
0
Now generate the shelf maps for all concentrators/SAMs.
Procedure 10-30. Generating Shelf Maps for All Concentrator/SAMs
1.
In the Control Window, choose Administer, then choose Administer
Maps.
2.
In the Administer Maps menu, choose Generate Shelf Maps.
3.
In the Generate Shelf Maps menu, choose All Concentrators/SAMs.
4.
A pop-up message window will appear advising the operator that the new
shelf maps will not appear on a Network Monitor shelf map until the “View
Network Status” task is reinvoked. Choose “OK.”
StarKeeper II NMS Graphics System Guide, R10.0, Issue 1
10-53
Administering Network Monitor
The shelf maps for all concentrators/SAMs are populated with the configuration
data from the Core System database(s) to which your Graphics System is
logically connected.
Generating Shelf Maps for Selected
Concentrators/SAMs
0
Instead of generating shelf maps for all concentrators/SAMs, you can select, by
node, which concentrator/SAM shelf maps should be generated.
Procedure 10-31. Generating Shelf Maps for Selected Concentrators/SAMs
1.
In the Control Window, choose Administer, then choose Administer
Maps.
2.
In the Administer Maps menu, choose Generate Shelf Maps.
3.
In the Generate Shelf Maps menu, choose Selected Concentrators/
SAMs.
A pop-up window appears, that contains a scrolling list of nodes.
4.
In the pop-up window, choose as many nodes as desired in the list.
Shelf maps will be generated for each concentrator and SAM subordinate
to the selected nodes.
5.
Choose OK when the correct set of nodes has been highlighted to begin
the shelf map creation process.
6.
A pop-up message window will appear advising the operator that the new
shelf maps will not appear on a Network Monitor shelf map until the “View
Network Status” task is reinvoked. Choose “OK.”
The shelf maps for the selected concentrator/SAMs are populated with the
configuration data from the Core System database(s) to which your Graphics
System is logically connected.
10-54
StarKeeper II NMS Graphics System Guide, R10.0, Issue 1
Administering Network Monitor
Step 11: Testing Maps Checklist√
Before you actually use the maps that reflect your network, it is recommended that
you test them first by exercising prominent features and functionality.
The following checklist is designed to help you perform the testing, but for the
actual procedure, you need to review the material in Chapter 11 that describes
the Network Map Window and its functionality, and the remainder of this chapter.
Table 10-7.
Steps for Testing Map Hierarchy
Step #
Task
1
Check that the map hierarchy initializes when you choose
Monitor and then View Network Status in the Control
Window. Error messages are produced if there is a problem.
2
Check to see that all maps were created and properly linked
together, including shelf maps. Do this by navigating up and
down through the map hierarchy.
3
Use these commands on each applicable symbol:
√
a. Display Info
b. Diagnostics
c. List Alarms
4
Check for new equipment that may not be reflected in the
maps. You can do this by requesting an alarm list and
checking that every alarm is reflected in the maps.
5
Check that the map symbols become appropriately
highlighted to show the severities of the alarms received,
provided that all relevant equipment is represented on your
maps and that you are displaying the appropriate map (for
example, the top map). If not, check the alarm filter names
specified on the Graphics System and the filter criteria set on
the appropriate Core System.
StarKeeper II NMS Graphics System Guide, R10.0, Issue 1
10-55
Administering Network Monitor
Defining User Notices
You can define user notices so that you are alerted to specific network problem
areas. User Notices appear in the Network Status Window. They display the total
number of outstanding alarms that match the criteria you defined for the notice.
User notices in the Network Status Window can also be used as a short-cut to
access the list of alarms that match the criteria specified in the notice. You can
define up to six different user notices.
Some possible uses of user notices include highlighting these events:
■
alarms on important network addresses (for example, Data Center ports)
■
trunk alarms
■
CPM alarms
■
Session Maintenance (SM) alarms
■
link down (LD) alarms
■
alarms from a particular server, router, or Element Management System.
The criteria that are used to define a user notice are:
■
network address
■
module type category (that is, trunk or CPM)
■
one to five alarm message IDs or ranges of message IDs
For the sample network described in the tutorial on building a map hierarchy, a
user notice for all trunk alarms will be created.
Procedure 10-32. Defining User Notices
10-56
1.
In the Control Window, choose Administer, then choose Define User
Notices.
2.
Select the notice you want to define on the Notice # control.
StarKeeper II NMS Graphics System Guide, R10.0, Issue 1
Administering Network Monitor
Screen 10-18.
3.
Define User Notices Window
In the label field, type Trunks.
Note that a label is required. This label, Trunks, will appear in the Network
Status Window under the first user notice. See Chapter 11 for an example
of a user notice with a label of Trunks in the Network Status Window.
4.
Use the default value, Any, for the NMS address and Network Address
fields. Any means that the address criteria will not be used to limit alarms
that are received. See Chapter 12 for more details on these fields.
5.
Choose Trunks from the Module Type setting.
6.
Use the default value (blank) for the Message ID field. The default value
means that the Message ID criteria will not be used to limit alarms that are
received. See Chapter 12 for more details on this field.
7.
Choose
OK
to save this notice definition and to exit this pop-up window.
StarKeeper II NMS Graphics System Guide, R10.0, Issue 1
10-57
Administering Network Monitor
For this notice, you need not supply any more information. All alarms on trunk
module types (for example, TRK-DDS, TRK-T1, SWT, SFT) on any network
address will now be matched by this user notice.
Changes to user notices will take effect on the next initialization of the Network
Monitor Status Window.
Defining User Notices for BNS-2000 Messages
In defining Message IDs for user notices, remember Message IDs for BNS-2000
VCS alarms consist entirely of digits, where message IDs for BNS-2000 alarms
consist of digits plus a "B" suffix. Ranges specified without a "B" suffix will not
match BNS-2000 alarms; ranges specified with a "B" suffix will not match BNS2000 VCS alarms. Message IDs that are not entered as ranges will match any
alarm with the same initial component. The following table will help to illustrate this
relationship:
Enter This Message ID
To Specify These Message IDs
8120
8120, 8120B
8120B
8120B
8120-8124B
8120B to 8124B
8120B-8124B
8120B to 8124B
8120-8124
8120 to 8124
Using Wildcards in Network Addressing
Network Monitor has refined the use of wildcards to be more applicable to typical
user scenarios, when specifying the network address for the following:
■
List Alarms Command Window
■
Clear Alarms Command Window
■
Define User Notice Command Window
As a brief review, a complete network address consists of information to the left of
a colon (:) and to the right of a colon. The data to the left of the colon are the
logical components of the four-level addressing scheme; the data to the right of
the colon are the physical components (for example; module, port). As an
example, USA/NY/Buffalo/ny2:50.1 has logical components to the left of the
colon and physical components to the right of the colon. Refer to Chapter 3 in the
StarKeeper II NMS Core System Guide for a full discussion of network addressing
components.
10-58
StarKeeper II NMS Graphics System Guide, R10.0, Issue 1
Administering Network Monitor
Each of the above listed windows has a Network Address field, where you can
enter an address and use a wildcard pattern matching technique. Enter the
desired network address into the field; if you wish, you may append an asterisk
(the wildcard symbol) to a partial logical component of the address. This will
specify all addresses beginning with the same address string but ending with any
pattern. For example USA/NY/Buffalo/ny* will match any pattern that starts
with the same address string. The "ny*" portion will match such addresses as:
ny1, ny2, nystate, nynode, etc.
Be aware of two important limitations of the wildcard symbol in Network Monitor:
1.
The asterisk can only be placed at the end of a pattern string (representing
a partial logical component of the address), not at the start of a string, and
not in the middle; although an asterisk may be entered by itself.
2.
The asterisk cannot be used to the right of the colon.
Alarms on all components of a specified node or system element to the right of
the colon are always matched.
! WARNING:
Always use the recommended conventions for addressing components in a
network and exercise care in the use of wildcards. For example, getting a list
of alarms from more origins than you expected is not as serious a setback
as clearing more alarms than you desired.
ind
will NOT match
indiana/x/y
ind
will ONLY match
ind
indiana
WILL match
indiana/x/y
indiana/z/w
...anything beginning with indiana/
ind*
WILL match
...all of the above
indabc/x/y
inddef/x/y
...anything beginning with ind
StarKeeper II NMS Graphics System Guide, R10.0, Issue 1
10-59
Administering Network Monitor
Specifying Alarm Filters
By default, each Core System in your network sends alarms to your Graphics
System. However, you can screen some of these alarms so that only a subset of
all alarms are displayed on your Graphics System. This can be accomplished by
using alarm filters. Alarm filters regulate the alarms that are sent to your Graphics
System. Using alarm filters is purely optional, and if you do not take any action,
the default is to send all alarms to your Graphics System.
Alarm filters are created and given names on the Core System. Each filter created
contains criteria, such as network address and alarm severities. Refer to the
StarKeeper II NMS Core System Guide for more information on creating alarm
filters. From your Graphics System, you can only specify the filter names to be
used for each Core System, not create the filters.
Editing the Alarm Filter File
On your Graphics System, the $NM_ROOT/lib/filters file is provided and contains
the names of the alarm filters to use for each Core System. This file will need to
be edited after you have specified your alarm filters on the Core System, to
include your:
■
Core System names
■
names of your filters to be used
Refer to the EDIT_FILTER manual page in Appendix A for more information in
editing filters. You can use a filter positively, which means send only the alarms
which match the criteria of the filter to the Graphics System, or you can use a filter
negatively, which means do not send any alarm that matches the criteria of the
filter to the Graphics System. For a detailed explanation of positive and negative
filters, refer to the Alarm Conditioning section in Chapter 5 of the StarKeeper II
NMS Core System Guide.
In the filters file, you may specify one and only one filter to be used positively and
one and only one filter to be used negatively for each Core System machine.
There are two Core Systems in the sample network described in the preceding
tutorial. Use the procedure that follows to specify the name of the filters for each of
these two Core Systems. Assume that filters named posfltr1 and negfltr1 have
already been created on the Core System, eastSK. Different filters, named pf2
and nf2, have been created on the Core System, westSK.
10-60
StarKeeper II NMS Graphics System Guide, R10.0, Issue 1
Administering Network Monitor
The syntax for specifying a positive filter name in the filters file is:
<Core System name>.PF:
Tab
<Filter Name>
The syntax for specifying a negative filter name in the filters file is:
<Core System name>.NF:
Tab
<Filter Name>
Procedure 10-33. Specifying Alarm Filters
1.
Logon to the Graphics System where you want to edit the filters.
2.
Type su root and press
3.
Type the root password at the prompt and press
Enter
.
Enter
.
You now have permission to write into the filters file.
4.
Start editing the file $NM_ROOT/lib/filters using any editor of your choice
(for example, ed or vi).
5.
For the sample network described above, append the following lines to the
end of the filters file:
eastSK.PF:
eastSK.NF:
westSK.PF:
westSK.NF:
posfltr1
negfltr1
pf2
nf2
NOTE:
You can specify only one positive and one negative filter for each Core
System machine.
6.
Save the file.
StarKeeper II NMS Graphics System Guide, R10.0, Issue 1
10-61
Administering Network Monitor
The $NM_ROOT/lib/filters file should look similar to this:
# Filter name file
#******************************************************
# Lines beginning with # are comments.
# Filter name specifications must begin in column 1
#
# For Positive Filtering
# <StarKeeper II NMS Name>.PF:<Filter Name>
#
# For Negative Filtering
# <StarKeeper II NMS Name>.NF:<Filter Name>
#
#******************************************************
#
eastSK.PF:posfltr1
eastSK.NF:negfltr1
westSK.PF:pf2
westSK.NF:nf2
Screen 10-19.
Alarm Filters File
You can invoke the new filters immediately by issuing the Network Monitor
filter_sync command, as the next section discusses. Alternatively, the filters will
be used the next time the Core System software is restarted.
Synchronizing Alarms
After editing the $NM_ROOT/lib/filters file, you need to use the filter_sync
command if you want the filters to go into effect immediately. You must have
Graphics System administrator privileges in order to issue this command. The
filter_sync command restarts the alarm collector process on your Graphics
System. The alarm collector process, as its name suggests, is responsible for
collecting alarms from the Core System to which a Graphics System is logically
connected. It is advisable to quit Network Monitor while you are synchronizing
alarms, but keep the Bulletin Board active. Any error conditions encountered in
the alarm synchronization process are displayed on the Bulletin Board. For more
information on error messages, see Appendix C.
Procedure 10-34. Synchronizing Alarms
10-62
1.
All users on this Graphics System must quit Network Monitor.
2.
Enter filter_sync and press Return . You must have Graphics System
administrator privileges in order to issue this command.
StarKeeper II NMS Graphics System Guide, R10.0, Issue 1
Administering Network Monitor
3.
Start the Network Monitor application once again. This restarts the nm_ac
process.
NOTE:
When you modify the criterion of an existing filter that is in effect on the
Core System, the alarm handling process on that Core System is notified of
the change by the alarm conditioning process. As long as the alarm
handler has applied that filter criterion to all alarms it is sending to the
Graphics System that is of interest, no action is necessary to make the
changed filter criterion apply to new incoming alarms. As long as you only
want to apply the changes to the filter criterion to new incoming alarms,
filter_sync does not have to be run from the particular Graphics System,
and the Network Monitor maps will still reflect a consistent alarm database.
New alarms that come in will be filtered according to all of the records in the
specific filter criterion, including the ones that are additions or changes.
Deleted records within that criterion will no longer be included in the filter
criterion, so they will not be used on new incoming alarms. So, if you want
to affect the stream of new alarms, filter_sync is not needed.
However, filter_sync is required if you want to apply the new records in the
filter criterion to all alarms, including those already in the database. In that
case, it is necessary to run the filter_sync command, take down the maps,
and bring them up again.
Updating Maps
If you know that the configuration data in your network has changed, you must
update the network maps. You must manually update the network maps you
created by using the map editor. The shelf maps can be updated by requesting
that they be automatically generated once again. If a node name has changed,
remove the old node from each map it is presently on and then add the new node.
The same holds true for trunk names and concentrator names if they have
changed.
Distributing Maps to Other Graphics
Systems
If you have two or more Graphics Systems that use the same set of network
maps, you can create and update the maps on one Graphics System and use the
Datakit II VCS Host Interface push command to send the map files to other
Graphics Systems.
StarKeeper II NMS Graphics System Guide, R10.0, Issue 1
10-63
Administering Network Monitor
NOTE:
Before you can use the Datakit II VCS Host Interface push command, you
must first authorize yourself to push to other Graphics System by using the
Datakit II VCS Host Interface dk hostname.authorize command. For
example, dk USA/Austin/system1.authorize. See the Datakit II VCS Host
Interface Installation and Administration Guide for more information on
these commands.
All of your network maps are contained in the directory named
$NM_ROOT/lib/USERMAPS. The USERMAPS directory contains two subdirectories—NETWORK and SHELVES. The NETWORK directory contains all the
map files you created with the map editor. The SHELVES directory contains all the
automatically generated node and concentrator/SAM shelf map files.
! CAUTION:
It is strongly recommended to not manually alter or edit the map files;
otherwise, unpredictable results may occur. Only create map files with the
map editor or by automatically generating them.
To send all map files to a second Graphics System (for example, wrkstn2) which is
physically located on the Albany BNS-2000 VCS node, use the following
procedure:
Procedure 10-35. Distributing All Maps
1.
Using the Cut-Through application, open a window to your local Graphics
System environment.
2.
Enter cd $NM_ROOT/lib and press
3.
Enter push USA/NY/Albany/wrkstn2 USERMAPS /tmp and press
Return
which copies the maps to the second Graphics System.
4.
Enter dk USA/NY/Albany/wrkstn2 and press
second Graphics System.
5.
Enter su root and press
prompt.
Return
and enter the root password at the
6.
Enter cd /tmp and press
Return
.
7.
Enter $NM_ROOT/bin/copymaps and press Return to copy the maps
into the correct directory on the second Graphics System.
Return
.
Return
to log onto the
An in-progress message will be displayed and the prompt will return
shortly. The new maps will be used when View Network Status is restarted
on the second Graphics System.
10-64
StarKeeper II NMS Graphics System Guide, R10.0, Issue 1
Administering Network Monitor
Old maps with the same name as new maps will be overwritten. Old maps
with no matching new map names will remain in that directory.
8.
Press
CTRL
d to log off the second Graphics System.
StarKeeper II NMS Graphics System Guide, R10.0, Issue 1
10-65
Administering Network Monitor
10-66
StarKeeper II NMS Graphics System Guide, R10.0, Issue 1
Using Network Monitor
0
11
This chapter provides two scenarios that may occur while you are monitoring your
network. These examples are not to be taken literally, but may help you get a feel
for the type of alarms that could be generated and the sequence of events that
you can follow to correct them. To maintain continuity, the sample network that
was created in Chapter 10 is used within this chapter. Concluding the chapter is a
discussion of night fold-down.
Figure 11-1 presents the window architecture for Network Monitor. The five
windows that are highlighted are the primary subjects in this chapter and include:
■
the Control Window
■
the Network Status Window
■
the Network Map Window
■
the List Alarms Window
■
the Diagnostics Window
StarKeeper II NMS Graphics System Guide, R10.0, Issue 1
11-1
Using Network Monitor
The remaining Network Monitor windows may also be briefly mentioned within this
chapter.
NETWORK MONITOR
CONTROL WINDOW
EDIT
MAPS
WINDOW
NETWORK
STATUS
WINDOW
NETWORK
MAP
WINDOW
LIST ALARMS
WINDOW
DIAGNOSTICS
WINDOW
Figure 11-1.
Window Architecture
Tutorial on Monitoring the Network
After you have planned for and created your network maps as described in
Chapter 10, you are ready to begin monitoring your network. The following tutorial
illustrates hypothetical problems that could happen as you monitor a network.
The intent of this tutorial is to illustrate possible problems that could occur as you
monitor a network and how you might use the features provided by the Network
Monitor application to solve those problems. It does not describe every command
in detail—see Chapter 12 for detailed information on each command.
NOTE:
This is a paper-only tutorial and is not interactive. You can try to follow the
tutorial on your Graphics System, but your network as well as the
configuration data in your Core System database(s), differs from the one
presented here. Therefore, you will not be able to monitor the network
presented here on your own Graphics System.
If you are monitoring a network for the first time, read this tutorial in its entirety. If
you are familiar with the topics, you can skip certain sections and immediately
access the section you need or go directly to Chapter 12.
11-2
StarKeeper II NMS Graphics System Guide, R10.0, Issue 1
Using Network Monitor
The following table outlines the items covered in the tutorial.
Table 11-1.
Steps for Monitoring a Network
Step #
Task
1
Starting HP VUE
2
Starting Network Monitor
3
Starting to Monitor the Network
Example I: A Host Computer Problem
Step 1: Check Network Status Window
Step 2: Check Top Map
Step 3: Display Regional Map
Step 4: Display Detail Map
Step 5: Display Shelf Level Map
Step 6: Display List Alarms Window
Step 7: Determine Problem
Step 8: Clear Alarms
Example II: A Trunk Problem
Step 1: Check Network Status Window
Step 2: Check Top Map
Step 3: Display List Alarms Window
Step 4: Display Textual Detail for an Alarm
Step 5: Display Help for an Alarm
Step 6: Run Diagnostics
Step 7: Clear Alarms
StarKeeper II NMS Graphics System Guide, R10.0, Issue 1
11-3
Using Network Monitor
Generic Monitoring Guidelines
In general, the steps you can use to monitor a network for faults and resolve
problems as they occur are as follows:
Table 11-2.
Generic Monitoring Guidelines
Step #
Task
1
Detect a network fault
2
Generally estimate what type of problem it is and where the problem
has occurred in the network
3
Determine exactly what the problem is and which particular piece of
equipment has failed
4
Decide the importance of the problem and if intervention is necessary
5
Consider alternative solutions
6
Implement a temporary and/or permanent fix
The tutorial that follows should help you understand how Network Monitor can be
used to aid in performing the above steps in a quick and efficient manner.
11-4
StarKeeper II NMS Graphics System Guide, R10.0, Issue 1
Using Network Monitor
Step 1: Accessing StarKeeper II NMS
To access the StarKeeper II NMS graphics application, select the StarKeeper II
NMS icon from the HP VUE Front Panel.
The StarKeeper II NMS subpanel is then displayed:
Screen 11-1.
HP VUE Control Window
StarKeeper II NMS Graphics System Guide, R10.0, Issue 1
11-5
Using Network Monitor
Step 2: Starting Network Monitor
To start Network Monitor, click on the Network Monitor icon of the StarKeeper II
NMS subpanel.
Step 3: Starting to Monitor the
Network
To begin monitoring the network for faults, use the following procedure:
Procedure 11-1.
1.
Starting to Monitor the Network
To start monitoring the network, in the Control Window, choose Monitor,
then choose View Network Status.
Choosing View Network Status loads the hierarchy of maps into memory and
produces the Network Status Window and one Network Map Window.
NOTE:
Loading the map hierarchy may take several seconds to a minute,
depending on the size of your network and the number of shelf maps you
have generated. The map hierarchy will not load unless the Top Map
parameter has been correctly set—refer to Procedure 10-13, Setting Top
Map Parameter.
11-6
StarKeeper II NMS Graphics System Guide, R10.0, Issue 1
Using Network Monitor
NOTE:
A maximum of 32 processes that display alarm information, such as the
View Network Status Window and the List Alarms Window, can be run
on a single Graphics System.
Screen 11-2.
Network Status Window and Network Map Window
The Network Map Window initially displays the top map and, in this case, it is a
map of the USA.
Example I: A Host Computer Problem
For the first example, a host computer connected to the network via a Computer
Port Module (CPM) has failed, but you do not yet realize it. Use the following steps
to discover the problem and correct it.
StarKeeper II NMS Graphics System Guide, R10.0, Issue 1
11-7
Using Network Monitor
Step 1: Check Network Status Window
While watching your Graphics System, notice that the Network Status Window
has changed. Both the alarm severity notices and user notices reflect outstanding
alarms.
Screen 11-3.
Network Status Window with Alarms
Check Network Alarm Severity Notices
0
In the Network Status Window, the network alarm severity notices reflect the
number of critical, major and minor alarms that have been received.
Check User Notices
0
NOTE:
In the Network Status Window, the user notice for CPM alarms indicates
that CPM alarms have been received. Refer to Chapter 10 for instructions
on how to create user notices.
11-8
StarKeeper II NMS Graphics System Guide, R10.0, Issue 1
Using Network Monitor
Step 2: Check Top Map
After checking the Network Status Window, you may want to check the top map to
locate the problem visually. The top map shows the aggregate location symbol,
representing Texas, as the color yellow—indicating a major alarm:
Screen 11-4.
Network Map Window with Major Alarm
The remainder of the network is green. Remember, that the aggregate location
symbol is yellow because it represents the highest severity of alarms of any object
on the map under it (map(s) to which this symbol points). See the Trickle-Up
section of Chapter 10 for more information.
Step 3: Display Regional Map
In order to get a better perspective of the Texas region and to get closer to the
source of the problem, now display the Texas regional map. You can display this
regional map in a new Network Map Window while continuing to display the top
map in the original Network Map Window. This allows you to observe the entire
network while concentrating on the Texas region.
StarKeeper II NMS Graphics System Guide, R10.0, Issue 1
11-9
Using Network Monitor
Procedure 11-2.
Display Regional Map in a New Network Map Window
1.
In the Network Map Window that is displaying the top map, click on the
yellow Texas aggregate location symbol.
2.
In the same Network Map Window, choose View then choose Down to
display the Down menu.
3.
Choose New Window to display the Texas regional map in a new Network
Map Window.
Screen 11-5.
Regional Map of Texas with Major Alarm
NOTE:
To save screen space, you may make the original Network Map Window
smaller using the re-size corners in the window. You may also move the
window to a place where it is still visible, but out of the way.
On the regional map, observe that the tx3 node is yellow, while the rest of the
network is green. This indicates that all of the alarms came from the USA/TX/
Austin/tx3 node.
11-10
StarKeeper II NMS Graphics System Guide, R10.0, Issue 1
Using Network Monitor
Step 4: Display Detailed Map of tx3 Node
At this point, to get closer to the root of the problem, display the detailed map of
the tx3 node. To quickly display the detailed map of the tx3 node, click twice on the
tx3 node symbol on the Texas regional map.
Screen 11-6.
Detailed Map of Node USA/TX/Austin/tx3
This refreshes the Network Map Window that is displaying the Texas regional map
and displays a detailed map of the USA/TX/Austin/tx3 node.
NOTE:
Clicking twice while pointing to a map object is an accelerator for clicking
once on the object and choosing View, then choosing Down and Same
Window.
Observe that this node has connections to several hosts and an unmonitored
LCS50 Datakit II VCS Network Interface. The CPM connection to HostC is yellow,
indicating there are major alarms on this network address.
StarKeeper II NMS Graphics System Guide, R10.0, Issue 1
11-11
Using Network Monitor
Step 5: Display Shelf Level Map
At this point, to get even closer to the root of the problem, display the shelf level
map of the node. To display the shelf level map, click twice on the node or entity
you wish to view.
The following screen is an example of a shelf level map. The remainder of this
tutorial uses the node mimosa in the examples.
Screen 11-7.
Shelf Level Map: Series M1 and M2 Shelves
Network Monitor representations of the BNS-2000 node start with the Switching
Shelf, Shelf 0. From this shelf you can navigate to the Series M1 (low speed) and
other M2 (high speed) shelves, as follows:
11-12
■
To navigate to a Series M1 shelf, click on the desired CIM module in Shelf
0. As an example, as shown in Screen 11-7, to choose a representation of
M1 Shelf 4, click on the CIM module in Module Address 4 of the Switching
Shelf.
■
Series M2 Shelves (that are not Shelf 0) have boxes labeled with the shelf
number in the lower right hand corner of the windows. To navigate to a
Series M2 shelf, click on the desired labeled box, for example you could
click on Shelf 3.
■
If you see numbers in parentheses next to a CIM, they refer to the module
address of the shelf to which the CIM is connected.
StarKeeper II NMS Graphics System Guide, R10.0, Issue 1
Using Network Monitor
NOTE:
Some modules require two physical slots on the node shelf but functionally
act as one board. The main board module is labeled egress and the
second board is labelled ingress. If you select the second board on the
shelf map to do diagnostics or list or clear alarms, you will see the
component address of the main board.
At this point, you will want to see exactly what the alarms are, so display the List
Alarms Window, as the following section describes.
Step 6: Display List Alarms Window
To access the List Alarms Window, use the following procedure:
Procedure 11-3.
Display List Alarms Window
1.
In the Network Map Window displaying the detailed map of the tx3 node,
click on the tx3 node symbol.
2.
In the Network Map Window, choose Commands, then choose List
Alarms.
A list of alarms now appears, which displays all the alarms on this node. The
status line at the bottom of the window displays the total number of outstanding
alarms in this list.
Screen 11-8.
List Alarms Window
StarKeeper II NMS Graphics System Guide, R10.0, Issue 1
11-13
Using Network Monitor
NOTE:
The default format of all list alarms windows can be changed for each
individual user by choosing in the Control Window Administer, then
choosing Set Alarm Preferences. The sorting order and number of lines
displayed per alarm can also be dynamically changed by choosing View in
the List Alarms Window. For more information on these commands, refer to
Chapter 12.
Step 7: Determine the Problem
From the alarm message text, you can determine that the host is probably down.
To validate this, call the administrator of the system HostC. You are then told that
the system has crashed and will be down for approximately an hour.
Step 8: Clear Alarms
Since the problem is in the process of being solved, you may wish to clear the
alarms in the Core System. Alarms can be cleared from the List Alarms Window,
the Network Map Window or the Control Window. For this example, clear alarms
from the Network Map Window displaying the detailed map of the tx3 node. To
clear the alarms, use the following procedure:
Procedure 11-4.
Clearing Alarms
1.
In the Network Map Window, click on the CPM connection that is yellow
between HOSTC and the tx3 node.
2.
In the same Network Map Window, choose Commands, then choose
Clear Alarms.
This action clears all the alarms for that CPM connection of the USA/TX/Austin/tx3
node. The clear command is sent to the Core System, westSK, which clears the
alarms from its database and then sends a clearing message to Network Monitor.
This process may take several seconds to complete.
When the clearing message has been received, the corresponding alarms are
removed from the alarm list. As a result, both the top map and the detailed map
for the tx3 node, in their respective Network Map Windows, display the network in
green. Because the network was not displaying any other alarms previously, the
Network Status Window also shows no alarms of any severity.
11-14
StarKeeper II NMS Graphics System Guide, R10.0, Issue 1
Using Network Monitor
Example II: A Trunk Problem
For the second example, a fiber trunk fails, but you do not yet realize it. Use the
following steps to discover the problem and correct it.
Step 1: Check Network Status Window
While watching your Graphics System, notice that the Network Status Window
has changed. Both the alarm severity notices and user notices reflect outstanding
alarms.
Screen 11-9.
Network Status Window with Major Trunk Alarms
Check Network Alarm Severity Notices
0
In the Network Status Window, the network alarm severity notices reflect that
major alarms have been received.
Check User Notices
0
In the Network Status Window, the user notice for trunk alarms indicates that trunk
alarms have been received.
StarKeeper II NMS Graphics System Guide, R10.0, Issue 1
11-15
Using Network Monitor
Step 2: Check Top Map
As in the previous example, check the top map to gain a visual perspective of the
network. Observe that both the aggregate location symbols for Texas and for
California are yellow, as well as the trunk line, TXCAtrk1, connecting them. You
can conclude that the trkt3i connecting Texas and California is having trouble.
Step 3: Display List Alarms Window
Since you already know you have trunk alarms, and you know which trunk has
problems, you may want to get a list of the alarms as quickly as possible.
Therefore, in the Network Status Window, choose the Trunks user notice which
displays the list of all the trunk alarms.
Screen 11-10.
Network Status Window, Choosing Trunks User Notice
From the list, observe that two major alarms are on the mimosa. Choose the first
alarm in the list. The alarm becomes highlighted.
Step 4: Display Textual Detail for an Alarm
To receive more detailed information about an alarm that is highlighted, in the List
Alarms Window, choose Commands, then choose Display Detail.
11-16
StarKeeper II NMS Graphics System Guide, R10.0, Issue 1
Using Network Monitor
As the following screen displays, a detailed view of this particular alarm is
provided. It includes the number of reoccurrences since it was last cleared and
since the last alarm clean-up that occurred on the Core System, dolphin:
Network Monitor: List Alarms: Display Detail
Address Information
Alarm Information
NMS Address: cicon
Message ID: 8456B
Node Address: blab/node41/smith
Severity: Major
Most Recent Occurrence: 06/30/98 12:08:59
First Occurrence Since Clear: 06/30/98 12:08:59
Module Address:58.1/0.1.16
System Type: BNS2000
Cabinet:
Occurrences Since Last Clear: 1
Shelf:
Occurrences Since Clean-up: 1
Module Type: frm—m2
Message
Message Text: REPORT FAILURE: syncp: Too many invalid attempts. Predefined
destination out of service, busy, or (if used) CIR not available
on PQ trunk STATION: 58.1.1.16 REASON=2 NODE=brophy
Recommended Action: Restore PDD, remove station from service, or check PQ trunk
OK
Cancel
Screen 11-11.
Help
List Alarms Window, Display Detail
Step 5: Display Alarm Help
If you are not sure how to proceed in determining the cause of the problem, you
may want to look up the alarm in the appropriate node's Messages Reference
Manual. You may also use the on-line alarm help feature. To display the on-line
help for an alarm, choose Alarm Help from the Help menu in the List Alarms
window. Then enter the alarm Message ID in the Alarm ID field.
StarKeeper II NMS Graphics System Guide, R10.0, Issue 1
11-17
Using Network Monitor
Screen 11-12.
List Alarms Window, Help
NOTE:
As a convenience, in the List Alarms Window, you may also choose Help,
then choose Selected Alarm Help to display help for the selected alarm.
From the alarm help text, you can see the explanation of the problem and also the
recommended actions. To send diagnostic commands to the node, first display the
Diagnostics Window, as the next section describes.
Step 6: Run Diagnostics
To display the Diagnostics Window for an alarm that is highlighted, in the List
Alarms Window, choose Commands, then choose Diagnostics.
From the Diagnostics Window, you can issue certain commands to the node that
is addressed in the selected alarm of the List Alarms Window These commands
are useful for problem isolation and resolution.
11-18
StarKeeper II NMS Graphics System Guide, R10.0, Issue 1
Using Network Monitor
NOTE:
Formatted command strings for BNS-2000 VCS R2.1 or later and BNS2000 commands are supported. Commands for other BNS-2000 VCS
releases can be initiated through the Diagnostics Window, but the syntax
may be incorrect. If incorrect, an output window with the node error
message and a re-prompt is displayed.
Screen 11-13.
Diagnostics Window
NOTE:
Once the Diagnostics Window has been invoked, you cannot change the
network address that the commands are issued on, except for the port field.
However, you may invoke more than one Diagnostics Window at a time if
you wish.
Using Dstat
0
As a suggestion, issue the Dstat command on the trunk module several times. To
do this, in the Diagnostics Window, choose Dstat from the Command menu. The
command appears in the bottom of the Diagnostics Window and is also sent to
the node. The output appears in a separate window. You may use the scroll-bar in
the window to view all the data.
StarKeeper II NMS Graphics System Guide, R10.0, Issue 1
11-19
Using Network Monitor
Screen 11-14.
Output Window for the Dstat Command
After a few seconds, re-issue the Dstat command. A second window appears with
the output of the second Dstat command. Compare the error counts recorded in
the SYNCHRO PROBLEM field of the two dstat output windows. If the value
increases every couple of seconds, then the problem is most likely loose or
crimped fiber connections to the I/O distribution board on the back of the node
cabinet. Call the administrator for the node and have the connections checked.
Once the administrator has checked and corrected the loose connections, choose
Dstat on the trunk module several more times. If the error counts no longer
increase, then the problem has probably been solved.
Using Diagnose
0
If you want to make sure the trunk is operating properly, in the Diagnostics
Window, choose Diagnose from the Commands menu.
The diagnose command is then sent to the node. Since the diagnose command
has many options, the node prompts you for further input. These prompts appear
in the window where the output occurs. Use the following procedure to diagnose
the trunk:
11-20
StarKeeper II NMS Graphics System Guide, R10.0, Issue 1
Using Network Monitor
Procedure 11-5.
Using Diagnose for a Trunk
1.
In the Diagnostics Window, choose Diagnose from the Commands menu.
2.
In the pop-up window, select the desired test and press
3.
Respond to other prompts as required.
Return
.
The trunk diagnostic command begins executing. The output appears below the
prompts you just answered.
If errors were not encountered in this loop-around test, then the trunk is operating
properly. The problem has been fixed and, therefore, the alarms can be cleared.
Step 7: Clear Alarms
Since the alarms are found on different nodes, clear the alarms from the List
Alarms Window.
1.
Choose all the alarms in the list by clicking on the first alarm in the list and
dragging down over the remainder of the alarms and then releasing.
Observe that all four alarms are highlighted, meaning they are all now
selected.
2.
In the List Alarms Window, choose Commands, then choose Clear
Alarms.
Four clear commands are sent to the Core System, westSK. When the clear
commands have been processed, the following takes place:
■
the alarms are removed from the list
■
the top map is updated to display the network in green
■
the Network Status Window once again shows no alarms in the network
Night Fold-Down
Transferring the network monitoring responsibility from one location to another,
depending on the time of day, is typically called night fold-down.
Since the Graphics System running Network Monitor can communicate with one
or more Core Systems, all that is necessary is to change the connections between
the Graphics System and the Core System via Workstation Administration,
accessible from the StarKeeper II NMS subpanel on the HP VUE Front Panel.
StarKeeper II NMS Graphics System Guide, R10.0, Issue 1
11-21
Using Network Monitor
Activate Connections
If you wish to receive alarms and have access to the nodes in an additional part of
the network, activate a connection to the Core System which monitors that section
of the network—refer to Administering Connections in Chapter 2 for more
details. Network Monitor begins to communicate with the additional Core System
as soon as you restart the Graphics System software or issue the Network
Monitor filter_sync command, refer to Procedure 10-34, Synchronizing
Alarms.
Deactivate Connections
To stop monitoring a section of the network, deactivate the Graphics System's
connections to the Core System which monitors that section of the network. To
deactivate connections, refer to Administering Connections in Chapter 2 for
more details. Then follow Procedure 10-34, Synchronizing Alarms to remove
outstanding alarms from the Network Monitor Graphics System that may have
been received from the section of the network that is no longer being monitored.
Network Maps and Night Fold-Down
Modifying the connections between your Graphics System and the Core System
that monitors the nodes in your network modifies:
■
access to alarms
■
configuration data
■
console connections of the nodes
However, if you wish to modify your network maps so that you only have maps that
correspond to the part of the network you are monitoring, you may do so by
modifying the Top Map parameter. Your hierarchy of maps stored on disk should
include all the maps of the entire network.
During the day, you may only want to use a subset of maps (for example, only
those maps in the Texas region). To do this, set the Top Map parameter to point to
a regional map (for example, texas.region). Only the Texas regional map and
those maps to which it points are loaded into memory when you choose View
Network Status from the Control Window.
NOTE:
Changing the Top Map parameter only affects the maps. It does not affect
the Network Status Window or the List Alarms Window.
11-22
StarKeeper II NMS Graphics System Guide, R10.0, Issue 1
Using Network Monitor
At night, you may want to monitor the entire network. To do this, change the Top
Map parameter to point to the map of your whole network (for example, USA). The
next time you choose View Network Status from the Control Window, all the
maps of the network are loaded into memory.
NOTE:
The symbols on all maps contain the Core System name as part of the
network address. If a change is made to a Core System that monitors a
node, the addresses in the current maps no longer match alarms received
from the node because of the new NMS address in the alarms. For this
reason, it is suggested that night fold-down be accomplished using the
method described above.
StarKeeper II NMS Graphics System Guide, R10.0, Issue 1
11-23
Using Network Monitor
11-24
StarKeeper II NMS Graphics System Guide, R10.0, Issue 1
122
Network Monitor User Reference 0
This chapter systematically describes each user interface component of the
Network Monitor application. Use this chapter in conjunction with the extensive
on-line help. The window architecture is presented before each window is
described.
Window Architecture
The following window architecture illustration represents Network Monitor
windows. Refer to this diagram as needed when reading subsequent sections on
each window and its associated sub-menus.
NETWORK MONITOR
CONTROL WINDOW
EDIT
MAPS
WINDOW
NETWORK
STATUS
WINDOW
NETWORK
MAP
WINDOW
LIST ALARMS
WINDOW
DIAGNOSTICS
WINDOW
Figure 12-1. Window Architecture
StarKeeper II NMS Graphics System Guide, R10.0, Issue 1
12-1
Network Monitor User Reference
Control Window
After choosing Network Monitor from the StarKeeper II NMS subpanel of the
HP VUE Front Panel, the Control Window appears first. It contains these three
menus:
■
Monitor
■
Administer
■
Help
Screen 12-1.
Network Monitor Control Window
Monitor Menu
The tasks found in the Monitor menu contain features to monitor the network
actively for faults. They are:
12-2
■
View Network Status
■
List Alarms
■
Clear Alarms
■
Trace Calls
■
Exit
StarKeeper II NMS Graphics System Guide, R10.0, Issue 1
Network Monitor User Reference
0
View Network Status
After choosing View Network Status, both the Network Map Window, displaying
the top map, and the Network Status Window appear. These windows are
described in separate sections of this chapter.
0
List Alarms
After choosing List Alarms, the following pop-up window appears asking you to
specify selection criteria that will be used to select the alarms to display in a List
Alarms window:
Screen 12-2.
Monitor Menu, List Alarms Selection Criteria
You must specify:
■
network address(es)
■
alarm severities
StarKeeper II NMS Graphics System Guide, R10.0, Issue 1
12-3
Network Monitor User Reference
0
Network Address
The first field allows you to specify a network address. If you wish, you may enter
only the beginning portion of an address (that is, only one character is required).
Any alarm from a piece of equipment that has the same beginning portion of the
network address will be included in the list of alarms.
For equipment monitored by a Core System that is logically connected to your
Graphics System, the Core System name portion of the network address may be
omitted. However, for equipment monitored by a remote StarKeeper NMS or by
other Element Management Systems, the Network Management System name
must be entered in square brackets. Examples of network addresses are:
Table 12-1. Network Address Examples
Network Address
USA/TX/Austin/tx3
USA/NY/Buffalo/ny2:50
USA/CA
[remSK41]OH/Toledo
[6820_SC]112/2/54
The default value, Any, means the network address is not used as a selection
criteria for limiting the alarms that appear in the list. If the network address field is
blank, then Any is used.
A list of nodes and Core Systems is displayed below the Network Address
specification field. From this list, you can choose one or multiple nodes. If you
choose only one node, its address appears in the Network Address field.
If you choose more than one node, the text <List_Selection> appears in the
Network Address field and the addresses are saved to be used as selection
criteria for the list of alarms.
After you have selected one node from the list, you may edit the address in the
Network Address field. For example, you may want to add a component to the
address to have that used as selection criteria to display only its particular alarms.
Multiple ranges of list items can be selected in this pop-up command window, in
Alarm Lists and in the lists that appear in other pop-up command windows: Clear
Alarms, Generate Shelf Maps: Selected Nodes, and Generate Shelf Maps:
Selected Concentrators/SAMs By Node.
12-4
StarKeeper II NMS Graphics System Guide, R10.0, Issue 1
Network Monitor User Reference
Use the following procedure to select multiple ranges in all of these Network
Monitor lists.
Procedure 12-1.
Selecting Multiple Ranges in Lists
1.
To select a range initially, click on the first item in the range desired and
drag the mouse to the last item in the range.
2.
To select an additional range, press and hold
dragging to identify the new range.
3.
To extend an existing range, press and hold
new end-of-range item.
CTRL
SHIFT
while clicking and
and then click on the
0
Alarm Severities
In the Alarm Severity field, you can choose the severities of the alarms that are to
be displayed. The default value is to include Critical and Major alarms. Depress
those buttons that indicate the desired severities.
After specifying values for both criteria, alarms that are displayed must have
matched both the address and the severities specified. Choose List Alarms to
display the list.
NOTE:
If network address(es) are specified, the window title in the List Alarms
Window reflects the address. If network address(es) are not specified, the
severities that are selected are reflected.
Clear Alarms
0
After choosing Clear Alarms, you will be asked to enter a Network Address.
Specify a network address by entering a node address and optionally, a
component address. As in List Alarms, the Network Management System name
portion of the network address may be omitted for nodes that are monitored
locally.
If you prefer, you may choose one or more node addresses from the pop-up list.
The node address or <List_Selection> is placed in the field of this pop-up
window. Choose OK to send one or more clear alarms commands to the
appropriate Core Systems.
StarKeeper II NMS Graphics System Guide, R10.0, Issue 1
12-5
Network Monitor User Reference
0
Trace Calls
You must have an up-to-date configuration database to trace calls. This database
is updated through Performance Reporter using the Administer Update
Configuration Data menu option. Be sure you have entered all trunks correctly
on each Core System. Network node names should not be duplicated, or trace
calls can fail. Only one call at a time is allowed to be traced.
If a Core System is running a release of StarKeeper II NMS prior to R9.0, a shell
script (trace.sh) must be added to the Core System in /usr2/SK/r<x>/bin/
skcmds/perf. <x> refers to the current release number. The tracec.sh script is on
the Graphics System in $NM_ROOT/bin. The trace calls feature is not enabled if
PR_ROOT is not set in the environment.
After choosing Trace Calls, you will be asked to enter Trace Call Parameters.
Trace Call Parameters are used to specify the originating endpoint of a call.
You must specify a node name and module address, as well as either a channel/
port number or port/DLCI.
■
For 3270 bisync modules, you must specify a cu, term, and port.
■
For calls that originate on a SAM, you must specify a board number and
port number.
The node name can be directly entered into a text field, or it may be selected from
a list of nodes known to this workstation. The nodes named on this list have a
console type connection entered in a Core System database and a workstation
connected to the Core System.
After specifying Trace Call Parameters, click on the Submit button to initiate the
call trace. (Press the Abort button to stop a call trace, or dismiss the window by
clicking the Cancel button.) The call trace output is displayed in a Trace Call
Results window and can be saved in a file or sent to a printer.
0
Exit
The Exit control is found in this menu. You will be prompted to confirm that you
want to exit Network Monitor. If you confirm the request, all Network Monitor
windows on your Graphics System will be terminated.
Administer Menu
The tasks found in the following menu contain features that are not used for
actively monitoring the network for faults. The tasks are:
12-6
■
Set Alarm Preferences
■
Define User Notices
StarKeeper II NMS Graphics System Guide, R10.0, Issue 1
Network Monitor User Reference
■
Administer Maps
Set Alarm Preferences
0
This task allows you to tailor the format of the alarm lists according to your
preferences. The preferences you specify are recorded for your individual login ID
only. After you specify your preferences, the settings take effect the next time you
invoke a List Alarms Window.
NOTE:
Some settings can be dynamically changed from within a List Alarms
Window. Refer to the View Menu section under List Alarms Window in
this chapter.
After choosing Set Alarm Preferences from the Administer Menu, this window is
displayed:
Screen 12-3.
Alarm Format
Administer Menu, Set Alarm List Preferences
0
You can display alarms in one- or two-line mode. Two-line mode includes the
alarm text field.
StarKeeper II NMS Graphics System Guide, R10.0, Issue 1
12-7
Network Monitor User Reference
0
Pane Height
You can increase or decrease the default size of the List Alarms Window by
specifying values for the pane height. Choices are 6, 12, and 18 lines of alarms.
The List Alarms Window can also be individually adjusted to increase or decrease
the lines of alarms they display.
0
Sound Bell For
Your terminal bell will be sounded when a new unique alarm of a specified severity
is received. Use this setting to specify the desired severities. You may choose any
combination, or none. Choosing none (the default) will disable the Alarm Bell
feature. To activate this feature, you must also choose Alarm Bell On in the Network
Status and List Alarms windows.
The alarm bell will sound 12 times for critical, six times for major, and three times
for minor alarms, by default. Edit the file $NM_ROOT/lib/alarm_bell to modify
these settings. Changes to this file will take effect the next time Network Monitor is
started. The maximum number of bells that will sound on a Netstation is 17; use
your Netstation's Preferences screen to set other bell parameters. Due to
hardware constraints, only a single bell will sound on an HP 720/730 System
Console.
0
Sort Alarms
The last fields allow you to specify values for sorting the alarm list. You can sort a
list by combinations of the following:
■
severity, then date-time
■
severity, then node address
■
date-time, then severity
■
date-time, then node address
■
node address, then severity
■
node address, then date-time
Sorting by severity displays the Critical alarms first, followed by Major and Minor
alarms.
Sorting by date-time displays the alarms in reverse chronological order, with the
most recent alarm displayed first.
Sorting by node address displays the alarms in alphanumeric order according to
the node address of the alarm.
12-8
StarKeeper II NMS Graphics System Guide, R10.0, Issue 1
Network Monitor User Reference
After making your changes, choose OK to record them. If you do not want to
save the changes, choose Cancel to dismiss the window. Choose Reset to
change each field's value back to the original value present when you invoked this
pop-up window.
Define User Notices
After choosing Define User Notices from the Administer Menu, the following
window is displayed:
Screen 12-4.
Administer Menu, Define User Notices Window
The user notices that you define appear in the Network Status Window. Up to six
user notices can be defined.
The NMS address, network address, module type and message ID fields allow
you to specify criteria which are used to match alarms. When an alarm is received
from the network and, if the alarm matches all the criteria specified in a user
StarKeeper II NMS Graphics System Guide, R10.0, Issue 1
12-9
Network Monitor User Reference
notice, then the notice box in the Network Status Window will change from white
to grey. A count of the matching alarms is also displayed in the box.
A field containing the default value, Any or a blank message ID field means that
this criteria is not used to limit the matching alarms. If three of the criteria use the
default value, Any, and the message ID fields are blank, then all alarms will be
matched. An example of using a default value is as follows: if a network address
and module type are specified, and message ID uses the default value, blank,
then only alarms containing the specified network address and having a
corresponding module type will match the notice.
New and changed user notices will take effect when the Network Map Window is
restarted.
0
Label
The label is a mandatory field which can contain a maximum of eight characters. It
is the name that, after being defined, appears in the Network Status Window.
0
NMS Address
For nodes monitored locally, entering the Network Management System name is
optional. However, for nodes monitored by a remote Network Management
System, you must enter the Network Management System name
0
Network Address
The same rules apply here as they do for List Alarms . Specifying the beginning
portion of a network address is allowable in this field. For example, by entering
USA/TX, all network addresses that begin with USA/TX will be matched. Refer to
the List Alarms section under Control Window, Monitor Menu that discusses
selection criteria in this chapter.
Using Wildcards in Network Addressing
Network Monitor has refined the use of wildcards, to be more applicable to typical
user scenarios, when specifying the network address for the following:
■
List Alarms Command Window
■
Clear Alarms Command Window
■
Define User Notice Command Window
See the section Wildcarding in Network Addressing on Chapter 10 of this
document for more information on wildcarding.
12-10
StarKeeper II NMS Graphics System Guide, R10.0, Issue 1
Network Monitor User Reference
0
Module Type
Use a module type setting to match alarms based on the type of module for which
the alarm was generated. The categories of module types available as a predefined selection criteria are:
■
Trunks
■
Computer Port Modules (CPM)
■
Frame Relay Modules (FRM and FRM-M2)
0
Message IDs
User notices can also match alarms based on the message identifier (message
IDs) of the alarm. Five fields are available for entering message IDs. In each field,
you may enter a complete message identifier, a range of message IDs separated
by a dash, or the beginning portion of a set of message IDs. In defining Message
IDs for user notices, remember Message IDs for BNS-2000 VCS alarms consist
entirely of digits, where message IDs for BNS-2000 alarms consist of digits plus a
"B" suffix. Ranges specified without a "B" suffix will not match BNS-2000 alarms;
ranges specified with a "B" suffix will not match BNS-2000 VCS alarms. Message
IDs that are not entered as ranges will match any alarm with the same initial
component. The table below will help to illustrate this relationship:
Table 12-2.
Message ID Examples
Enter This Message ID
To Specify These Message IDs
8120
8120, 8120B
8120B
8120B
8120-8124B
8120B to 8124B
8120B-8124B
8120B to 8124B
8120-8124
8120 to 8124
Administer Maps
After choosing Administer Maps from the Administer Menu, a pop-up menu
appears providing the following options:
Edit Maps
0
This first task invokes the Edit Maps Window (see the Edit Maps Window section
in this chapter).
StarKeeper II NMS Graphics System Guide, R10.0, Issue 1
12-11
Network Monitor User Reference
Generate Shelf Maps
0
This second task allows you to automatically generate shelf maps for nodes or
concentrators. These nodes or concentrators must be monitored by a Core
System that is locally attached to your Graphics System; nodes or concentrators
that are monitored by either a remote Core System or a Core System that is not
locally connected are not supported.
■
Choose All Nodes to generate shelf maps for all nodes in your network.
■
Choose Selected Nodes to display the following pop-up window:
Screen 12-5.
Generate Shelf Maps, Selected Nodes
Choose one or more nodes from the list, then choose
generation process.
OK
to begin the
■
Choose All Concentrators/SAMs to generate shelf maps for all the
concentrators or SAMs that are attached to the nodes in your network.
■
Choose Selected Concentrators/SAMs By Node to display a list of
nodes. Shelf maps are created for every concentrator or SAM that is
attached to the nodes you choose from the list. Choose OK to begin the
generation process.
Shelf maps are created as a background job, allowing you to continue working.
When the maps have been created, a message is sent to the HP VUE Bulletin
12-12
StarKeeper II NMS Graphics System Guide, R10.0, Issue 1
Network Monitor User Reference
Board. The shelf map files can be found in the $NM_ROOT/lib/USERMAPS/
SHELVES directory. It is recommended that these map files not be manually
edited.
Generating a shelf map replaces the previous contents of the shelf map files.
Therefore, shelf maps can be kept up-to-date, reflecting the most recent
configuration changes, by simply generating them once again. However, the new
shelf maps will not be available for viewing until the “View Network Status” task
has been reinvoked.
0
Set Top Map
This third and last task in Administering Maps is used to specify the name of the
top map for your map hierarchy. After choosing Set Top Map, select the file name
from the scrolling list. The file name can contain a maximum of 20 characters.
Network Monitor: Set Top Map
Top Map
ici-gypsy
File Name
Map Name
Complete Map
Complete Map
Complete
Complete Map
ici-gypsy
LEC A
trunk-atm
trunk–atm
OK
Cancel
Screen 12-6.
Help
Administer Map, Set Top Map
StarKeeper II NMS Graphics System Guide, R10.0, Issue 1
12-13
Network Monitor User Reference
Edit Maps Window
From the Control Window, choose Administer, Administer Maps then Edit
Maps to display the following window. You will have to wait a short time for the
window to become fully active.
Screen 12-7.
Edit Maps Window
The tasks available in the Edit Maps Window are:
■
File
■
Edit
■
Options
■
Help
NOTE:
New and changed maps will take effect only after the View Network Status
Window has been restarted.
12-14
StarKeeper II NMS Graphics System Guide, R10.0, Issue 1
Network Monitor User Reference
File
After choosing File, a pop-up window is displayed:
0
Save
Choosing Save asks you to specify a file name for the current map that you are
editing. In the following pop-up window, enter a file name, up to 20 characters:
Screen 12-8.
Edit Maps Window, Save
OK
Choose
and the map is written to the file. If the file already exists, a
confirmation window will appear.
You may continue editing this map. Changes to maps are not in effect until the
View Network Status Window has been restarted.
StarKeeper II NMS Graphics System Guide, R10.0, Issue 1
12-15
Network Monitor User Reference
0
Load
Choosing Load produces a list of map files to choose from. Choose the map you
wish to edit and then choose OK . The map is then displayed in the Edit Maps
window pane.
Screen 12-9.
New
List of Maps
0
Choosing New clears the Edit Maps Window. Maps created using the Edit Maps
Window are stored in the $NM_ROOT/lib/USERMAPS/NETWORK directory.
Delete
0
You can delete maps that are no longer needed. Choosing Delete produces a
window that contains a scrolling list of map files from which you can delete.
Choose the map you wish to delete and then choose OK .
12-16
StarKeeper II NMS Graphics System Guide, R10.0, Issue 1
Network Monitor User Reference
After choosing OK from the scrolling list, the map editor will display a message
allowing you to confirm the requested deletion or alerting you to a real or potential
problem regarding your deletion request. Among these messages are those which
indicate when the map you want to delete is referenced in other maps or
references other maps. If a map is referenced in other maps, you must edit those
other maps to remove the references before you will be permitted to delete the
map of interest. If a map references other maps you are permitted to proceed with
the deletion, but if the referenced maps are not referenced in any other maps they
will no longer be accessible after the map of interest is deleted. In both of these
cases the notice containing the list of affected maps may be preserved for your
use while you edit the affected maps. Note that you must choose one of the
command buttons at the base of the notice window ( OK or Cancel ) before you
can make another deletion request.
The following is a list of all the messages you may receive. They will appear in a
pop-up notice window.
■
Are you sure you want to delete map "some_node".
This message is displayed when the selected map is not referenced in
other network maps and does not reference any other maps.
■
Delete Error: Cannot delete map file "file_name".
Cannot find map file.
This message will only be displayed when another user had deleted the
selected map after your scrolling list has popped up and before you chose
the selected map and pushed the OK button.
■
Delete Error: Cannot delete map "file_name".
Map has incorrect permissions.
This message is displayed when the selected map has read-only
permissions for this user.
■
Map "some_node" is referenced in the following maps:
some_region
To remove the references, you must edit the maps that
"some_region" is referenced in before you can delete map
"some_node".
This message is displayed when the selected map is referenced in other
network maps such as a higher level regional map.
■
Map "some_region" references the following maps:
some_node
some_node2
Are you sure you want to delete map "some_region"?
StarKeeper II NMS Graphics System Guide, R10.0, Issue 1
12-17
Network Monitor User Reference
This message is displayed when you are deleting a map that references
other maps. It is a warning that you may not be able to access these maps
if you delete this map unless they are referenced on another map in the
network.
■
Map "some_region" is referenced in the following maps:
some_area
Map "some_region" references the following maps:
some_node
some_node2
You must edit these maps to remove the references
before you can delete map "some_region".
This message is a combination of the last two messages mentioned above.
Exit
Choosing Exit causes a message pop-up window to appear advising the operator
that any changes made to a map during a map editing session will not be
displayed until the “View Network Status” task has been reinvoked. This window
asks the question “Do you want to quit the Edit Maps task?” Press OK to exit
the Edit Maps task.
Edit
After selecting a map object, choose Edit to display the following menu:
Screen 12-10.
12-18
Edit Maps Window, Edit
StarKeeper II NMS Graphics System Guide, R10.0, Issue 1
Network Monitor User Reference
Move Object
0
After choosing Move Object, the cursor changes to a cross-hair shape and you
must position it at the new location for the object. Click on the location to which
you want to move the object. To move lines, you must click on the location for both
ends of the line. When moving objects, the labels and lines associated with an
object move with it.
Delete Object
0
After choosing Delete Object, the currently selected map symbol is removed from
the map. Any labels or lines associated with the object are also deleted.
An Undo button does not exist, but remember that changes are not stored in the
map file until you choose File and then choose Save.
Resize Object
0
After choosing Resize Object, a pop-up window will offer a list of sizes for the
selected map object. Select the desired size, then choose OK to change the
size. All objects are drawn at their largest size by default.
This function applies only to certain objects. Refer to the Editor Legend (Screen
10-5) to see which objects may be resized.
Labels
0
Most map objects can be assigned as many as three labels. Labels are used to
help identify an object. Some labels are placed automatically by the map editor
when you add objects from equipment lists. Only background text and labels
themselves cannot have labels assigned to them. When you select a map object
that allows labels and the object has not already exceeded three labels, Labels
becomes active. Choosing Labels displays a pop-up window:
StarKeeper II NMS Graphics System Guide, R10.0, Issue 1
12-19
Network Monitor User Reference
If the currently selected map object allows for labels and does not already have
three labels assigned to it, then you can choose Add and the following pop-up
window will be displayed.
Screen 12-11.
Add Labels Window
Type the desired label in the pop-up window and choose OK . The outline of a
box appears around the cross-hair shaped mouse pointer. Point to the location on
the map where you want to place the label and click . Click the third mouse button
to cancel the operation.
12-20
StarKeeper II NMS Graphics System Guide, R10.0, Issue 1
Network Monitor User Reference
To change an existing label, first select the label on the map, then choose Edit,
Labels, and then Edit to display the following pop-up window:
Screen 12-12.
Edit Labels Window
Change the label as desired, then choose OK in the pop-up window to change
the label on the map. Labels are centered on the point where they were originally
located.
Background
0
Choosing Background allows you to specify a background for the map you are
editing. Supplied backgrounds include outlines for the world, the United States,
individual states, or no background. From the following list in the pop-up window,
choose the one you need and choose OK to place the background in the map:
StarKeeper II NMS Graphics System Guide, R10.0, Issue 1
12-21
Network Monitor User Reference
Screen 12-13.
Edit Maps Window, Set Background
Choosing a new background removes the current background on the map. To
delete a background from the map, choose !NO_BACKGRND from the list.
NOTE:
If you need a different background but want to keep the equipment that
appears in the window, you can change the background and leave the
equipment intact.
0
Equipment
Choose Equipment to display a menu.
12-22
StarKeeper II NMS Graphics System Guide, R10.0, Issue 1
Network Monitor User Reference
0
Add Nodes/System
Choosing Add Nodes/Systems displays a list of nodes and routers and servers
that are monitored by a Core System to which your Graphics System is logically
connected. It also lists a Core Systems to which your Graphics System is logically
connected. Choose a name from the list, then choose OK .
Screen 12-14.
Picking Equipment from a List
The mouse pointer changes to a cross-hair shape and jumps to the map. Point to
the area where you want the equipment symbol to appear, then click. The
appropriate symbol appears at that spot, with the correct network address and
label already associated with the symbol.
0
Add Concentrators/SAMs
Choosing Add Concentrators/SAMs displays a list of concentrators and SAMs
that are known by a Core System to which your Graphics System is logically
connected. Choose a concentrator or SAM from the list, then choose OK .
StarKeeper II NMS Graphics System Guide, R10.0, Issue 1
12-23
Network Monitor User Reference
Screen 12-15.
List of Concentrators/SAMs
Click on the map to place the concentrator or SAM symbol.
0
Add Trunks
Choosing Add Trunks displays a list of trunks that are known by a Core System
to which your Graphics System is logically connected. Use the scroll-bar to find
the trunk of interest. Choose the trunk from the list, then choose OK .
12-24
StarKeeper II NMS Graphics System Guide, R10.0, Issue 1
Network Monitor User Reference
Screen 12-16.
Picking Trunks from a List
The mouse cursor changes to a cross-hair shape and jumps to the map. Point and
click to specify the two endpoints of the trunk — at least one endpoint should be
on a node symbol.
Choose Multi Lines to display the trunk name and both endpoint addresses.
Select a criteria to sort the trunks alphabetically by either name, endpoint 1 or
endpoint 2.
0
Pick From Legend
Choosing Pick from Legend invokes the editor legend.
Choose a symbol from the legend and place it on the map. Some symbols at the
bottom of the legend have no specific meaning and are available for any purpose
you wish. Symbols placed from the legend do not automatically have a network
address associated with them.
StarKeeper II NMS Graphics System Guide, R10.0, Issue 1
12-25
Network Monitor User Reference
Therefore, it is recommended that objects be chosen via the List Node, List
Concentrator/SAM, and List Trunks commands whenever possible.
Table 12-3.
Editor Legend Symbol Explanation
Symbol
Explanation
Aggregate Loc.
A pointer to a lower level map
StarKeeper NMS
StarKeeper or StarKeeper II NMS
Node
BNS-2000 VCS, BNS-2000
Concentrator
MPC7, MPC15
SAM
SAM8, SAM64, SAM504
Element Mgmt. Sys
Paradyne, COMSPHERE 6800, etc.
Trunk Aggregate
Represents multiple trunks
Trunk
A trunk between nodes
Concentrator/SAM Link
A link to a concentrator or SAM
NAC
Network Access Controller
NIK, LCS50
LCS50 Datakit II VCS Network Interface
LCS100
LCS100 Datakit II VCS Network Gateway
LAM
AppleTalk LAN Manager
Host
A generic symbol for hosts
Front End Proc.
A generic symbol for FEPs
Cluster Controller
A generic symbol for CCs
Workstation
A generic symbol for Workstations
Terminal
A generic symbol for terminals
Printer
A generic symbol for printers
Modem
A generic symbol for modems
Router/Server
A generic Router or Server
unlabeled symbols
Can be used for any purpose
Background Text
0
Choosing Background Text allows you to add text to a map that is independent
of any object on the map. This text, as opposed to object labels, are used to
identify areas of the map background or perhaps, company names. Choosing
Background Text displays a menu.
12-26
StarKeeper II NMS Graphics System Guide, R10.0, Issue 1
Network Monitor User Reference
0
Add Background Text
Choose Add to add new text to the map. This operation is similar to adding a
label, except that you do not need to select a map object first.
Screen 12-17.
Background Text, Add Background Text
0
Edit Background Text
You can edit existing background text on a map by first selecting the text and
choosing Edit, Background Text and then Edit. This operation is also similar to
that of editing a label.
Screen 12-18.
Background Text, Edit Background Text
Options
After selecting a map object, choose Options to display a menu. Not all menu
items apply to all objects; items that do not apply will be inactive.
StarKeeper II NMS Graphics System Guide, R10.0, Issue 1
12-27
Network Monitor User Reference
0
Scratch Pad Text
Before you choose Scratch Pad Text, you must have previously selected a
network component from a map. You can set Scratch Pad Text only for locally
monitored objects (for example, trunks, nodes, and concentrators). Scratch Pad
information is defined by you and is used for storing additional comments about a
network component as the following pop-up window displays:
Screen 12-19.
Properties, Scratch Pad Text
The Scratch Pad text you specify here is displayed when you choose Display Info
in the Network Map Window. For more details on how to use Display info, see
Display Info under Commands Menu in the Network Map Window section in
this chapter.
Set Network Address
0
Before you choose Set Network Address, you must have previously selected a
network component from a map. In the following pop-up window, specify the fully
qualified network address for the component (for example, [westSK]USA/TX/
Austin/tx3:19):
12-28
StarKeeper II NMS Graphics System Guide, R10.0, Issue 1
Network Monitor User Reference
Screen 12-20.
Choose
OK
Properties, Set Network Address
in the window to make the change.
NOTE:
Any map object with a network address appears green in the editor.
0
Set Map Pointer
Before you choose Set Map Pointer, you must have previously selected a
network component with a network address or an aggregate location symbol from
the map. In the following pop-up window, specify the file name of the map to which
the selected map object will point:
Screen 12-21.
Properties, Set Map Pointer
StarKeeper II NMS Graphics System Guide, R10.0, Issue 1
12-29
Network Monitor User Reference
Choose OK in the pop-up window and an empty map with the appropriate file
name is instantly created. Otherwise, the map hierarchy cannot load when you
choose View Network Status when a symbol points to a map that does not exist.
NOTE:
When map pointers have been set for aggregate location symbols, they
appear green in the Map Editor.
0
Set Title
Choosing Set Title allows you to specify a title for the map. The title will appear in
the Edit Maps Window title bar. The title can be longer than the field appears, in
which case, scrolling buttons appear in the field. After specifying a name, choose
OK in the following pop-up window to reflect the name:
Screen 12-22.
Edit Maps Window, Set Title
View Network Status Window
Both the Network Status Window and Network Map Window are displayed when
View Network Status is selected from the Network Monitor Control Window. This
window displays outstanding alarms that reflect the current state of the network
via:
12-30
■
alarm severity notices
■
user notices
StarKeeper II NMS Graphics System Guide, R10.0, Issue 1
Network Monitor User Reference
If you choose either of these from the View Network Status Window, you will
invoke the List Alarms Window. The label name of the user notice will be the title
of the List Alarms Window.
Screen 12-23.
Network Status Window
NOTE:
Only one Network Status Window can be displayed at any time. Exiting a
Network Status Window closes the window and additionally any Network
Map Windows that are being displayed. Other windows (for example,
Diagnostics Window, List Alarms Window) that were invoked from either the
Network Status Window or Network Map Window are also closed.
File
Choosing the File menu displays an Exit option. Choose Exit to close the
Network Status Window.
View
Choosing the View menu displays the Display Top Map option.
StarKeeper II NMS Graphics System Guide, R10.0, Issue 1
12-31
Network Monitor User Reference
0
Display Top Map
Choose Display Top Map to invoke a new Network Map Window containing the
Top Map.
Options
Choosing the Options menu displays the Turn Alarm Bell On/Off option.
0
Turn Alarm Bell On/Off
Choose Turn Alarm Bell On to enable the Alarm Bell for alarm severities selected
in the Set Alarm Preferences window. Choose Turn Alarm Bell Off to temporarily
disable the Alarm Bell. This button is inactive if no severities were selected in the
Sound Bell For preference. See the section Set Alarm Preferences under the
Administer Menu.
Alarm Severity Notices
Alarm severity notices display the number of unique outstanding alarms according
to severity (for example, critical, major, or minor). When your Graphics System
receives alarms, the notice changes color to reflect the following severities of
alarms:
Table 12-4. Alarm Colors
Color
Severity
red
critical alarm
yellow
major alarm
blue
minor alarm
User Notices
User notices are defined by you, and unlike the alarm severity notices, do not
change color to reflect alarm severity. Instead, they turn grey when matching
alarms exist. The labels for a user notice can contain up to eight characters. If a
notice has not been defined, it will not appear in the Network Status Window. For
instructions on defining user notices, see Define User Notice section under
Administer Menu in this chapter.
12-32
StarKeeper II NMS Graphics System Guide, R10.0, Issue 1
Network Monitor User Reference
Network Map Window
Both the Network Map Window and Network Status Window are displayed when
View Network Status is chosen from the Control Window.
NOTE:
It is possible to have more than one Network Map Window displayed.
Exiting a Network Map Window dismisses that window only, and does not
affect additional Network Map Windows.
Screen 12-24.
Network Map Window
Map objects with network addresses are color-coded to reflect the highest
severity alarm received from that address. Refer to the Trickle-Up section under
Map Hierarchy Principles of Chapter 10 in this guide for more information.
StarKeeper II NMS Graphics System Guide, R10.0, Issue 1
12-33
Network Monitor User Reference
NOTE:
If communication between your Graphics System and the connected Core
System is broken, the appropriate StarKeeper II NMS symbol on a map will
turn red. All the nodes and systems monitored by this Core System remain
in their current state since new alarms cannot be received and current
alarms cannot be cleared for these nodes and systems.
File
Choosing the File menu displays an Exit option. Choose Exit to dismiss the
Network Maps Window.
Commands Menu
After selecting an object on the map, choose Commands to display a menu.
0
Display Info
Before you choose Display Info, you must have previously selected a network
component from a map. You can choose Display Info only for locally monitored
nodes, routers and servers, trunks, concentrators, and concentrator links.
NOTE:
This information is retrieved from the Core System database.
12-34
StarKeeper II NMS Graphics System Guide, R10.0, Issue 1
Network Monitor User Reference
After choosing Display Info from the Commands Menu, both Configuration Data
and Scratch Pad comments are displayed in the following pop-up window.
Screen 12-25.
Network Map Window, Display Info
This information varies and is dependent on the type of object you select from the
map. Scratch Pad information is defined by you and is used for storing additional
comments about a network component. For more details on how to enter Scratch
Pad information, see the Scratch Pad Text section under Options in the Edit
Maps Window section of this chapter. For more information on the Configuration
Data that is displayed, see the StarKeeper II NMS Core System Guide.
List Alarms
0
Before you choose List Alarms, you must have previously selected a network
component from a map. After choosing List Alarms from the Commands Menu,
the List Alarms Window is displayed and the network address of the object you
selected or "Multiple Addresses" is reflected in the title bar. For more information,
refer to the List Alarms Window section in this chapter.
Clear Alarms
0
Before you choose Clear Alarms, you must have previously selected a network
component from a map. After choosing Clear Alarms, a clear alarms command is
sent to the appropriate Core System and all alarms on the selected map object
StarKeeper II NMS Graphics System Guide, R10.0, Issue 1
12-35
Network Monitor User Reference
are cleared. If the selected map object is monitored by a remote Network
Management System, you will be asked to confirm a force clear operation. A
forced clear only clears the alarm in the Core System database. Therefore, the
Core System alarm database may become inconsistent with the remote system
database.
Diagnostics
0
Before you choose Diagnostics, you must have previously selected a valid node
or concentrator or module in a shelf map that is locally monitored by a Core
System. If you choose a trunk, the number of Diagnostics Windows that appear
depends on the configuration of the endpoints. A Diagnostics Window appears for
each endpoint that is locally monitored by a Core System. For endpoints that are
monitored by a remote Network Management System, a Diagnostics Window is
not invoked.
For more information, refer to the Diagnostics Window section in this chapter.
View Menu
The following options are found under the View menu.
Legend
0
Choosing Legend displays the map legend. This identifies the meaning of the
various map symbols. Alarm severity color-coding is also described.
Top Map
0
Choose Top Map to quickly display the top map in your hierarchy, provided the top
map is not already displayed. The map can be displayed in the same (current)
window that will override the current contents, or in a new window.
Up
0
Choose Up to display the next map above the one you are currently displaying in
the map hierarchy, if one exists. The map can be displayed in the same (current)
window that will override the current contents, or in a new window.
Down
0
After selecting a map symbol, choose Down to display the map to which the map
symbol points, if one exists. The map can be displayed in the same (current)
window that will override the current contents, or in a new window.
12-36
StarKeeper II NMS Graphics System Guide, R10.0, Issue 1
Network Monitor User Reference
Options Menu
The following options are found under the Options menu.
0
Labels Off
This operates in a toggle fashion. When labels are currently displayed on a map,
choosing Labels Off makes them disappear. Conversely, when labels are not
displayed, choosing Labels On displays them.
List Alarms Window
The List Alarms Window displays the text of all outstanding alarms that match the
selection criteria and it contains these four menus:
■
File
■
Commands
■
View
■
Help
Screen 12-26.
List Alarms Window
NOTE:
It is possible to have more than one List Alarms Window displayed. Exiting
a List Alarms Window closes that window only, and does not affect
additional List Alarms Windows. Other windows (for example, Diagnostics
Window, Network Status Window) that were invoked from the List Alarms
Window are also closed.
StarKeeper II NMS Graphics System Guide, R10.0, Issue 1
12-37
Network Monitor User Reference
File Menu
After choosing File, a menu is displayed.
0
Save As
Choosing Save As displays the following pop-up window and allows you to save
the entire alarm list:
Screen 12-27.
File, Save
Enter a file name, up to 14 characters long, and choose
saved in the NM subdirectory in your home directory.
OK
. The file will be
0
Print
This task is only available if a printer has been configured to your Graphics
System. See the StarKeeper II NMS Core System Guide for information on
configuring the printer. When you choose Print, the entire alarm list is formatted
and sent to the default printer.
0
Exit
Choose Exit to close the List Alarms window.
12-38
StarKeeper II NMS Graphics System Guide, R10.0, Issue 1
Network Monitor User Reference
Commands Menu
You can choose Commands only when one or more alarms have been selected
from the list. After choosing Commands, a menu is displayed.
NOTE:
If more than one alarm has been selected, only Clear Alarms is active. All
other commands apply to a single alarm only.
0
Display Detail
After selecting one alarm from the alarm list, choosing Display Detail invokes the
following pop-up window that describes the alarm in greater detail:
Network Monitor: List Alarms: Display Detail
Address Information
Alarm Information
NMS Address: cicon
Message ID: 8456B
Node Address: blab/node41/smith
Severity: Major
Most Recent Occurrence: 06/30/97 12:08:59
First Occurrence Since Clear: 06/30/97 12:08:59
Module Address:58.1/0.1.16
System Type: BNS2000
Occurrences Since Last Clear: 1
Cabinet:
Occurrences Since Clean-up: 1
Shelf:
Module Type: frm—m2
Message
Message Text: REPORT FAILURE: syncp: Too many invalid attempts. Predefined
destination out of service, busy, or (if used) CIR not available
on PQ trunk STATION: 58.1.1.16 REASON=2 NODE=brophy
Recommended Action: Restore PDD, remove station from service, or check PQ trunk
OK
Cancel
Screen 12-28.
Find Map
Help
Commands, Display Detail
0
After selecting one alarm from the alarm list, choosing Find Map invokes the
Network Map Window that displays the map containing the equipment associated
with the selected alarm. The Network Map Window must be running when Find
Map is invoked.
StarKeeper II NMS Graphics System Guide, R10.0, Issue 1
12-39
Network Monitor User Reference
0
Clear Alarms
After selecting one or more alarms from the alarm list, choosing Clear Alarms
sends a clear message for each alarm to the appropriate Core System. A
message notifies you of the number of clear requests that have been sent to the
Core System. This task does not remove the alarms from the list; they are
removed only when a clear message is received by the Core System.
NOTE:
Core System Link Down alarms cannot be cleared by you. The Core
System automatically clears these alarms when it re-establishes its
connection to the node on which the alarm was generated.
For alarms from a remote Network Management System, a notice window
appears, asking you to confirm or cancel the clear. The notice appears because
the databases of the local Core System and remote Core System could get out of
synchronization. If you confirm by choosing OK , then the forced clear occurs.
If you choose Cancel , then the entire clear operation is canceled. If for any
reason an alarm cannot be cleared, then a message notifies you that it cannot be
cleared manually. Choose Dismiss to remove the notice. For more information
on clearing alarms, refer to the StarKeeper II NMS Core System Guide.
Diagnostics
0
After selecting an alarm that has been generated by a node, choosing
Diagnostics invokes the Diagnostics Window. For more information, see the
Diagnostics Window section in this chapter.
View Menu
After choosing View, a menu is displayed which allows you to temporarily change
the presentation of data in the List Alarms Window.
Display Alarms Lines
0
If you choose View, then Display Alarm Lines you will be able to choose either
One Line Alarm Display or Multi-line Alarm Display.
Sort Alarms By
0
Choosing View, then Sort Alarms By displays a sub-menu allowing you to
dynamically change the sorting criteria.
12-40
StarKeeper II NMS Graphics System Guide, R10.0, Issue 1
Network Monitor User Reference
Choose from one of the combinations of sorting criteria displayed in the above
screen. The Alarm Display will dynamically change based upon your input.
Help Menu
Choose Help to display a menu.
In addition to the standard Help System described in Chapter 3, Alarm Help is
also accessed via this menu.
0
Alarm Help
After choosing Alarm Help, a pop-up window appears asking you to enter an
alarm ID. Help for that alarm is displayed as described in Selected Alarm Help
following this screen.
Screen 12-29.
Help, Any Alarm
StarKeeper II NMS Graphics System Guide, R10.0, Issue 1
12-41
Network Monitor User Reference
Selected Alarm Help
After selecting one alarm from the alarm list, choosing Selected Alarm Help
displays help information in the following pop-up window on the selected alarm:
Screen 12-30.
List Alarms, Commands, Help
NOTE:
A delay may occur while the help text is being retrieved from the Core
System.
Alarm List is Frozen/Unfrozen
This task operates in a toggle fashion. Choosing Frozen suppresses displaying
new, repeated, and cleared alarms for a short period of time to allow you to read
or interact with the alarms on the current list. A message on the bottom of the List
Alarms Window informs you that the list is frozen. The list's content will not
change until you unfreeze the list by choosing Unfrozen or the freeze timer
expires (after one minute). If the timer expires, a message appears, saying that
the alarm list is now unfrozen.
12-42
StarKeeper II NMS Graphics System Guide, R10.0, Issue 1
Network Monitor User Reference
Alarm Bell is On/Off
This task operates in a toggle fashion. Choose On to enable the Alarm Bell for
alarm severities selected in the Set Alarm Preferences window. Choose Off to
temporarily disable the Alarm Bell. This button is inactive if no severities were
selected in the Sound Bell For preference. See the section Set Alarm
Preferences under the Administer menu.
Diagnostics Window
File Menu
Choose Exit to dismiss the Diagnostics Window.
Commands Menu
Choosing Commands displays diagnostic commands that are available for use on
alarms generated by nodes. The following commands are available:
■
verify
■
remove
■
restore
■
display connections
■
dstat
■
dmeas
■
diagnose
■
display EIA
■
display traffic
■
nping
■
route
■
smeas
■
tmeas
Choose any of these commands to send the command to the node for execution.
The formatted command string is then displayed in the footer of the Diagnostics
Window. The output appears in another window.
StarKeeper II NMS Graphics System Guide, R10.0, Issue 1
12-43
Network Monitor User Reference
Each of the commands can be run directly from the node console, except for
nping. The nping command is a special command available only from
StarKeeper II NMS. It utilizes the diagnose facility on the node to measure
network round trip delay on any Frame Relay PVC in the network. More
information on the nping command can be obtained by running the command
help nping on a Core System.
NOTE:
Formatted command strings for BNS-2000 VCS R2.1 and later and BNS2000 commands are supported. Commands for other BNS-2000 VCS
releases can be initiated through the Diagnostics Window, but the syntax
may be incorrect. If incorrect, an output window, with the node error
message and a re-prompt, will be displayed.
Screen 12-31.
Diagnostics Window
The Diagnostics Window refers to a particular piece of equipment based on the
network address of the map symbol or alarm you selected.
Configuration information about the piece of equipment to be diagnosed must
reside in the Core System database. To accomplish this, use the StarKeeper II
NMS commands, skload and cfg_sync. For more information on these
commands, see the Core System On-line help facility. If the Diagnostics Window
is invoked from a trunk map symbol, (which has two addresses associated with it),
two separate Diagnostics Windows will appear, one for each end of the trunk.
12-44
StarKeeper II NMS Graphics System Guide, R10.0, Issue 1
Network Monitor User Reference
Diagnostic Window Field Descriptions
The fields in the Diagnostics Window obtain their values from the map symbol you
selected, or from the alarm you selected in a list of alarms. The fields are:
■
object type
■
node address
■
component address
■
port
■
channel
0
Object Type
This field displays the type of object to which this window is displaying (for
example, SAM64, trunk-hs, ty12). Diagnostics are supported for the following
objects:
■
node
■
concentrator
■
SAM
■
trunk
■
concentrator/SAM link
■
modules
Node Address
0
This field displays the node address to which commands will be sent.
Component Address
0
This field displays which component will be addressed in the commands sent to
the node.
Port
0
If a value is present in the port field, it is used by the commands that support
specifying a port value. It is ignored for commands that do not support specifying
a port.
For modules that have more than one value in the port field, you can edit this field
to add, change, or delete its contents.
StarKeeper II NMS Graphics System Guide, R10.0, Issue 1
12-45
Network Monitor User Reference
Channel
0
This field displays the number of the channel on which the diagnostics commands
will be issued. The channel field is optional and may be edited. Some of the
supported diagnostic commands do not use this field. In those cases, the channel
field will be ignored.
12-46
StarKeeper II NMS Graphics System Guide, R10.0, Issue 1
Administering Performance
Reporter
0
13
This chapter explains the administrative tasks that you must perform before you
begin using Performance Reporter to run reports.
Adding Users
See Chapter 2 for information on adding users.
Removing Users
See Chapter 2 for information on removing users.
Administering Performance Data on
the Core System
For information about administering Performance Data on the Core System, refer
to Chapter 3, Performance Measurements Management of the StarKeeper II NMS
Core System Guide.
Administering the Threshold Feature
The Threshold Feature is included as part of Performance Reporter. You have the
option of turning it on or off as desired. Turning on the feature causes the automatic generation of Exception Reports. Turning off the feature halts the calculation
and storage of Exception Reports.
NOTE:
The threshold feature is set globally on a per Graphics System basis. If a
user sets it on or off it is set that way for all users on that Graphics System.
StarKeeper II NMS Graphics System Guide, R10.0, Issue 1
13-1
Administering Performance Reporter
The same holds true for threshold values and whether fields are to be
included or excluded in Exception Reports.
Activating the Thresholding Feature
When you install or reinstall the Performance Reporter, the Threshold Feature is
not active. The following procedure activates the Thresholding Feature.
Screen 13-1.
Procedure 13-1.
Performance Reporter Control Window
Activating the Thresholding Feature
1. At the Performance Reporter Control Window, (Screen 13-1), select
Administer, Threshold, and then Threshold Status from the sub-menus.
13-2
StarKeeper II NMS Graphics System Guide, R10.0, Issue 1
Administering Performance Reporter
The following pop-up window Set Threshold Status is displayed.
Screen 13-2.
Set Threshold Status Window
2. Position the pointer on
Enable
3. Position the pointer on
OK
and click.
and click.
The following message will be displayed in the footer of the window.
Thresholding has been turned ON
4. To dismiss the window, click on the
Cancel
button.
The first Daily Exception Reports will be generated at the beginning of the next
day and filed.
NOTE:
Once the Thresholding Feature is active, you have the ability to change the
threshold values and select which threshold fields you wish to have
included in the Exception Reports. See Procedures 13-3 and 13-4.
Deactivating the Thresholding Feature
You may wish to deactivate the feature. For example, if you find you do not use the
Exception Reports at all, it is not useful to have the feature running. The following
procedure will deactivate the Thresholding Feature.
StarKeeper II NMS Graphics System Guide, R10.0, Issue 1
13-3
Administering Performance Reporter
Procedure 13-2.
Deactivating the Thresholding Feature
1. At the Performance Reporter Control Window, (Screen 13-1), select
Administer, Threshold, and then Threshold Status from the sub-menus.
The following pop-up window Set Threshold Status is displayed.
Screen 13-3.
Set Threshold Status Window
2. Position the pointer on
3. Position the pointer on
Disable
OK
and click.
and click.
The following message will be displayed in the footer of the window.
Thresholding has been turned OFF
4. To dismiss the window, click on the
Cancel
button.
Exception Reports that were previously generated and filed will still be available
by way of the List option on the Performance Reporter Control Window. You may
view them even though the Thresholding Feature has been deactivated. Reports
will remain on the list until they are removed by the cleanup process.
No Exception Report will be generated for the day in which the feature was deactivated. If it also happens to be the end of a week or month, then the Weekly or
Monthly Exception Report will not be generated either. All Exception Reports are
automatically generated according to a fixed or non-administrable schedule.
13-4
StarKeeper II NMS Graphics System Guide, R10.0, Issue 1
Administering Performance Reporter
Setting Threshold Values
The Threshold Feature comes with default values for the threshold fields. These
are the recommended values, based on average customer configurations and
uses. When the Threshold Feature is activated, the default values apply and all
the threshold values are included in the report.
However, you have the ability to change the values and select the fields to be
included in the report. There is a User Value field for each threshold field, which
matches the initial default setting. You can change the User Value field to reflect a
new value that you want. You can also exclude a threshold field from Exception
Reports. Any value change will be reflected in the Exception Reports.
A suggestion is to use the default values at first and review the Exception Reports.
If you find that the default values do not meet your needs, they can easily be
changed.
Threshold Alarm Reminder
0
Customers can use a threshold alarm to remind administrators that the Exception
Report should be examined. If a customer does not want to see the alarm, the
severity can be downgraded to informational using the Core System alarm
conditioning commands. To notify one or more people about this alarm reminder,
use a PI script to send e-mail to those who should be notified and then clear the
alarm explicitly. The script must be run on every Core System on which exception
report data is processed.
Customers should evaluate the list of fields administered for thresholding/
exception report generation in order to have an alarm that matches their needs.
For example, if the list is focused on fields for a particular module type, the alarm
relates to that module type only.
Changing Threshold Values
The following procedure illustrates how to change threshold values.
For this example, you want to change the threshold value of DDS Trunk Average
Receive Utilization from the default value of 65% to 70%. You have mostly DDS
trunks in your network, the Exception Reports are too big, and you want to focus
on just the busiest DDS trunks.
Procedure 13-3.
Changing Threshold Values
1. At the Performance Reporter Control Window, (Screen 13-1), select
Administer, Threshold, Threshold Values, and Bandwidth Utilization
from the sub-menus.
StarKeeper II NMS Graphics System Guide, R10.0, Issue 1
13-5
Administering Performance Reporter
2. Position the pointer on Receive Utilization and click.
The following pop-up window Threshold Values: Bandwidth Receive Utilization is displayed with the default of trunk.
Threshold Values: Bandwidth Receive Utilization
Resource Type
Trunk
Defaults
Link
M1-shelf
% Average Receive Utilization
% Peak Receive Utilization
Trunk
Type
Default
Values
User
Values
Include in
Exc Report
Default
Values
User
Values
Include in
Exc Report
dds
65
65
Y
80
80
Y
hs
70
70
Y
80
80
Y
pq
70
70
Y
80
80
Y
sft
70
70
Y
80
80
Y
swt
70
70
Y
80
80
Y
t1
70
70
Y
80
80
Y
trk64
65
65
Y
80
80
Y
trke3
70
70
Y
80
80
Y
trke3a
70
70
Y
80
80
Y
trke3s
70
70
Y
80
80
Y
trkt3
70
70
Y
80
80
Y
trkt3a
70
70
Y
80
80
Y
trkt3i
70
70
Y
80
80
Y
trkt3s
70
70
Y
80
80
Y
Apply
Reset
Screen 13-4.
Cancel
Help
Threshold Values for Bandwidth Receive Utilization Window
3. Review the form that is displayed. Look for the trunk type dds. This will be
the default value because you have never changed it.
4. Position the pointer on the User Values field under Average Receive Utilization that you wish to change and click.
5. Using your keyboard, enter the value 70.
6. Position the pointer on
13-6
Apply
at the bottom of the screen and click.
StarKeeper II NMS Graphics System Guide, R10.0, Issue 1
Administering Performance Reporter
An appropriate message will be displayed at the bottom of the form.
7. To dismiss the windows, click on
Cancel
.
The Daily Exception Report will be generated using the User Value that you just
entered. The Weekly and Monthly reports are summaries of the Daily Exception
Report reports. The Threshold Value column in the Weekly and Monthly reports
are displayed to show the current threshold value set. It will reflect the most recent
threshold values for the entire week or month even if the change was made on the
last day of the week or month.
Including or Excluding Items from Exception
Reports
The following procedure illustrates how to include or exclude certain items from
exception reports. By default, when the threshold feature is activated, all items are
included in the Exception Reports.
You may want to exclude all Peak Trunk Utilization exceptions from the Exception
Reports because you are using the reports only for Long-Term Engineering. You
have Average Trunk Utilization on the reports, which is more useful for engineering; and you’re not interested in having peak data on the reports.
Procedure 13-4.
Including or Excluding Items from Exception Reports
1. At the Performance Reporter Control Window (Screen 13-1), select
Administer, Threshold, Threshold Values, and Bandwidth Receive Utilization from the sub-menus.
2. Position the pointer on Receive Utilization and click.
The pop-up window (shown in Screen 13-4) is displayed with the default of
trunk.
3. Review the form that is displayed. Look for the Peak Receive Utilization columns. Position the pointer on the field under the Include in Exc Report
column for the first trunk type that you wish to include or exclude. Depending on what has been set in previous sessions, a Y or an N will be in the
field. A Y in the field means that the resource type will be included in the
report.
4. Position the cursor on the field and change the field from Y to N or back by
clicking on the field.
5. Repeat this step for all trunk types on the form that you wish to change.
6. Position the pointer on
Apply
at the bottom of the screen and click.
An appropriate message will be displayed at the bottom of the form.
7. To dismiss the windows, click on
Cancel
.
StarKeeper II NMS Graphics System Guide, R10.0, Issue 1
13-7
Administering Performance Reporter
The Daily Exception report will no longer include the peak receive utilization
exceptions for the trunks where you specified N in the field. However, the Weekly
and Monthly reports will still include Peak Receive Utilization exceptions for trunks
up until the change was made. A procedure similar to Procedure 13-4 can be
used to exclude peak trunk transmit utilization exceptions from the Exception
reports.
Updating Configuration Data
The following procedure illustrates how to update configuration data. Updating
configuration data is the process of synchronizing node, trunk, group, and module
configuration information on the Graphics System to the node and trunk information on the connected Core Systems. You will want to do this if there have been
changes to the node, group, or trunk names on which you are running reports.
This process may take a few minutes to complete.
Procedure 13-5.
Updating Configuration Data
1. At the Performance Reporter Control Window, (Screen 13-1), select
Administer and then Update Configuration Data from the sub-menu.
The following notice window is displayed.
Screen 13-5.
Update Configuration Data Notice Window
NOTE:
If you wish to dismiss the window, position the pointer on Cancel and click.
This can only be done if you have not already chosen Update . Once Update
is chosen, the update cannot be stopped.
2. Position the pointer on Update and click. Progress messages or error messages will be displayed in the footer of the base window.
13-8
StarKeeper II NMS Graphics System Guide, R10.0, Issue 1
Administering Performance Reporter
The following message will be displayed in the footer of the base window.
Configuration data update is in progress
When the update has completed, the following message will be displayed
in the footer of the base window.
Configuration data update is complete
Also, after the update is complete, a database glyph is displayed in the Bulletin Board. Clicking on the glyph brings up a message.
Screen 13-6.
Database Bulletin Board Message
Updating Configuration Data Via a Cron File
To make the Updating Configuration Data process more convenient, you can
run the task on your Graphics System via a cron file. The following procedure illustrates an example to help you in setting up a StarKeeper II NMS Performance
Reporter cron file:
StarKeeper II NMS Graphics System Guide, R10.0, Issue 1
13-9
Administering Performance Reporter
Procedure 13-6.
Updating Configuration Data via a Cron File
To ADD the pr_cron process to the root crontab file, and to activate the pr_cron
process weekly, on every Monday at 2:00 am, you should do the following:
1. su to root, or login as root.
2. Edit the /var/spool/cron/crontabs/root file and add the following entries:
# Activate PR cron configuration data update at 2:00 AM weekly o Mon.
0 2 * * 1 PR_ROOT=/usr2/PR /usr2/PR/bin/pr_cron >/dev/null 2>&1
3. Enter crontab /var/spool/cron/crontabs/root to update the crontab entry
on your system.
Once your Performance Reporter cron is set up, the following information
will be displayed in the $EVENTLOG for the pr_cron process every Monday
morning:
02:00
107006 REPORT CNMSMSG pr_cron: PR cron configuration data update
started.
02:01
107006 REPORT CNMSMSG pr_cron: PR cron configuration data update
has completed.
To delete the pr_cron process from the root crontab file, you should do the following:
1. su to root, or login as root.
2. Edit the /var/spool/cron/crontabs/root file and delete the pr_cron entries.
3. Enter crontab /var/spool/cron/crontabs/root to update the crontab entry
on your system.
13-10
StarKeeper II NMS Graphics System Guide, R10.0, Issue 1
Administering Performance Reporter
Specifying the Retention Period for
Filed Reports
The Performance Reporter allows daily, weekly, and monthly reports to be run regularly according to the schedule that you set. These reports can be sent to a file or
to a printer. When sent to a file, the reports are accessible for a certain period of
time and then deleted. When sent to a printer, the reports are printed only and not
saved to a file.
Exception Reports are automatically generated according to a fixed or non-administrable schedule. They are filed and accessible for a certain period of time before
being deleted. The same retention period applies to both Scheduled Reports and
Exception Reports.
There are default values for the retention period of these reports. The values are:
2 or 7 days for daily depending on the module type, 31 days for weekly, and 92
days for monthly. You can change the retention period value using the Disk Clear
Administration window of the Workstation Administration application
The purpose of increasing the retention period for filed reports is to allow them to
be accessible, for displaying or printing, for a longer time.
NOTE:
This retention value is not associated with the retention of the raw
performance data which is controlled by the Core System. To change the
retention period of the data, see the StarKeeper II NMS Core System
Guide.
Even though a filed report has been deleted, it is possible to request that report
again as long as the performance data is still retained by the Core System.
StarKeeper II NMS Graphics System Guide, R10.0, Issue 1
13-11
Administering Performance Reporter
Troubleshooting Performance Reporter
13-12
If this happens...
Do this...
At the StarKeeper II NMS
subpanel, Performance
Reporter does not appear.
Either Performance Reporter was not installed on your
Graphics System or you have not been added as Performance Reporter user.
The Request Report button is
greyed out in the
Performance Reporter
Control Window.
The Performance Reporter application was started
before the configuration data was transferred from the
Core System.
Wait a minute, then try again or invoke the Update
Configuration Data choice from the Admin window.
My node, (link, trunk, group)
list seems incomplete or the
message tells me that the list
is incomplete.
Configuration data from one or more of the Core System connections has been changed.
From the ADMIN window select the Update Configuration Data choice.
I tried to access a second
report request, but the
window is frozen. A notice
window is on the screen from
a previous request.
Notice windows must be acted upon before another
window can be accessed.
Expected Exception reports
are not being generated or
are generated with different
threshold values.
Thresholding is a per Graphics System feature. A subsequent Performance Reporter user may have
changed the status or values.
Check the Thresholding Status and the Thresholding
Values windows to see if they have been updated.
Previous days, weeks or
months exception reports
have been deleted.
Exception reports are saved with a specific retention
time. It can be changed through Workstation Administration. See Specifying the Retention Period for
Filed Reports earlier in this chapter.
Large reports are not complete
Reports time out after approximately 15 minutes.
Select criteria that will narrow the report search or offload the data.
StarKeeper II NMS Graphics System Guide, R10.0, Issue 1
Using Performance Reporter for
Routine Performance Assurance 0
14
Routine performance assurance is the daily monitoring of key performance measurements in the network to identify service-affecting or potential service-affecting
conditions. A service-affecting condition is defined as something that affects user
response time or availability (access to network services). It can be equipment
failures or performance problems, such as a traffic problem. While alarms are
often generated for equipment failures, the more elusive performance problems in
the network may be identified through routine performance assurance.
There are three steps in routine performance assurance. The first is identifying a
performance problem. The second is troubleshooting the problem. The third is
solving the problem. While it is not always possible to solve a problem in real time,
it is important that the Network Administrator be aware of it. Sometimes a problem
can be fixed, other times a problem will be set aside for an engineering solution.
The focus of this chapter is in using the Performance Reporter to identify and
troubleshoot performance problems. The Performance Reporter is not the vehicle
for solving the problem. It provides access to information, and the Network
Administrator must use that information to arrive at conclusions. This chapter
shows examples of both how the information is accessed and how the user might
interpret the information to be used in solving problems.
This chapter will show the procedures for accessing the exception reports and for
requesting on-demand performance measurement reports. It will also present a
scenario for using the reports, followed by some examples.
StarKeeper II NMS Graphics System Guide, R10.0, Issue 1
14-1
Using Performance Reporter for Routine Performance Assurance
The Performance Reporter Control
Window
The following is the Performance Reporter Control Window.
Screen 14-1.
Performance Reporter Control Window
Accessing Exception Reports
There are two types of Daily Exception Reports. The two types are:
■
Daily Exception Report - Summary
■
Daily Exception Report - Detail
Daily Exception Report - Summary
To view a Daily Exception Report - Summary, perform the following procedure.
Procedure 14-1.
Accessing a Daily Exception Report - Summary
1. At the Performance Reporter Control Window, using the mouse, position
the pointer on List and click. A menu will be displayed.
2. Position the pointer on Exception Reports and click.
14-2
StarKeeper II NMS Graphics System Guide, R10.0, Issue 1
Using Performance Reporter for Routine Performance Assurance
The following pop-up window, listing the exception reports, is displayed
with the default of daily.
Screen 14-2.
Exception Reports Pop-Up Window
3. Position the pointer on the Summary Report, with the desired day’s date
and click to highlight your selection.
4. To display the report on the screen, click on
StarKeeper II NMS Graphics System Guide, R10.0, Issue 1
Display
.
14-3
Using Performance Reporter for Routine Performance Assurance
The following pop-up window will be displayed with the contents of the
Exception Report that you chose.
Screen 14-3.
Exception Reports: Daily Summary Report
5. Use the scrollbar to move up and down the list of items.
This report shows the exceptions by resource type. Frequency is the number of hourly intervals in which the threshold was reached. For example, if
the frequency is 12, the threshold value was reached 12 times out of the 24
hourly intervals in a day. It is useful in determining the order in which problems should be worked.
If the summarized list is sufficient, you can either work from the screen or
print a hardcopy of the list.
6. To print a hardcopy of the report, click Print . You may have to reposition
the window to access the Print button on the previous window.
7. To dismiss the window, click
Cancel
.
If a more detailed report is needed, for example, an itemized list of when each
exception occurred, you can access the Daily Exception Report - Detail.
14-4
StarKeeper II NMS Graphics System Guide, R10.0, Issue 1
Using Performance Reporter for Routine Performance Assurance
Daily Exception Report - Detail
To view a Daily Exception Report - Detail, perform the following procedure.
Procedure 14-2.
Accessing a Daily Exception Report - Detail
1. At the Performance Reporter Control Window, (Screen 14-1), select List,
then select Exception Reports.
The pop-up window (shown in Screen 14-2), listing the exception reports,
is displayed with the default of daily.
2. Position the pointer on the Detail Report, with the desired day’s date and
click.
The screen will be redrawn with your selection displayed within a box and
the Display and Print buttons will no longer be greyed out.
Screen 14-4.
Exception Reports Pop-Up Window Redrawn
StarKeeper II NMS Graphics System Guide, R10.0, Issue 1
14-5
Using Performance Reporter for Routine Performance Assurance
Depending on the size of the Exception Report and your operation, you
have the option to either print or just display the report. The reports are
available to print or display for a 5-day period. To eliminate unnecessary
printing, you may choose to display the report first and then print it only if
you want a hardcopy.
3. To display the report on the screen, click on
Display
.
The following pop-up window will be displayed with the contents of the
Exception Report.
Screen 14-5.
Exception Reports: Daily Detail Report
4. Use the scrollbar to move up and down the list of items.
5. To print a copy of the report, click
6. To dismiss the window, click
14-6
Cancel
Print
.
.
StarKeeper II NMS Graphics System Guide, R10.0, Issue 1
Using Performance Reporter for Routine Performance Assurance
Requesting On-demand Reports
On-demand reports are generated immediately and sent to the screen, a printer,
or a file. To obtain on-demand reports, perform the following procedure.
Procedure 14-3.
Requesting On-demand Reports
1. At the Performance Reporter Control Window, (Screen 14-1), select
Request Report, Bandwidth Utilization, then select Trunk.
The following form will be displayed with the default of Trunk Type.
Screen 14-6.
Bandwidth Utilization - Trunk Form
StarKeeper II NMS Graphics System Guide, R10.0, Issue 1
14-7
Using Performance Reporter for Routine Performance Assurance
NOTE:
Identifying trunks by trunk name or module address is useful for requesting
on-demand reports for a specific trunk or module address. To request a
report by Trunk Name or Module Address position the pointer on
Trunk Name or Module Address in the Select By field and click. If Trunk Name or
Module Address were selected, the screen will be displayed again with
new fields.
2. Fill out the form using the following field descriptions as a basis for your
entries. The fields will vary for different report types. Refer to on-line help
for those fields.
■
■
Trunk Type
You can either enter a single trunk type via the keyboard or pick from
the trunk type list. To access the trunk type list, click on Trunk Type . A
scrolling list of all trunk types will be displayed. Click on one or more
of the trunk types in the list, or choose ALL for all trunks. When you
are finished, click on OK . The list will disappear and your selections will be displayed in the text field area.
■
Node Name
You can either enter a single node name via the keyboard or pick
from the Node Name list. To access the node name list, click on
Node Name and click. The list changes as nodes are added or
deleted. Click on one or more of the node names in the list, or
choose ALL for all nodes. When you are done, click on OK . The list
will disappear and your selection will be displayed in the field provided.
Report Preferences
— Format
Position the pointer on the tabular or graphical option and click.
Since graphs are available only for some types of reports, this option
will only be displayed when applicable. Tabular is the default for this
field.
— Destination
The recommendation is to display on-demand reports on the
screen, even if you want to file or print them. Once you see the
report, you can decide whether you want to file it, print it, or run it
again.
— File Name
If you have requested that your report be filed, you are prompted for
the File Name. The File Name can be from 1 to 14 alphanumeric
characters long. It will be validated against your other file names
when the report has been submitted.
14-8
StarKeeper II NMS Graphics System Guide, R10.0, Issue 1
Using Performance Reporter for Routine Performance Assurance
— Report
Position the pointer on on-demand or scheduled and click.
on-demand is the default for this field.
■
Summary Preferences
— Period
Position the pointer on the daily, weekly, or monthly option, and click.
Daily is the default for this field.
— Period Start
The default is the last completed day, week, or month. You can
change the date up to today’s date, which will give you reports for
partial periods of days, weeks, or months. The format for this field is
mm/dd/yy. Leading zeros are not required.
— Interval
This field specifies the hours of data that you want in the report. The
format is hh-hh. The default is 08-17, that is from 08:00 to 17:00
hours (8 a.m. to 5 p.m.). You can decrease the interval to a single
hour or increase it to 24 hourly intervals.
■
Schedule Preferences
— Day of Week
Enter the day of the week that you want the report to be run. This
field only appears when a summary period of weekly was selected.
— Day of Month
Enter the day of the month that you want the report to be run. This
field only applies when a summary period of monthly was selected.
— Time
Enter the time of day that you want the report to be run.
StarKeeper II NMS Graphics System Guide, R10.0, Issue 1
14-9
Using Performance Reporter for Routine Performance Assurance
The following is an example of a completed form.
Screen 14-7.
Bandwidth Utilization - Trunk Form, Completed
The command buttons at the bottom of the form are used to execute your
request. They are: Submit , Display , Abort and Cancel
■
Submit
Once you select Submit , it is greyed out and a message Report is
being requested appears in the message area. If you close the
window, the request form disappears and the request is not processed.
14-10
StarKeeper II NMS Graphics System Guide, R10.0, Issue 1
Using Performance Reporter for Routine Performance Assurance
NOTE:
If you dismiss the window by mistake, you can retrieve the
request information by accessing the form again.
The default values are from the last report request that was made.
After the request has been validated, the message Report is
being requested is displayed in the message area. Submit is now
greyed out, which means that you cannot select it. Display is still
greyed out, which means that it does not apply. Abort is active.
If you dismiss the pop-up window, the request form disappears and
the report generation is stopped. If the request was directed to the
screen, it will not be accessible. However, if the request was directed
to a file or printer, it may be completed, depending on when you
stopped it. The only way to tell if the report was appended to the list
is to check the List Filed Reports (for on-demand reports) or
check the printer.
A request will be completed when the message Report has been
generated is displayed on the message line of the pop-up window,
and the report can be either displayed on the screen or can be
retrieved from the file or sent to the printer. A bell will ring when the
request is complete.
■
Display
This button is active only when you have requested the report to be
sent to the screen and the report is available. The message Report
has been generated will be displayed in the message area.
Display will be active; Abort and Submit will be greyed out.
Selecting Display will grey out that button, making all buttons on the
request form inactive. A separate pop-up window will be displayed
with the contents of the report, with Print , Save , Cancel and Help
buttons at the bottom.
Print allows you to print the entire report to the printer connected to
the Graphics System.
allows you to enter a file name. It will be validated against
other file names, and you have the option to overwrite an existing file
of the same name if you choose.
Save
Previous Graph and Next Graph allow you to page backwards and forwards respectively, through graphs. Cancel allows you to dismiss the
report window.
If you dismiss the window before you select Display , then the request
window goes away and no report is displayed.
StarKeeper II NMS Graphics System Guide, R10.0, Issue 1
14-11
Using Performance Reporter for Routine Performance Assurance
■
Abort
This button is active only between the time the Report is being
requested and Report has been generated messages are
displayed. It allows you to stop a report and hence free up the window for another request. For example, maybe the request is taking
too long (in which case you should schedule it), or you realize in
looking at the request form that you have made a mistake.
■
Cancel
This button is used to dismiss the window.
3. Position the pointer on the desired command button and click.
Troubleshooting Performance
Problems
This is a suggested scenario for troubleshooting performance problems that were
identified in the Daily Exception Reports.
1. The first step in troubleshooting performance problems is to review the
contents of the Daily Exception Reports. Focus on the most frequently
occurring exceptions, which will be listed at the top of the Daily Exception
Report - Summary, covered at the beginning of this chapter.
If you want more detail on the exceptions, check the Daily Exception
Report - Detail, also covered in this chapter.
2. Compare the current summarized exception report (which is from yesterday) against the previous summarized exception report (which is from the
day before yesterday).
If you don’t have a hardcopy from the previous days report, refer to the procedures on Accessing Daily Exception Reports in this chapter and obtain a
report with the desired date.
■
See if the problem still exists, stayed the same, or got worse.
■
If you performed a fix yesterday, see if it worked.
3. Compare the data against the current network.
14-12
■
Obtain an on-demand report to see if the trouble still exists.
■
Request status from the node. For example, execute the node’s
dstat command.
■
Look for related alarms that could explain trouble.
StarKeeper II NMS Graphics System Guide, R10.0, Issue 1
Using Performance Reporter for Routine Performance Assurance
4. Request more detailed information on the exception.
If trouble still exists, request on-line detailed exception report for the previous day, showing the hours that the threshold was exceeded and by how
much.
5. Decide which troubles are important to be fixed or referred.
■
Disregard expected or known troubles that will be relieved by a
planned fix.
■
Disregard troubles that can be explained by known events; for example, power outage, alarm, user traffic, day of the week.
■
Concentrate on potential service-affecting troubles.
Fixing Performance Problems
Performance problems can be fixed in a number of ways. The following list shows
a few things that can be done to fix a performance problem.
■
Implement short-term fix for logical resource problems, for example,
change group assignments, change destination, or add channels to name
a few.
■
Refer recurring problems or important physical resource problems to the
engineering group.
■
Follow-up on today’s fixes by periodically running on-demand reports for
the latest data to see if the fix worked. See the procedure on Requesting
On-demand Reports.
StarKeeper II NMS Graphics System Guide, R10.0, Issue 1
14-13
Using Performance Reporter for Routine Performance Assurance
Examples
The following is a sample Daily Exception Report - Summary that is the basis of
the following examples.
Screen 14-8.
Daily Exception Report Example
Error Free Transmission (EFT) Thresholds
■
Note that the EFT for the DDS trunk is the most frequently exceeded
threshold.
■
Compare to the previous day’s exception report and note that the frequency has increased.
■
Compare against the current network.
— look at today’s alarms (via Network Monitor) for CRC and RECVR
ABORT errors. CRC errors indicate noise on the line, which is a
facility problem. RECVR ABORT errors indicate that the module is
overloaded: there is either too much traffic on the line, the line speed
is low, or the module is reaching its capacity. A RECVR ABORT
error requires a logical reconfiguration.
14-14
StarKeeper II NMS Graphics System Guide, R10.0, Issue 1
Using Performance Reporter for Routine Performance Assurance
■
Request an on-line detailed daily exception report for DDS trunk; see at
what time the EFT threshold was exceeded, and by how much.
■
Refer the problem to the engineering group. Print or save pertinent supporting information to a file. CRC errors should be referred to the vendor.
RECVR ABORT errors require logical reconfiguration.
Peak and Average Trunk Utilization Thresholds
■
See that the peak and average trunk utilization for the DDS trunks are frequently exceeded thresholds (in the receive direction).
■
See that the same trunk has EFT problems, indicating a related trouble.
■
Compare to the previous day‘s trunk utilization report (on-line) for the DDS
trunk.
— Check the transmit peak and average utilization figures. If high also,
suspect a line problem. If not high, suspect a module problem with
the receiving end. Continue to investigate; for example, dstat or
dmeas on the trunk module, module-level performance report for
the trunk module, CRC or RECVR ABORT errors on the module.
■
Refer the problem to the engineering group, to pursue with vendor. Print or
save pertinent supporting information to a file. Indicate whether line or
module problem is suspected.
Contention Failure Thresholds
■
See that the number of contention failures for groupx exceeded the threshold 7 times yesterday. Assume that these are during the typical busy hours.
■
Request the on-line detailed exception report for the previous day to see
during what hours it exceeded the threshold and by how much.
■
Compare to the previous day’s summary report and see that this is a new
problem.
■
If possible, relate it to a known network condition for example, a trunk was
down yesterday, a number of new users were added, etc.
■
Compare against the current network.
— look at today’s utilization - trunk group connections report (high
level) to see if the call success rate is low and/or % peak channel utilization is high.
— look at today’s utilization - trunk group connections report (failure
detail) to see if there are a high number of contention failures.
■
If problem still exists today, allocate more channels to the group using the
node’s change group command.
StarKeeper II NMS Graphics System Guide, R10.0, Issue 1
14-15
Using Performance Reporter for Routine Performance Assurance
Security Failure Thresholds
■
See that the number of security failures for groupy exceeded the threshold
6 times yesterday.
■
Request the on-line detailed exception report for the previous day to see
during what hours it exceeded the threshold and by how much.
— If it exceeded the threshold after midnight, consider it a possible
security breach.
■
Compare to the previous day’s summary report and see that this is the second time in a row for this trunk group. You may want to check the previous
summary reports, either on-line or hardcopy, to see if the trunk group was
also on those reports.
■
Refer the problem to the System Administrator. Print or save to a file the
supporting information.
Peak Connection Utilization Thresholds
■
See that the percent peak channel utilization for groupx exceeded the
threshold 5 times yesterday. This can lead to an increased response time
for calls going through the trunk group, and may also lead to call blocking.
■
Compare to the previous day’s summary report. If the number of exceptions for groupx has decreased, it may not be worth pursuing. If the number of exceptions has increased, then request the detailed exception
report.
■
Request the on-line detailed exception report for the previous day to see
during what hours it exceeded the threshold and by how much.
■
Request the on-line utilization - connections report for groupx, using yesterday’s date looking at 24 hourly intervals.
— Look for the hours in which the threshold for % peak channel utilization was exceeded.
— For those hours, see if the call success rate was less than 100%,
indicating call failures.
— If there are failures, request the detailed failure analysis to determine whether these are security, contention, or other (most likely
indicating a hardware or software problem). Since failures are also
thresholded, it is likely that there will be a corresponding entry in the
exception report for a failure.
■
14-16
Refer chronic or serious security failures to the System Administrator. Print
or save to a file the supporting information.
StarKeeper II NMS Graphics System Guide, R10.0, Issue 1
Using Performance Reporter for Routine Performance Assurance
■
If it is a contention problem and there are unused channels in existing modules, allocate more channels to that trunk group by administering the trunk
module(s) in that group. See Chapter 8, or the node’s change trunk command to add channels.
■
If there are no known spare channels, refer the problem to the engineering
group. Either a new module must be used or channels must be found in
existing modules.
Frame Relay Thresholds
■
The Exception report displays module, port, facility, virtual port, and dlci
level fields in the Field Name column. For the FRM module, module, port,
facility, and dlci fields are shown; for the FRM-M2 module, module, port, virtual port, and dlci fields are shown. The Resource Type column displays:
— module specifies the frame relay module level field
— port specifies the port level field for FRM or the physical port level
for FRM-M2
— facility specifies the facility level field for FRM
— virtual port specifies the virtual port level field for the FRM-M2
— dlci specifies the DLCI level field.
■
Execute skschema -t <table_name> to determine field definitions for FRM
and FRM-M2. The threshold field names are selected as follows:
—frm_mod for the FRM module level
—frm_fac for the FRM facility level
—frm_port for the FRM port level
— frm_dlci for the FRM DLCI level
—frm_m2_mod for the FRM-M2 module level
—frm_m2_pport for the FRM-M2 physical port level
—frm_m2_vport for the FRM-M2 virtual port level
—frm_m2_dlci for the FRM-M2 DLCI level.
NOTE:
Although skschema will indicate that the FRM and FRM-M2 DLCI
fields listed on the next page are stored as counters in the database,
Exception Reports will present these fields as percentages (ratios of
the counter value to the total number of frames received or
transmitted on the DLCI). When setting the threshold values for
these fields, you must specify the desired value as a percentage in
the range 0 to 100. For details on how each is calculated, refer to the
StarKeeper II NMS Graphics System Guide, R10.0, Issue 1
14-17
Using Performance Reporter for Routine Performance Assurance
Performance Reporter On-Line Help. The affected fields are:
frms_de_rcv
frms_fecn_rcv
frms_becn_rcv
14-18
frms_de_xmit
frms_fecn_xmit
frms_becn_xmit
StarKeeper II NMS Graphics System Guide, R10.0, Issue 1
Using Performance Reporter for
Long-Term Traffic Engineering
0
15
The purpose of long-term engineering is to keep the network running optimally
over time, taking into consideration its past performance and anticipated changes.
There are several supporting activities: accessing, reviewing, and analyzing performance data are the primary activities. Three sets of information should be
available to you for long-term traffic engineering: the specifications for the current
network, with performance objectives; performance measurement reports to see if
the objectives are being met; and a network plan for the future, which may be
modified to address deficiencies of the current network or future changes.
Performance objectives are usually end-to-end measures that you establish. The
threshold values that you select (see Chapter 13) are useful for identifying physical and logical resource problems, but they are not necessarily performance
objectives.
This chapter provides the procedures to schedule performance measurement
reports. It also presents a scenario for using the reports and some examples.
StarKeeper II NMS Graphics System Guide, R10.0, Issue 1
15-1
Using Performance Reporter for Long-Term Traffic Engineering
The Performance Reporter Control
Window
The following is the Performance Reporter Control Window.
Screen 15-1.
Performance Reporter Control Window
Requesting Scheduled Reports
(Bandwidth Utilization Link)
Scheduled reports are generated according to the date and time you specify. You
can review these report requests by choosing List and then choosing Request
Report.
Procedure 15-1.
Requesting Scheduled Reports (Link Bandwidth
Utilization)
1. At the Performance Reporter Control Window, (Screen 15-1), select
Request Report, Bandwidth Utilization, and then Link from the
sub-menus.
15-2
StarKeeper II NMS Graphics System Guide, R10.0, Issue 1
Using Performance Reporter for Long-Term Traffic Engineering
The following form will be displayed with the default of Link Type. This
screen is dynamically displayed, so some of the information will be displayed according to your input. The screen will be redrawn as information is
entered.
Screen 15-2.
Scheduled Report Link Bandwidth Utilization Form
2. Fill out the form using the following field descriptions as a basis for your
entries. The fields will vary for different report types. Refer to on-line help
for those fields.
■
Link Type
Position the pointer and click for any or all link types. For a scheduled report, you will probably want to report on all links and run the
reports by link type. You can select any or all of the link types for a
single report.
StarKeeper II NMS Graphics System Guide, R10.0, Issue 1
15-3
Using Performance Reporter for Long-Term Traffic Engineering
■
■
Node Name
You can either enter a single node name via the keyboard or pick
from the Node Name list. This is the scrolling list of all nodes that
are known to the Core System. The list changes as nodes are
added or deleted. You can select specific Node Name(s) or all.
Report Preferences
— Format
Position the pointer on the tabular option and click. Since graphs are
available only for some types of reports, this option will only be
displayed when applicable. Tabular is the default for this field.
— Destination
The recommendation is to display on-demand reports on the
screen, even if you want to file or print them. Once you see the
report, you can decide whether you want to file it, print it, or run it
again.
— File Name
If you have requested that your report be filed, you are prompted for
the File Name. The File Name can be from 1 to 14 alphanumeric
characters long. It will be validated against your other file names
when the report has been submitted.
— Report
Position the pointer on on-demand or scheduled and click.
On-demand is the default for this field.
■
Summary Preferences
— Period
Position the pointer on the daily, weekly, or monthly option, and click.
Daily is the default for this field.
— Period Start
The default is the last completed day, week, or month. You can
change the date up to today’s date, which will give you reports for
partial periods of days, weeks, or months. The format for this field is
mm/dd/yy. Leading zeros are not required.
— Interval
This field specifies the hours of data that you want in the report. The
format is hh-hh. The default is 08-17, that is from 08:00 to 17:00
hours (8 a.m. to 5 p.m.). You can decrease the interval to a single
hour or increase it to 24 hourly intervals.
■
Schedule Preferences
— Day of Week
Enter the day of the week that you want the report to be run. This
field only appears when a summary period of weekly was selected.
15-4
StarKeeper II NMS Graphics System Guide, R10.0, Issue 1
Using Performance Reporter for Long-Term Traffic Engineering
— Day of Month
Enter the day of the month that you want the report to be run. This
field only applies when a summary period of monthly was selected.
— Time
Enter the time of day that you want the report to be run.
The following is an example of a completed form.
Screen 15-3.
Scheduled Report Link Bandwidth Utilization Form
Completed
StarKeeper II NMS Graphics System Guide, R10.0, Issue 1
15-5
Using Performance Reporter for Long-Term Traffic Engineering
The command buttons at the bottom of the form are used to execute your
request. They are: Submit , Display , Abort and Cancel .
■
Submit
This is the only active button at the bottom of the report request. It
works like Submit at the bottom of the on-demand request window.
Once you select Submit , the button is grayed out and the message
Report has been scheduled is displayed in the footer of the
window. If you unpin the window, the request form disappears and
the request is not processed.
NOTE:
If you dismiss the window by mistake, you can retrieve the
request information by accessing the form again. The default
values are from the last report request you made.
After the request has been validated, and the report scheduled, the
message Report has been scheduled is displayed in the footer
of the window. Submit is now active again.
If you dismiss the window while it is being validated, the form goes
away and a report request may have been generated if you didn’t
catch it in time. There is no way to display a message to tell you
what has happened. Choose Display from the List menu to check if
the request has been entered. It will be the most recent request, if it
is there.
■
Display
This is not valid for scheduled reports, because they can go only to a
file or a printer.
■
Abort
This is not valid for scheduled reports, because it will not be necessary to wait a long time for a report request to be created. If you
have made a mistake and want to delete the request, complete the
following steps:
— Choose List on the Performance Reporter menu.
— Position the pointer on Report Requests and click. The system displays a list of requested reports.
— Select the report to be deleted.
— Position the pointer on
deleted.
■
Delete
and click. The report request is
Cancel
This button is used to dismiss a window.
15-6
StarKeeper II NMS Graphics System Guide, R10.0, Issue 1
Using Performance Reporter for Long-Term Traffic Engineering
3. Position the pointer on the desired command button and click.
Scenario
1. Identify performance problems which require a long-term solution
■
Receive chronic problems from the operations group
■
Review trend reports for troubles
— weekly exception report
— monthly exception report
— weekly and monthly reports for network resources (e.g., network availability, trunk utilization, connections). Run the
graphical versions of these reports.
■
Initiate studies, as needed, to investigate troubles further
— schedule standard Core System reports
— create and schedule customized reports
■
Identify vendor troubles and refer them to vendor for resolution
(most likely will be facility problems to be referred to a carrier)
2. Identify network growth needs
■
review trend reports, looking for increase or decrease in usage over
time. Use thresholds as a guide.
■
compare to what the network was engineered for
■
refer to planned network changes (e.g., new users, new applications, new hosts)
3. Arrive at one solution that solves both problems and growth needs
■
Modify current plan
■
Create new plan
Examples
The following are long-term traffic engineering procedural examples.
StarKeeper II NMS Graphics System Guide, R10.0, Issue 1
15-7
Using Performance Reporter for Long-Term Traffic Engineering
Bandwidth Utilization Trunk/Link
1. Run the weekly and monthly graphical Bandwidth Utilization Trunk/Link
reports on a regular basis.
2. Review the reports after they are run. Determine if you want to look at the
corresponding tabular reports while they are still available four weeks for
weekly reports, three months for monthly reports).
3. Look for peaks and averages that exceed thresholds. These are problem
areas. Look also at the difference between peak and average values of
overutilized trunks. The smaller the difference, the more frequently the
trunk is running at a higher utilization.
4. Look for averages that are decreasing over time. These may be underutilized resources that can either have more traffic on them or be downgraded.
5. Look for peaks and averages that grow steadily over time. These are
growth areas, requiring either an upgrade or additional resources.
Bandwidth Utilization Node
1. Run the weekly and monthly tabular Bandwidth Utilization Node reports on
a regular basis.
2. You may want to run the daily version of these reports for new nodes or for
nodes that are being watched (e.g., a node that is known to be over the
peak and average threshold). For new nodes, you may want to reposition
the modules; e.g., move to a higher or lower priority backplane slot or find
out if you have spare bandwidth.
3. Review the reports after they are run. Determine if you want to look at the
detailed information while it is still available; e.g., daily Bandwidth Utilization Node reports, corresponding alarm reports, user trouble calls. You are
looking for information that could be used to interpret a high utilization percentage.
4. The backplane utilization can be high without impacting throughput or
delay. A high utilization is desirable because it indicates that you are making use of the bandwidth you’ve purchased. However, there may be a level
(depending on the types of modules and traffic) at which a particular node
starts to function less than optimally. Also, a particular module may be performing less than optimally because of its type and its position on the backplane.
5. Look for peaks and averages that exceed thresholds. These are potential
problem areas. Look also at the difference between peak and average values of overutilized nodes. The smaller the difference, the more frequently
the node is running at a higher utilization. Again depending on the node
configuration, this may or may not be a problem.
15-8
StarKeeper II NMS Graphics System Guide, R10.0, Issue 1
Using Performance Reporter for Long-Term Traffic Engineering
Port Capacity Utilization
1. Run the weekly and monthly graphical Port Capacity Utilization reports on
a regular basis.
2. Review the reports after they are run. Determine if you want to look at the
corresponding tabular reports while they are still available (four weeks for
weekly reports, three months for monthly reports). You may also want to
look at the Module Performance Reports for specific addresses, which
shows the % busy occurrences of the module as well as module-level
errors.
3. Look for peaks that exceed thresholds. These are potential problem areas.
To determine whether or not this is a service-affecting problem, check the
following:
■
Utilization for other ports on the same module. If all ports have high
peak utilization (not necessarily over the threshold) at the same
time, then the module capacity may have been exceeded.
■
Module level errors on the Module Performance Report.
■
% busy occurrences of the module.
■
The capacity of the module. To see the throughput of the module,
add up all the bytes passing through it and divide by the module
capacity. A high throughput can indicate a problem.
■
The port line speeds. There may be a mismatch in the port configuration and the facility itself.
4. Look for unusually low utilization. These resources are either underutilized
because of low user traffic or module congestion. If the module is congested and it is not due to traffic across the port, then check the Bandwidth
Utilization Node Report for high utilization. You may need to change the
physical location of the module to a higher priority backplane slot.
5. Some of the other possible solutions are: change the line speed, decrease
the number of groups using this module, or replace the board.
6. Look for averages that are decreasing over time. These may be underutilized resources.
7. Look for peaks and averages that grow steadily over time. These are
growth areas, requiring either logical or physical changes.
StarKeeper II NMS Graphics System Guide, R10.0, Issue 1
15-9
Using Performance Reporter for Long-Term Traffic Engineering
Network Availability Trunk/Node
1. Run the weekly and monthly tabular Network Utilization reports on a regular basis. Availability is ideally 100%, and small deviations are considered
important.
2. You may want to run the daily version of these reports for new resources or
for resources that are being watched (e.g., a trunk that is unpredictable).
3. Review the reports after they are run. Determine if you want to look at the
detailed information while it is still available; e.g., daily network availability
reports, corresponding alarm reports, user trouble calls. You are looking for
information that could be used to explain why a resource was unavailable.
4. For nodes, the availability represents the availability of the node to the Core
System. A low availability could be the result of Core System trouble, a bad
connection (an interface module or the line) between the node and the
Core System, or a problem with the node itself.
5. For trunks, the availability represents the availability of the trunk, based on
the two trunk modules. A low availability could be the result of either one of
the trunk modules or the facility itself being down.
15-10
StarKeeper II NMS Graphics System Guide, R10.0, Issue 1
Managing Performance Reporter
Files and Requests
0
16
This chapter provides procedures for the maintenance of files and report
requests.
Managing Filed Reports
Performance Reporter allows you to save a report in a file. If you are requesting a
report to be run now and saved in a file, you enter a file name. If you are requesting a report to be run according to a schedule, the Performance Reporter generates a file name automatically when the report runs.
The purpose in filing reports is to make them available for displaying or printing at
a future time. Use the file name or report type and date as a key. For reports that
you have scheduled, there is a retention period and automatic cleanup. See
Chapter 14 for more information on retention periods. You also have the ability to
remove those files manually. Reports that you have requested on-demand must
be deleted manually.
Managing filed reports is the process of accessing, reviewing, and deleting files.
Screen 16-1.
Performance Reporter Control Window
StarKeeper II NMS Graphics System Guide, R10.0, Issue 1
16-1
Managing Performance Reporter Files and Requests
Managing On-demand Filed Reports
On-demand reports can be viewed, printed, renamed, or deleted.
Procedure 16-1.
Managing On-demand Filed Reports
1. At the Performance Reporter Control Window, (Screen 16-1) select List,
Filed Reports, and then On-demand Reports from the sub-menus.
The following scrolling list will be displayed.
Screen 16-2.
On-demand Reports Pop-Up Window
The files are listed with the most recently created files first. DATE and TIME
represent when the file was created, or updated if you overwrote an existing file. SIZE is the number of characters in the file. This number gives you
an idea of the size of the report relative to other reports. FORMAT tells you
whether the report is tabular or graphical. FILE NAME tells you the name of
the file. If there are no files in the scrolling list, the list will be empty and the
message List contains no report files will be displayed.
16-2
StarKeeper II NMS Graphics System Guide, R10.0, Issue 1
Managing Performance Reporter Files and Requests
2. Initially, all buttons are greyed out. When you pick a file(s) the appropriate
buttons become valid. Select which file(s) you want and decide what action
you want to take.
3. Position the pointer on your desired selection and click.
■
Display
You can select a single file to be displayed. Position the pointer on the
report you wish to display and click. Position the pointer on Display and click.
The contents of the report will be displayed in a pop-up window. To display
another report, go back to the previous pop-up window, position the pointer
on the report that is already displayed and click. This will deselect the
report. Position the pointer on the next report you wish to display and click.
Position the pointer on Display and click. The contents of the new report will
be displayed in another pop-up window.
■
Print
You can print multiple files. The files that you selected from the scrolling list
will be highlighted.
■
Rename
You can select only one file at a time to rename. If more than one file is
selected, Rename is greyed out.
Enter the new file name in the text field before you click
Rename
.
If the new file name already exists, the following message will be displayed:
Cannot rename over existing file. You must either delete the
existing file and then reselect the file you wish to rename, or choose
another file name.
■
Delete
You can delete multiple files. A notice window will be displayed prompting
you to confirm the deletion.
You must choose Delete , or
formance Reporter.
Cancel
before you can do anything else in Per-
If you chose Delete , the list is frozen until the deletion(s) have been completed. Once completed, the list is unfrozen and you may scroll through it
again.
■
Cancel
This button is used to dismiss a window.
StarKeeper II NMS Graphics System Guide, R10.0, Issue 1
16-3
Managing Performance Reporter Files and Requests
Managing Scheduled Filed Reports
These are reports that you have scheduled to be run repeatedly. Scheduled
reports are the kind that you will use for management reports or for long-term
engineering. You must access them within the retention interval or else they will
be automatically deleted. Even though these files are deleted automatically, you
have the option to delete them manually.
Scheduled reports can be viewed, printed, or deleted.
Procedure 16-2.
Managing Scheduled Filed Reports
1. At the Performance Reporter Control Window, (Screen 16-1), select List,
Files Reports, and then Scheduled Reports from the sub-menus.
The following scrolling list will be displayed with the default of daily.
Screen 16-3.
Scheduled Reports Pop-Up Window
The files are listed with the most recently created files first. DATE and TIME
represent when the file was created, or updated if you overwrote an existing file. SIZE is the number of characters in the file. This number gives you
16-4
StarKeeper II NMS Graphics System Guide, R10.0, Issue 1
Managing Performance Reporter Files and Requests
an idea of the size of the report relative to other reports. FORMAT tells you
whether the report is tabular or graphical. REPORT TYPE tells you the type
of report. If there are no files in the scrolling list, the list will be empty and
the message List contains no report files will be displayed.
2. There are several buttons at the bottom of the screen. Initially, all buttons
are greyed out. When you pick a file(s) the appropriate buttons become
valid. Select which file(s) you want and decide what action you want to
take. You can: Display , Print , Delete or Cancel a report.
■
Display
You can choose a single file to be displayed. Position the pointer on
the report you wish to display and click. Position the pointer on
Display and click. The contents of the report will be displayed in a
pop-up window. To display another report, go back to the previous
pop-up window, position the pointer on the report that is already displayed and click. This will deselect the report. Position the pointer on
the next report you wish to display and click. Position the pointer on
Display and click. The contents of the new report will be displayed in
another pop-up window.
■
Print
You can print multiple files. The files that you selected from the
scrolling list will be highlighted.
■
Delete
You can delete multiple selections. A notice window will be displayed
prompting you to confirm the deletion.
You must choose Delete or,
in Performance Reporter.
Cancel
before you can do anything else
If you chose Delete , the list is frozen until the deletion(s) have been
completed. Once completed, the list is unfrozen and you may scroll
through it again.
■
Cancel
This button is used to dismiss a window.
Managing Report Requests
The Performance Reporter allows you to run daily, weekly, and monthly reports
according to a schedule. Scheduled reports are used for management reports or
for long-term engineering. For example, you will probably schedule the Network
Availability reports for nodes and trunks to be run at least weekly, if not daily, to
evaluate the level of service that the physical network provides.
StarKeeper II NMS Graphics System Guide, R10.0, Issue 1
16-5
Managing Performance Reporter Files and Requests
The scheduling capability allows you to specify the request once and have the
report run repeatedly. See Chapter 14 for the procedure to schedule reports. The
procedure described below is for managing the schedule requests that you have
already entered. In most cases, you will be fine-tuning the schedule that you have
been running. You have the ability to review what you have scheduled.
You can make changes to the contents of the report as well as to the schedule.
For example, you may find that you want to run reports on different groupings of
resources, or you may find that you’re not getting the right report because you
have specified the wrong report generation time.
When you enter a request for a scheduled report, the default report generation
time is 4 a.m. This allows the daily data to be summarized and it also takes advantage of off-hours processing time. More than one report can be scheduled for the
same time, but it is a good idea to stagger them. Be sure that the date and time
you specify to run them is after all the data is complete but before it is automatically deleted.
Managing report requests is the process of accessing, reviewing, and then making changes to them.
Procedure 16-3.
Managing Report Requests
1. At the Performance Reporter Control Window, (Screen 16-1) select List,
and then Report Requests from the sub-menu.
The following scrolling list will be displayed.
Screen 16-4.
16-6
List Report Requests Pop-Up Window
StarKeeper II NMS Graphics System Guide, R10.0, Issue 1
Managing Performance Reporter Files and Requests
All the report requests are displayed on this list, in order of request date,
beginning with the oldest request. This is the date that the cron was created or last changed. Use the request date, report type, and summary
period information to identify the report request that you’re interested in. If
there are no requests, the scrolling list will be empty and the message
List contains no report requests will be displayed in the footer of
the window.
2. Position the pointer on the item(s) and click.
3. There are four buttons at the bottom of the screen. Initially, the Display and
Delete buttons are greyed out. When you pick a request(s) the appropriate
buttons become valid. Select which request(s) you want and decide what
action you want to take. You can view the full request with the option to
update it or delete the request(s).
4. Position the pointer on the desired button and click.
■
Display
You can choose only one item at a time. This button will bring up a report
request form, with the information you originally entered. There are three
buttons at the bottom of the form, Update , Cancel and Help .
If you are done viewing and do not wish to make any changes, click the
Cancel button. If you wish to make changes to the request, position the
pointer on the field(s) you want to change and enter the changes. Refer to
Procedure 15-1, Requesting Scheduled Reports for information on
changing fields. When you are satisfied with the changes you have made,
choose Update .
You cannot change the Run Report field from scheduled to on-demand. In
order to make that change, you must delete the request and then enter an
on-demand request. Refer to Procedure 14-3, Requesting On-demand
Reports.
NOTE:
Due to the fact that the node list reflects the most current status of
the nodes, the node list may be different from the nodes that you
originally requested. If a node is no longer valid, you will be notified
via a pop-up window and will have the option to delete it.
■
Delete
You can delete multiple selections. The following notice window will be displayed prompting you to confirm the deletion.
You must choose Delete , or
formance Reporter.
Cancel
before you can do anything else in Per-
If you chose Delete , the list is frozen until the deletion(s) have been completed. Once completed, the list is unfrozen and you may scroll through it
again.
StarKeeper II NMS Graphics System Guide, R10.0, Issue 1
16-7
Managing Performance Reporter Files and Requests
16-8
StarKeeper II NMS Graphics System Guide, R10.0, Issue 1
Performance Reporter: Report
Examples and Interpretation
0
17
This chapter contains examples of the tabular and graphical reports that are generated when using Performance Reporter.
NOTE:
The following abbreviations may appear in the output fields of any report
generated using Performance Reporter:
■
N/A - not applicable;
■
UA - unavailable;
■
I - incomplete measurement intervals, the data is suspect as far as
the utilization numbers are concerned. For example, on a daily
report an “I” means a complete hours information is not available,
the time has changed, or the speed of the module has changed
within the hour.
StarKeeper II NMS Graphics System Guide, R10.0, Issue 1
17-1
Performance Reporter: Report Examples and Interpretation
Report Types
The following table lists the reports that are available from Performance Reporter.
All reports are available as tabular reports. Those reports also available as
graphical reports are indicated below.
Table 17-1.
Report Types
Utilization
Type
Request Report
Select Type
Graphical
Report Available
Bandwidth Utilization
Trunk
Trunk Type
Bandwidth Utilization
Trunk
Trunk Name
Yes
Bandwidth Utilization
Trunk
Module Address
Yes
Bandwidth Utilization
Link
Link Type
Bandwidth Utilization
Link
Module Address
Bandwidth Utilization
Node
Detail
Bandwidth Utilization
Node
Summary
Bandwidth Utilization
M1 Shelf
Connection Utilization
Recv Group
Connection Utilization
Trunk Group
Connection Utilization
X25
Connection Utilization
Node
Port Capacity Utilization
Module Type
Port Capacity Utilization
Module Address
Network Availability
Trunk
Network Availability
Node
Module Performance
Module Type
Module Performance
Module Address
Yes
Yes
Tabular reports:
Performance Reporter provides the ability to obtain tabular reports for all reports.
The vertical scroll bar in the tabular report window allows you to scroll through the
report. The Printer Name field displays the default printer in the system. Change
the printer name if you wish. The Save File Name field is for you to enter the file
name if you wish to save the report to a file.
17-2
StarKeeper II NMS Graphics System Guide, R10.0, Issue 1
Performance Reporter: Report Examples and Interpretation
The following buttons are displayed at the bottom of a tabular report:
Save and Cancel .
■
Print
,
Print
This button will send the tabular report to the printer.
■
Save
This button will save the tabular report to a file.
■
Cancel
This button is used to dismiss the tabular report window.
Graphical Reports
Performance Reporter provides the ability to obtain graphical reports for some of
the five report types.
When using graphical reports, Performance Reporter provides the ability to
change the graph type and axis orientation dynamically. You can change the type
of graph from a plotted graph to a bar graph or vice versa by clicking on bar or
plot under the graph types option at the top of the report. Most graphs display
the X-axis horizontally and the Y-axis vertically.
It is often desirable to invert the axis positioning. In a plotted graph, inverting
causes the Y values to be plotted against the horizontal axis, and the X values to
be plotted against the vertical axis. In a bar chart, inverting causes the bars to be
displayed horizontally instead of vertically. You can invert a graph by clicking the
invert option under Axis Orientation at the top of the report.
The following buttons are displayed at the bottom of a graphical report:
Save ,
Next Graph , Previous Graph and Cancel .
■
Print
,
Print
This button will send the graphical report to the printer. Only the graphical
parts of the report will be printed. The printout will display and go to the
system default printer. To change the destination, enter the desired printer
name before you click the Print button.
StarKeeper II NMS Graphics System Guide, R10.0, Issue 1
17-3
Performance Reporter: Report Examples and Interpretation
■
Save
This button will save the graph to a file. Enter the desired file name in the
Save File Name field before clicking the Save button.
Next Graph
■
This option is only active when more than one page of graphs are available.
The next graph will be displayed in the same window.
■
Previous Graph
This option is only active when more than one page of graphs are available.
The previous graph will be displayed in the same window.
■
Cancel
This button is used to dismiss a window.
In the example below, a single trunk’s utilization is shown for both the receive and
transmit directions.
Request Report: Display Report: BandUtil:Trunk
Axis Orientation
Graph Types
Plot
Bar
Invert
TRKHS Util for Trunk: hpe3 Date: 02/20/1998 (daily)
Node1:.....nj/chocolat/hpe.....Mod1:.....3
Utilization
100
80
Node 1 Trn Util
Node 1 Rev Util
60
40
20
0
8
9
10
11
12
13
14
15
16
Hours of Day
Printer Name: laserjust
Print
Screen 17-1.
17-4
Save File Name:
Save
Next Graph
Previous Graph
Cancel
Sample Bandwidth Utilization Link Graphical Report
StarKeeper II NMS Graphics System Guide, R10.0, Issue 1
Performance Reporter: Report Examples and Interpretation
Report Interpretation
0
The Bandwidth Utilization reports show the usage and performance of the link,
trunk, node, or M1 shelf. The key field is %UTIL, which represents how much of
the physical link, trunk, node, or M1 shelf is being used. The %UTIL is the average
utilization of the link, trunk, node, or M1 shelf during the interval. A general guideline is that average utilization should not exceed 70%.
If a value in the %UTIL field cannot be explained by usage or errors, it is possible
that the configuration information was entered incorrectly in the database. The link
report uses the speed of the link from the database in its calculations.
Report Categories
There are five report categories. This section lists and describes each of these
categories. There are daily, weekly, and monthly reports available for all reports
unless otherwise noted.
Bandwidth Utilization
Bandwidth Utilization reports show the utilization of the main physical components
in a network. The main physical components in a network are: nodes, trunks,
links, and shelves. Bandwidth Utilization reports are high-level reports that are run
daily, weekly, and monthly. Error counts are not included in these high-level
reports; they are found in the Module Performance reports.
Bandwidth Utilization reports show how much capacity is being used. Trunk utilization is the usage of facilities between nodes. Link utilization is the usage of facilities between nodes and other products, such as, concentrators, hosts, and
servers. Node utilization is the bandwidth used by the node backplane. M1 shelf
utilization shows the aggregate usage of M1 shelves in BNS-2000 nodes. Usage
is defined as the traffic carried, as a percentage of the shelf capacity.
■
Trunk Utilization Report
These reports identify both ends of the trunk (node name and group), and
show utilization data from both ends.
■
Link Utilization Report
These reports show utilization data for Multipurpose Concentrators, SAMs
and CPMML servers.
StarKeeper II NMS Graphics System Guide, R10.0, Issue 1
17-5
Performance Reporter: Report Examples and Interpretation
■
Bandwidth Utilization Node Report
These reports show the usage of the node’s backplane. Usage is defined
as the number of packets/segments switched across the backplane divided
by the backplane capacity.
There are two levels for Bandwidth Utilization Node reports: Detail and
Summary. The Bandwidth Utilization Node Summary Report shows what
percentage of the backplane is being used, as that indicates how close a
node backplane is to its maximum data transfer rate.
The Node Bandwidth Utilization Detail Report shows the contribution of
each module in the node to the total backplane utilization. This report provides the detail information of the traffic contribution to the BNS-2000 node
backplane. It also shows the percentage of utilization for each of the slots
in the series M2 shelves. This report is used to determine the source of
heavy utilization on a node.
■
Shelf Utilization Report
These reports show the aggregate usage of the M1 shelves on a
BNS-2000 node by displaying the percentage of the M1 shelf that is being
used. The usage is defined as the traffic carried divided by the shelf
capacity.
Connection Utilization
Receiving group and trunk group reports show the utilization of logical components in your network. The logical components are trunk groups and receiving
groups that you have set up to route calls. By looking at the data in these reports,
you can determine if the groups can handle the call traffic effectively, or if the
groups should be reconfigured.
There are two levels of these reports. The summary report shows the channel utilization, call success rate, and a failed call indication. The detail report shows the
breakdown of failed calls listed by cause, such as contention conflict or a security
problem.
X.25 reports show the utilization of X.25 channels that are allocated to X.25 ports.
Using the data in this report, you can determine if the present number of channels
is handling the call traffic effectively. The summary report shows the channel utilization and call success rate. If the call success rate is less than 100% it indicates
that there were failed calls.
Node reports show what percentage of the backplane is being used. Using this
data, you can determine if a node can support additional concentrators or multiplexers.
17-6
StarKeeper II NMS Graphics System Guide, R10.0, Issue 1
Performance Reporter: Report Examples and Interpretation
Port Capacity Utilization
Port Capacity Utilization reports show the port utilization for access modules in
the backplane. Ports in access modules are connected via facilities to other
devices and therefore are similar to other transmission facilities; for example,
trunks and links.
Network Availability
Network Availability reports show the percentage of availability of nodes and
trunks. Availability is calculated from a centralized network management perspective. Both node and trunk availability are based on alarms coming from the node
via the console connection. The percentage is the average daily availability. If the
console connection is down for any reason, the percentage in the report will be
less than 100%.
Module Performance
Lower level reports are available for all types of modules. These reports are used
to troubleshoot specific problems on a module or port that have been identified in
a high level report. The primary information on these reports is error related. The
user can select from module, port, or channel level information, depending on
what they need.
StarKeeper II NMS Graphics System Guide, R10.0, Issue 1
17-7
Performance Reporter: Report Examples and Interpretation
Bandwidth Utilization Reports
Bandwidth Utilization reports show how much capacity is being used. Trunk utilization is the usage of facilities between nodes. Link utilization is the usage of facilities between nodes and other products, such as hosts and servers. Node
utilization is the usage of the node backplane. Shelf utilization is the aggregate
usage of the M1 shelves.
Bandwidth Utilization Trunk Report
These reports identify both ends of the trunk (node name and group), and show
utilization data from both ends.
Screen 17-2.
17-8
Sample Bandwidth Utilization Trunk Report
StarKeeper II NMS Graphics System Guide, R10.0, Issue 1
Performance Reporter: Report Examples and Interpretation
Bandwidth Utilization Link Report
These reports show utilization data for SAMs and CPMML servers.
Screen 17-3.
Sample Bandwidth Utilization Link Report
StarKeeper II NMS Graphics System Guide, R10.0, Issue 1
17-9
Performance Reporter: Report Examples and Interpretation
Bandwidth Utilization Node Report
This report provides the detailed information of the traffic contribution to the
BNS-2000 node backplane. It also shows the percentage of utilization for each of
the slots in all Series M2 shelves. This report is used to determine the source of
heavy utilization on the node.
Screen 17-4.
17-10
Sample Bandwidth Utilization Node Report
StarKeeper II NMS Graphics System Guide, R10.0, Issue 1
Performance Reporter: Report Examples and Interpretation
Bandwidth Utilization Shelf Report
This report shows the aggregate usage of M1 shelves in the BNS-2000 node by
displaying the percentage of the M1 shelf that is being used.
Screen 17-5.
Field Descriptions
Sample Bandwidth Utilization Shelf Report
0
Note that some of the columns have a tiered format; that is, one field of information rests on top of another field in the same column. For example, the third column of the Bandwidth Utilization Link report has LINK TYPE over SPEED, so the
data is in two lines with the link type shown over the link speed of the port. Some
fields are abbreviated to save space so that more information can be incorporated
in the reports. For example, MOD ADDR and MODULE ADDRESS represent the
same fields.
StarKeeper II NMS Graphics System Guide, R10.0, Issue 1
17-11
Performance Reporter: Report Examples and Interpretation
17-12
■
%AVG UTIL - Average utilization. Percentages are on two lines: the first
line is receive and the second line is transmit. For weekly and monthly
reports, these fields represent the average utilization for the entire week or
month.
■
%PEAK UTIL - Peak utilization. Percentages are on two lines: the first line
is receive and the second line is transmit. For weekly and monthly reports,
these fields represent the peak utilization value for the entire week or
month.
■
GROUP NAME - The name of the group for reported connection data.
■
(I) INCOMPLETE INTERVAL - If the database does not represent a full
interval of data, an “I” will be displayed at the far right of the corresponding
interval on the report.
■
INTVL - The start and end time of the report interval.
■
LINK TYPE/ SPEED - The type of link and the link speed (bps).
■
MOD ADDR (MODULE ADDRESS) - The module address.
■
MOD TYPE - The type of module being reported on. Some valid types are
M1 shelf and TRUNK-T3.
■
M1 SHELF NUM - The shelf number for the M1 shelf (the controller resides
in an M1 shelf). There can be up to seven M1 shelves. The M1 shelf number corresponds to the module address for the CIM module in the switching
shelf.
■
M2 SHELF NUM - The shelf number (the switch resides in M2 shelf 0). In
addition, there may be shelves numbered 1, 2, and 3 for a total of up to four
M2 shelves. An M2 shelf can support modules that in total, generate up to
216 Mbps. The sum of M1 shelves and M2 shelves can total up to eight.
■
NAME/TYPE/SPEED - The name of the trunk, its type, and its speed, in
bits per second (bps).
■
NODE NAME - The full path name of the node using the four-level mnemonic/numeric address format.
■
SHELF - A unit that resides in a stackable cabinet. It is a receptacle for
node modules.
■
SHELF SPEED - The speed of the shelf backplane, in megabits per second (Mbps).
■
TYPE & REL./SPEED - The type of the node, the release number of the
node, and the backplane speed in megabits per second (Mbps).
StarKeeper II NMS Graphics System Guide, R10.0, Issue 1
Performance Reporter: Report Examples and Interpretation
Connection Utilization Reports
Connection Utilization reports represent the utilization of logical components in
your network. The logical components are trunk groups and receiving groups that
you have set up to route calls. By looking at the data in these reports, you can
determine if the groups can handle the call traffic effectively, or if the groups
should be reconfigured.
There are two levels of these reports. The summary report shows the channel utilization, call success rate, and a failed call indication. The detail report shows the
breakdown of failed calls listed by cause, such as contention conflict or a security
problem.
StarKeeper II NMS Graphics System Guide, R10.0, Issue 1
17-13
Performance Reporter: Report Examples and Interpretation
Connection Utilization Receiving Group Report
Receiving Group reports show connection data for each specified receiving group
or two-way group.
Screen 17-6.
17-14
Sample Connection Utilization Receiving Group Report Summary
StarKeeper II NMS Graphics System Guide, R10.0, Issue 1
Performance Reporter: Report Examples and Interpretation
Screen 17-7.
Sample Connection Utilization Receiving Group Report Detail
StarKeeper II NMS Graphics System Guide, R10.0, Issue 1
17-15
Performance Reporter: Report Examples and Interpretation
Connection Utilization Trunk Group Report
Trunk Group Reports show connection data for each specified trunk group.
Screen 17-8.
17-16
Sample Connection Utilization Trunk Group Report Summary
StarKeeper II NMS Graphics System Guide, R10.0, Issue 1
Performance Reporter: Report Examples and Interpretation
Connection Utilization X.25 Report
X.25 reports show the utilization of X.25 channels that are allocated to X.25 ports.
Screen 17-9.
Sample Connection Utilization X.25 Report
StarKeeper II NMS Graphics System Guide, R10.0, Issue 1
17-17
Performance Reporter: Report Examples and Interpretation
Connection Utilization Node Report
Node reports show what percentage of the backplane is being used. Using this
data, you can determine if a node can support additional concentrators or multiplexers.
Screen 17-10.
Field Descriptions
17-18
Sample Connection Utilization Node Report - Summary
0
■
%CHAN UTIL - The percentage of channels in a group that are used,
divided by those actually available.
■
%CONNECT SUCCESS - The total number of successful connection
attempts during the reporting interval.
■
%PORT UTIL - The percentage of ports in a group that are used, divided
by those actually available.
StarKeeper II NMS Graphics System Guide, R10.0, Issue 1
Performance Reporter: Report Examples and Interpretation
■
AVERAGE CONNECT - The average number of simultaneous calls.
■
CHAN ALLOC - The total number of channels that were allocated or configured in this group.
■
CONNECT ATTEMPTS - The total number of attempts to create a new
connection into this group during the reporting interval.
■
CONTENTION - The number of unsuccessful connection attempts due to
contention.
■
GROUP NAME - The name of the receiving or two-way group for the
reported connection data.
■
INTVL - The start and end time of the report interval.
■
MOD ADDR - The module address.
■
NODE NAME - The full node name is listed here, using the four-level mnemonic/numeric address format.
■
OTHER - The number of unsuccessful connection attempts due to reasons
other than those given above. For example, the service name accessing
this group is out of service, or the host has crashed.
■
PEAK CONN - The maximum number of simultaneous connections
(incoming and outgoing, switched and non-switched) that occurred during
the report interval.
■
PORT ALLOC - The total number of ports that were allocated or configured
in this group.
■
SECURITY - The number of unsuccessful connection attempts due to
closed user group security.
■
TOTAL FAILURES - The total number of unsuccessful connection attempts
due to contention (no free ports into this group) problems, security problems, and other problems. It is the sum of FAILS CONT, FAILS SEC, and
FAILS OTHER, defined below.
Report Interpretation
0
You want to determine if the receiving and trunk groups are set up in the node in
an optimal way; that is, to see if the number of ports assigned to a group is optimal. High values in the FAILS CONT field indicates that not enough ports were
assigned to that group. There may be accompanying response time delays as the
number of call attempts may be higher along with the number of failures due to
contention. All failed connection attempts are reported. FAILS SEC must be monitored to determine whether attempts to breach network security are being made.
StarKeeper II NMS Graphics System Guide, R10.0, Issue 1
17-19
Performance Reporter: Report Examples and Interpretation
Port Capacity Utilization Reports
Port Capacity Utilization reports show the port utilization for access modules in
the node backplane. Ports in access modules are connected via facilities to other
devices and therefore are similar to other transmission facilities; for example,
trunks and links.
Port Capacity Utilization reports for other module types may look different, however, all field description definitions are applicable.
Frame Relay Report
This report provides usage data for the node’s frame relay port.
Screen 17-11.
17-20
Sample Port Capacity Utilization Frame Relay Report
StarKeeper II NMS Graphics System Guide, R10.0, Issue 1
Performance Reporter: Report Examples and Interpretation
Field Descriptions
0
Note that in some reports like an Access Interface (AI) report, there are two sets
of data information in the same column. The AI report, for example has a column
that displays the SPEED and the SIR data in both receive and transmit directions.
The SIR data for receive and transmit directions are enclosed in parentheses.
■
%AVG LINE UTIL - The average percent utilization of the line over the
measurement interval. The percentage is calculated by dividing the message units by the full capacity of the line.
■
%AVG UTIL - The average percent utilization of the port over the measurement interval. The percentage is calculated by dividing the message units
received by the full capacity of the line during the reporting interval.
■
%PEAK LINE UTIL - The largest percent utilization encountered on the line
during the measurement interval.
■
%PEAK UTIL - The largest percent utilization encountered on the line during the measurement interval.
■
%PORT UTIL - The percentages equivalents of the characters received
and transmitted divided by the line capacity, during the interval.
■
AVG FRAME SIZE - Transmit (to line) and receive (from line) average
frame size.
■
AI TYPE - There are two different types. One is the T1 AI and the other is
the T3 AI. The T1 AI has four ports and the T3 AI has only one port. The T3
AIs have class 2 and class 5.
■
DATA BYTES - The total bytes which includes all overhead.
■
DUPLEX - The value either half or full.
■
FRAME BYTES - The total number of bytes in level 2 frames received from
and transmitted to the port.
■
INTVL - The start and end time of the report interval.
■
L2_PDU - The SIP level 2 protocol data entity.
■
L3_PDU - The SIP level 3 protocol data entity. It is made up of one or more
L2_PDUs.
■
MOD ADDR - The module address is on the first line and the port address
is on the second line. If the module is in a concentrator, the module
address will be two levels; for example, 12/4.
■
NODE NAME - The full path name of the node, using the four-level mnemonic/numeric address format.
■
SIR - Sustained Information Rate. SIR is the effective speed of the user
data.
StarKeeper II NMS Graphics System Guide, R10.0, Issue 1
17-21
Performance Reporter: Report Examples and Interpretation
17-22
■
SPEED - The speed (bps) for which this port was configured; not necessarily the speed at which it is running.
■
TOTAL BYTES - The total number of bytes transmitted to and received
from the external host or device.
■
TOTAL FRAMES - The total frames received from and transmitted to the
port.
■
TYPE - The service type. Indicates host (h) or pdn (p) port.
■
USER BYTES - The total user data bytes received from and transmitted to
the port.
StarKeeper II NMS Graphics System Guide, R10.0, Issue 1
Performance Reporter: Report Examples and Interpretation
0
Graphical Option
You can obtain a graphical output report if you requested a single access module
by module address (with the exception of AI). The graphs will represent the ports
in that module. You will get a separate graph for each port.
The lines display the average utilization in the receive and transmit directions for
all the ports for which there is data. The threshold will be marked by a horizontal
line.
Request Report: Display Report: PortCapUtil
Axis Orientation
Graph Types
Plot
Bar
Invert
FRM Port Util for Date: 06/20/1995 (daily)
Node: drv/bns3–0......Module: 29.1
Utilization
100
80
Transmit Util
Receive Util
60
40
20
0
8
9
10
11
12
13
14
15
16
17
Hours of Day
Printer Name: laserjust
Print
Save File Name:
Save
Screen 17-12.
Report Interpretation
Next Graph
Previous Graph
Cancel
Sample Port Capacity Utilization Frame Relay Graphical
Report
0
The Port Capacity Utilization report shows the usage and performance of the
ports in relation to the user endpoints, which helps to identify and troubleshoot line
problems. A line problem can be caused by a faulty transmission facility (for example a wire). It can also be caused by too much traffic coming in from all ports on
that module or by administering the wrong port speed in the database.
StarKeeper II NMS Graphics System Guide, R10.0, Issue 1
17-23
Performance Reporter: Report Examples and Interpretation
The key field in this report is the %UTIL for the port. Port utilization is similar to
trunk utilization. The port utilization is the average value for that interval, and it is
calculated by dividing the traffic by the capacity. Some reports, like AI reports,
show both average and peak utilization in the receive and transmit direction. A
general guideline is that average port utilization should not exceed 70%, not
because of the port itself but because of the transmission facility to which it is connected.
17-24
StarKeeper II NMS Graphics System Guide, R10.0, Issue 1
Performance Reporter: Report Examples and Interpretation
Network Availability Reports
Network Availability reports show the percentage of availability of nodes and
trunks. Availability is calculated from a centralized network management
perspective. Both node and trunk availability are based on alarms coming from
the node via the console connection. The percentage is the average daily
availability.
This report is divided into two sub-reports: the Node Availability Report and the
Trunk Network Availability Report. Together they give the administrator a broad
overview of network availability. The most significant item is the percent availability
of the node and the trunk.
Network Availability Node Report
Screen 17-13.
Sample Network Availability Node Report
StarKeeper II NMS Graphics System Guide, R10.0, Issue 1
17-25
Performance Reporter: Report Examples and Interpretation
Network Availability Trunk Report
Screen 17-14.
Field Descriptions
17-26
Sample Network Availability Trunk Report
0
■
Y - The percent availability of a node or trunk to the Core System; it is measured by the proportion of time a connection can be maintained between
the Core System and that node or trunk.
■
NODE - The name of the node being reported on, in the four-level mnemonic/numeric address format.
■
NODE1 - The full name of one of this trunk’s end nodes.
■
NODE2 - The full name of the other end node for this trunk.
■
TRUNK NAME - The name of the trunk being reported on.
■
TRUNK TYPE - The type of trunk being reported on.
StarKeeper II NMS Graphics System Guide, R10.0, Issue 1
Performance Reporter: Report Examples and Interpretation
Report Interpretation
0
For nodes, look for low availability percentages and consider expanding the facilities of those nodes. For trunks, look for low availability percentages and consider
upgrading the trunk type, or adding and/or rerouting nodes. Perhaps low percentages are caused by equipment failures.
An availability percentage of 75% means a downtime of 25%. Node downtime is
the time the node is not available to the Core System because it is disconnected
or made inactive (using the cfchange command). Trunk downtime is the time the
trunk is down during the corresponding node connect time.
StarKeeper II NMS Graphics System Guide, R10.0, Issue 1
17-27
Performance Reporter: Report Examples and Interpretation
Module Performance Reports
These reports are used to troubleshoot specific problems on a module or port that
have been identified in a high level report. The primary information on these
reports is error related. Module Performance Reports cover all types of modules
that are supported on the node.
Module Performance Frame Relay Report
This report provides performance information for the node’s Frame Relay modules. An example of the report is shown below.
Screen 17-15.
17-28
Sample Module Performance Frame Relay Report
StarKeeper II NMS Graphics System Guide, R10.0, Issue 1
Performance Reporter: Report Examples and Interpretation
Field Descriptions
0
Note that in some reports like an Access Interface (AI) report, there are two sets
of data information in the same column. The AIT3P report, for example, has a column that displays the SPEED and the SIR data in both receive and transmit directions. The SIR data for receive and transmit directions are enclosed in
parentheses. Also, some fields are abbreviated to save space so that more information can be incorporated in the reports. For example, MOD ADDR and MODULE ADDRESS represent the same fields.
A GAR module takes a group-addressed PDU and resolves it into its remote
members (outside the network). The Module Performance Report for GAR
includes columns that have both pre-resolution and post-resolution data. Pre-resolution data is the data coming into the GAR. Post-resolution data is the resolved
data coming out of the GAR.
■
%AVG BUFFER UTIL (%AVG BUFF UTIL) - The average percentage utilization of the available buffer.
■
%AVG CPU UTIL - The average percentage of CPU utilization.
■
%AVG MAIN PROC BUSY (%AVG M PROC BUSY) - The average percent
utilization of the main processors on the frame relay module over the measurement interval.
■
%BUSY - The percentage of time the module was busy, averaged over the
interval.
■
%EFS - The percentage of error free seconds for the full line in both directions.
■
%EFT - The percentage of error free transmission data.
■
%I/O BD UTIL - Percent channel input/output utilization.
■
%OVERHEAD - The percentage of the bytes considered as overhead
transmitted or received.
■
%PEAK CPU UTIL - The peak percent of CPU utilization.
■
%PEAK MAIN PROC BUSY (%PEAK M PROC BUSY) - The peak percent
utilization of the main processors on the frame relay module over the measurement interval.
■
ABNORMAL TERM - The number of abnormal terminations of transmission.
■
ABORTS - The number of frames discarded by the node due to receiving
an abort sequence from the port. It represents the total number of frames
discarded from all aborts in the interval for this port.
■
AI TYPE - There are several different types.
■
AIS SECS - A count of seconds AIS was active.
StarKeeper II NMS Graphics System Guide, R10.0, Issue 1
17-29
Performance Reporter: Report Examples and Interpretation
17-30
■
BAD CRC - The number of frames received with CRC errors.
■
BAD FCS - The number of frame check sequence errors detected on
frames received.
■
BAD FRAMES - The number of faulty frames received.
■
BER6 SECS - The number of seconds with more than two CRC errors
(BER 10e-6).
■
BP PARITY ERROR - The number of times that a backplane parity error is
detected within the measurement interval period.
■
BUFFER NOT AVAIL (BUFF NOT AVAIL) - The number of times a request
for buffers was made and none were available.
■
CALLS ABN TERM - The number of calls abnormally terminated.
■
CARRIER COUNT - Count of DCD or CTS lead state changes.
■
CHANNEL ERROR - The total number of backplane packets discarded due
to a channel error.
■
CODE VIOL - The number of occurrences of CRC errors.
■
CRC ERROR (CRC ERR) - The number of CRC errors found in the data
received within the time interval.
■
DATA BYTES - The total bytes which includes all overhead.
■
DLCI ADDR - The Data Link Connection Identifier address.
■
ERR SECS (ERRD SECS) - The total number of any second with at least
one code violation. There are two ERR SECS: one for receive CRC-6
errors and one derived from PRMs.
■
ERROR INTVLS - The number of intervals the device received a block (a
subset of packets) from the node that contained an error.
■
FIFO INTRPT - The number of FIFO synchronization errors.
■
FIFO OVRFLW - The buffer overflow errors in both directions. This can
happen when data is coming in to fast or leaving to fast.
■
FRAME BYTES - The total number of bytes in level 2 frames received from
and transmitted to the port.
■
FRAME ERROR (FRAME ERRS) - The count of a frame code violation at
the near end (local) or far end (remote).
■
FRAMES - The total number of frames received from and transmitted to the
port/module.
■
FRAMES DISCARDED (FRAMES DISCRD) - The number of frames to or
from the node that were discarded due to congestion or unavailable buffers.
■
FRM FMT - The framing format. Valid formats are efs or d4.
StarKeeper II NMS Graphics System Guide, R10.0, Issue 1
Performance Reporter: Report Examples and Interpretation
■
INTRPTS - The number of half FIFO interrupts (X.75 module).
■
INTVL - Start and end time of the reporting interval.
■
K BYTES DROPPED - The number of receive bytes and transmit bytes (in
thousands) dropped due to congestion.
■
K LINE SEGMENTS - The bytes multiplied by 57.9 bytes-per-segment for
T1 modules, the bytes multiplied by 58.25 bytes-per-segment for T3 (and
GAR) modules, the bytes multiplied by 60.8 bytes-per-segment for E1 modules, and the bytes multiplied by 59.7 bytes-per-segment for E3 modules.
This value is given in thousands.
■
L-F ERR - The number of link frame errors.
■
LCODE VIOL - A count of bipolar violations.
■
LINE ERRD SECS (LINE ERR SECS) - Any second with at least one line
code violation.
■
LINE SEVR ERRD SECS - Any second with 16 or more line code violations
monitored at the T1 rate.
■
LINK TYPE - The type of device supplying the measurement data.
■
L2_PDU - The SIP level 2 protocol data entity.
■
L3_PDU - The SIP level 3 protocol data entity. It is made up of one or more
L2_PDUs.
■
MAX %MID USED - The count (in percentages) of the maximum number of
MIDs used on the trunk at any one instant during the interval.
■
MOD ADDR (MODULE ADDRESS) - The module (slot number) being
reported on.
■
MOD TYPE (TYPE) - The type of device that is providing the service.
■
NAME - The trunk being reported on.
■
NODE NAME - The node being reported on, using the four-level mnemonic/numeric address format.
■
NON-CIR K BYTES - The number of non-CIR bytes (in thousands)
received from and transmitted to the port/module.
■
NON-CIR K BYTES DROPPED - The number of non-CIR receive bytes
and transmit bytes (in thousands) dropped due to congestion.
■
OVRFLW - The overflow error during the measurement interval.
■
PACKETS - The total number of packets coming in or going out of the module to the backplane. It is the sum of in-service packet counts.
■
PARITY ERROR - The number of times a fiber protocol violation (this
includes parity errors, coding violations, CRC errors, and incorrect protocol
flags) is found in data received from the remote end within the time interval.
StarKeeper II NMS Graphics System Guide, R10.0, Issue 1
17-31
Performance Reporter: Report Examples and Interpretation
17-32
■
PEAK CIR ALLOCATED - The peak CIR allocated during the interval.
■
PEAK K BYTES - The peak number of bytes (in thousands) received from
and transmitted to the port/module.
■
RCVR ABORTS - The number of frames discarded by the node due to
receiving an abort sequence from the port. It represents the total number of
frames discarded from all aborts in the interval for this port.
■
RCVR OVRNS (RCVR OVRUN) - The number of receiver overruns that
occurred on the port/module. This occurs when frames are being received
faster than can be stored and forwarded.
■
REJ FRAMES - The number of transmitted/received “Rejected” frames. A
rejected frame is used by an X.75 module to request retransmission of I
frames starting with the frame numbered N(R). I frames numbered [N(R)-1]
and below are acknowledged.
■
REJCTS - The number of rejects received indicating bad data received at
the other end of the virtual circuit. The number of rejects sent to the remote
port, indicating bad data was received and discarded or data was missing
or out of sequence.
■
RETRANS INTVLS - The number of intervals in which data blocks required
retransmissions from the specified device.
■
RNR (Received Not Ready) FRAMES - The number of transmitted/
received RNR frames. RNR frames are used by an X.75 module to indicate
a busy condition; i.e. the temporary inability to accept additional incoming I
frames.
■
SEVR ERRD SECS - Any second with 15 or more code violations monitored at the T1 rate.
■
SEVR ERRD FRM SECS - A count of one second intervals containing one
or more Severely Errored Framing (SEF) events. A SEF event is declared
when 2 or more framing bit errors occur within a 3 millisecond period, or 2
or more errors out of 5 or less consecutive framing bits occur.
■
SIR - Sustained Information Rate. SIR is the effective speed of the user
data.
■
SPEED - The speed for which the port/module was configured. This is
shown in bits per second (bps) unless the heading unless the heading indicates megabits per second (Mbps).
■
STATUS QUEUE OVRFLW - The number of times a SAM status queue
overflow was detected.
■
SYNC LOST - The count of the number of times synchronization was lost
on the lines. These errors can occur at the local or the remote end.
■
TOTAL BYTES - The total number of bytes received from and transmitted
to the port/module.
StarKeeper II NMS Graphics System Guide, R10.0, Issue 1
Performance Reporter: Report Examples and Interpretation
■
TOTAL FRAMES - The total number of frames received from and transmitted to the port/module.
■
TOTAL K BYTES - The total number of bytes (in thousands) received from
and transmitted to the port/module.
■
TOTAL PACKETS - The total number of packets received from and transmitted to the port/module.
■
TOTAL TRANS UNDRUN - The number of frames aborted.
■
TRAFFIC INTVLS - The number of intervals in which one or more characters of traffic traveled to or from the node or to or from the port.
■
TYPE - The type of device that is providing the service.
■
UNAVL SECS - A count of seconds during which the DS1 service is
unavailable. Service becomes unavailable at the declaration of a transmission failure condition.
■
USART ERR INTVLS - The number of intervals in which USART associated with the specified port had either an overflow, parity, or framing error.
■
USER BYTES - The total user data bytes received and transmitted.
Report Interpretation
0
These reports provide information to assist in maximizing network efficiency. Information on usage and data loss is provided. The reports are module specific and
provide appropriate measurement data for the type of module specified. Where
applicable, module level and port level data are supplied.
The Module Performance Frame Relay Report provides data that assists in the
evaluation of actual usage. This data can be compared to the port capacity and
information on three types of data loss that the Frame Relay port may be experiencing. Incidents of transmission delay, congestion, and data loss can be determined from this data, and the source identified.
StarKeeper II NMS Graphics System Guide, R10.0, Issue 1
17-33
Performance Reporter: Report Examples and Interpretation
17-34
StarKeeper II NMS Graphics System Guide, R10.0, Issue 1
Manual Pages
A
This section provides manual pages for several commands for the StarKeeper II
NMS Graphics System.
StarKeeper II NMS Graphics System Guide, R10.0, Issue 1
A-1
Manual Pages
DISPLAY(1)
NAME
Display - list the installed Graphics System software packages
SYNOPSIS
Display [-g] [-i] [-l [-r<release>] ]
DESCRIPTION
The Display command lists the Graphics System software packages that have
been installed on the machine.
Specify -g for a list of Graphics System applications currently in use.
Specify -i for a list of installed software packages.
Specify -l for a list of licensed software packages. The -r option can be used with
the -l option to specify a specific release, like 7.0 or all for all releases. If the -r
option is not used, the command will default to the current release.
EXAMPLES
Display -g
Display -i
Display -l
Display -l -r7.0
A-2
StarKeeper II NMS Graphics System Guide, R10.0, Issue 1
Manual Pages
EDIT_FILTER(1)
NAME
edit_filter - edit the filter names specification file
SYNOPSIS
edit_filter
DESCRIPTION
The edit_filter command allows a Network Monitor user to edit the filters file and
specify positive and negative filter names for StarKeeper II NMS Core Systems
which are connected to the Graphics System.
Once executed from an xterm window, the following is displayed:
Hit return to edit filter name file ’/usr2/NM/lib/filters’
or DEL to cancel...
The above prompt assumes that Network Monitor is installed in the /usr2/NM
directory.
FILES
$NM_ROOT/lib/filters
EXAMPLES
edit_filter
SEE ALSO
filter_sync(1)
NOTES
The edit_filter command resides in the $NM_BIN directory. The edit_filter
command uses the vi editor as it’s default editor. You may change the default
editor by defining a different editor, e.g., emacs, by setting the environment
variable EDITOR as follows:
EDITOR=emacs; export EDITOR
Make sure the editor is in your $PATH.
StarKeeper II NMS Graphics System Guide, R10.0, Issue 1
A-3
Manual Pages
FILTER_SYNC(1)
NAME
filter_sync - make a set of filters active for a Graphics System
SYNOPSIS
filter_sync
DESCRIPTION
The filter_sync command restarts the Network Monitor Alarm Collector process
causing it to re-read the set of filter names from the $NM_ROOT/lib/filters file. This
makes the filters active for a Graphics System.
FILES
$NM_ROOT/lib/filters
EXAMPLES
filter_sync
CAVEATS
The user should bring down Network Monitor before issuing this command. If
Network Monitor is still running, the View Network Status process will be
terminated. After the filter_sync command has executed successfully, you may
restart Network Monitor.
SEE ALSO
edit_filter (1)
NOTES
The edit_filter command resides in the $NM_BIN directory.
A-4
StarKeeper II NMS Graphics System Guide, R10.0, Issue 1
Manual Pages
REMOVE(1)
NAME
Remove - remove an installed Graphics System software package
SYNOPSIS
Remove
DESCRIPTION
The Remove command lists the Graphics System software packages that have
been installed on the machine and prompts for a selection. Remove will then
remove the selected package from the machine.
This command may be found in $AP_ROOT/bin. The default for AP_ROOT is
/usr2/AP; the actual value of AP_ROOT may be determined by displaying the contents of /usr/share/lib/pub/AP_ROOT file.
You must have root permission to run this command (i.e. log in as root or su to
root before running this command).
Note that you do not have to remove a package in order to upgrade. Instead, simply install the upgrade, which will replace the old package. The only reason that
you must remove a package before re-installing it is if you want to change the
base directory under which the package is installed.
StarKeeper II NMS Graphics System Guide, R10.0, Issue 1
A-5
Manual Pages
STARTWS(1)
NAME
startws - start the Graphics System software
SYNOPSIS
startws
DESCRIPTION
startws first ensures that the user has Workstation Administrator permissions.
startws then checks that the Graphics System software is not already running. It
then creates the necessary run-time environment and executes the Graphics System daemon process ap_mon, which starts all other Graphics System daemon
processes and also establishes StarKeeper II NMS connections.
OUTPUT
If the user does not have Workstation Administrator permissions, startws will print
the following message:
You must have administrative permissions to run this command.
If the Graphics System software is already running, startws will print the following
message:
StarKeeper II NMS Workstation Software is already running.
Execute "stopws" to terminate the StarKeeper II NMS Workstation Software.
If the ap_mon process has trouble initializing the system, appropriate diagnostic
error messages will be printed.
A-6
StarKeeper II NMS Graphics System Guide, R10.0, Issue 1
Manual Pages
STOPWS(1)
NAME
stopws - stop the Graphics System software
SYNOPSIS
stopws [-k]
DESCRIPTION
stopws first ensures that the user has Workstation Administrator permissions.
stopws then checks that the Graphics System software is running. Finally, it
sends a terminate message to the ap_mon process, which terminates the StarKeeper II NMS connections and Graphics System deamon processes.
Use the -k option to kill all non-deamon Graphics System processes on a Graphics System.
OUTPUT
If the user does not have Workstation Administrator permissions, stopws will print
the following message:
You must have administrative permission to run this command.
If the Graphics System software is not running, stopws will print the following
diagnostic message:
StarKeeper II NMS Workstation Software has already been
stopped.
StarKeeper II NMS Graphics System Guide, R10.0, Issue 1
A-7
Manual Pages
A-8
StarKeeper II NMS Graphics System Guide, R10.0, Issue 1
Graphics System Platform Error
Messages
B
This section contains a listing of possible Graphics System Platform error
messages and provides
■
Error message number
■
Explanation of the message
■
Recovery procedures to clear the message
2
The contents of the form could not be written out to disk, and therefore, a
permanent record of changes could not be made. The probable cause is
insufficient disk space. Clean up old and unwanted files in your home directory.
3
The program could not locate or could not load the necessary preference
files in your home directory. The file(s) may be missing or corrupted in some
way. It is recommended that you add yourself again as a Graphics System
Platform user via the adduser command. You need root permissions to run
this command. Contact your Workstation Administrator for assistance if you
do not have root permissions.
4
The program could not locate or could not load the necessary factory settings files in the $AP_ROOT/etc/env directory. The file(s) may be missing or
corrupted in some way. Reinstallation of the Graphics System Platform may
be required. Contact your support organization for recovery assistance.
9
The Graphics System Platform is currently controlling the maximum number
of applications it was designed to manage. You may wish to terminate an
application for which you no longer have immediate use in order to bring up
the desired application.
StarKeeper II NMS Graphics System Guide, R10.0, Issue 1
B-1
Graphics System Platform Error Messages
B-2
10
The Graphics System Platform could not allocate the required system
resources to attempt execution of the desired application. This is due to
excessive demands made of the system, and may be attributed to any
graphics applications you are currently running. Try again later, or attempt to
reduce system load by terminating applications or programs that are no
longer needed.
11
The Graphics System Platform could not execute the desired program. This
is due to excessive demands made of the system, and may be attributed to
any graphics applications you are currently running. Try again later, or
attempt to reduce system load by terminating applications or programs that
are no longer needed.
15
The chosen application failed to start up properly. The probable causes
include (1) you are not authorized to run the desired application, (2) your
environment is not set properly to run the desired application, and (3) the
application is already in use by someone else and does not support multiple
simultaneous users.
20
Both the machine name and dialstring are required to form a valid Computer
entry. Confirm that you have entered both before applying your changes.
27
The connection cannot be established to the desired computer. If you added
the computer yourself via the Add-On Computers Window, you may have
made an error in the dialstring, or you may have incorrectly specified the
connection type. Be sure the dialstring is spelled correctly and that you have
correctly specified the connection type. The most probable cause is that the
computer is indeed unavailable. Check with the Workstation Administrator of
the specific computer for information on system availability.
28
The character ":" should not be entered in text fields, as this may be misinterpreted by the Graphics System Platform software as a field separator.
29
Both the pathname of the target file or directory and age must be specified
before applying your changes.
30
The pathname of the target file or directory contains an environment variable
(for example, a token preceded by the character "$") that is not defined. Be
sure the spelling of the environment variable is correct.
31
The pathname of the target file or directory does not exist. You must re-enter
a valid pathname.
32
The specified path refers to a directory, not a file as expected. Double check
the Path and Type settings on the Disk Cleaner Administration Window for
correctness and consistency.
StarKeeper II NMS Graphics System Guide, R10.0, Issue 1
Graphics System Platform Error Messages
33
The specified path refers to a file, not a directory as expected. Double check
the Path and Type settings on the Disk Cleaner Administration Window for
correctness and consistency.
36
The path cannot be cleaned as directed. Verify that the permissions on the
directory and the files contained therein are readable and writable.
37
The Reset failed because the connection data is missing or corrupted. It is
recommended that you add yourself again as a Workstation Administration
user via the adduser command. This re-initializes the application and
related connection tables. You need root permissions to run this command.
Contact your Workstation Administrator for assistance if you do not have root
permissions.
38
Valid unames consist of no more than 8 characters, with no slash (/) characters.
39
Valid machine IDs consist of whole numbers in the range of 1 and 100, inclusive.
40
Valid addresses consist of no more than four slash (/) characters separated
levels, with no more than 8 characters per level.
41
A given uname can appear only once in the uname list. Re-enter a unique
uname.
42
The computer cannot allocate memory. This is due to excessive resource
demands, and may be attributed to any graphics applications you are currently running. Attempt to reduce system load by terminating applications or
programs that are no longer needed.
45
Pathname is already entered. Enter a unique pathname.
47
No connections are entered. Enter connections to desired Core Systems.
These connections are needed so that the Graphics System applications
can obtain node data.
51
Only one empty entry is allowed. Fill in the empty entry before attempting to
insert another.
52
Maximum number of connections has been reached. Delete unneeded connections to make room for new ones.
53
There is no response from the monitor. Wait a few minutes and try the execution again. If you still have problems, restart the Graphics System.
StarKeeper II NMS Graphics System Guide, R10.0, Issue 1
B-3
Graphics System Platform Error Messages
B-4
StarKeeper II NMS Graphics System Guide, R10.0, Issue 1
Network Monitor Error Messages
C
This section lists the set of error messages that may occur when the Network
Monitor application is used and recommends what action to take should any error
occur.
How to Read the Error Messages
Some of the following error messages have these conventions included in the text:
■
<name>
■
tag=<hex number>
■
<number>
<name>
is variable text information; for example, the name of a
process.
tag=<hex number>
is variable hexadecimal number information that
represents an internal number associated with a process.
<number>
is variable error code information that usually represents a
specific HP-UX system error. A table of HP-UX system
error codes and their meaning is included at the end of this
section.
Error messages in this section are grouped according to which window or process
displayed the error message. The messages within a group are listed
alphabetically. Following each message is a recommended action number. Use
the number to find the recommended action text in Table D-2 of this section.
StarKeeper II NMS Graphics System Guide, R10.0, Issue 1
C-1
Network Monitor Error Messages
How Error Messages Are Displayed
The following sections discuss how and where specific error messages are
displayed.
Notice Windows
Error messages may appear in notice windows. These windows remain on the
screen until you dismiss them.
Bulletin Board
Some error messages, especially those from background processes, are sent to
the Bulletin Board. When a Bulletin Board message is received, an icon appears
in a window and the terminal will beep. Click on the icon in the Bulletin Board to
display the message(s) in a popup window.
System EVENTLOG
All error messages are also sent to the Graphics System's EVENTLOG. This is a
file that resides in the $EVENTLOG directory. A new EVENTLOG file is created
every day and also every time the Graphics System software is re-started. All
Core System applications and the Graphics System software write messages into
the $EVENTLOG file. When errors occur, you may want to view the EVENTLOG
to see if additional messages were received from other processes.
$EVENTLOG is a variable that is defined for all users who have been authorized
to use the Graphics System software.
Network Monitor Processes
In the EVENTLOG, all messages are preceded by the date and time of the
message as well as the name of the process that sent the message. The following
table relates the Network Monitor window names, process names, and process
descriptions in the order they are presented.
C-2
StarKeeper II NMS Graphics System Guide, R10.0, Issue 1
Network Monitor Error Messages
Table C-1.
Network Monitor Processes
Window
Process Name
Process Description
Control
nm_con
The first Network Monitor window to appear
after starting the Network Monitor application.
Network
Status and
Network Map
nm_stat
View Network Status
The
task. All map
windows and the status window belong to one
nm_stat process.
List Alarms
nm_al
List alarms in a textual format. There is one
nm_al process for each List Alarms Window.
Diagnostics
nm_diag
Issue commands to nodes. There is one
nm_diag process for each Diagnostics
Window.
Display Info
nm_di
Display information about the selected map
object. There is one nm_di process for each
Display Info Window.
Edit Maps
nm_edit
Create and/or edit network maps.
—
nm_ac
The Alarm Collector daemon process that is in
constant communication with all Core Systems
to receive outstanding alarms and alarm
cleared messages. nm_ac is active whenever
the Graphics System software is running.
—
nm_clear
The Clear Alarms daemon process which
sends clear alarms messages to the
appropriate Core System(s). nm_clear is active
whenever the Graphics System software is
running.
—
nm_map_gen
The Shelf Map Generation process that uses
the Core System configuration databases to
create shelf maps.
StarKeeper II NMS Graphics System Guide, R10.0, Issue 1
C-3
Network Monitor Error Messages
Recommended Actions
The following table of recommended actions covers all of the error messages,
which are listed later in this section.
Table C-2.
Recommended Actions
Recommended
Action
Number
Recommended Action Description
RA1
A HP-UX system error has occurred. This might be a transient problem.
Try again. If the problems persists, log off and then log on again. You
may need to reboot your Graphics System. Contact your support
organization.
RA2
There are too many processes running, or insufficient resources to
execute additional processes. Try again later, or attempt to reduce the
system load by terminating non-essential programs.
RA3
Communications to a Core System have failed or there was an internal
communications error. Check to see if the logical connection between the
Graphics System and the named Core System is established. If the
connection is established, see RA12.
RA4
The configuration data for the named equipment was not found in the
Core System database. Use the cfenter command as described in the
StarKeeper II NMS Core System Guide. Use the skload command to
load module information in the Core System database.
RA5
The communications software probably is not running. It should restart
automatically. Try again in a few minutes. If the problem persists, either
the Graphics System software or the Core System should be restarted.
RA6
dbserver, the configuration database server on the Core System, cannot
be accessed and probably is not running. It should restart automatically.
Try again after a few minutes. If the problem persists, the Core System
should be restarted.
RA7
tmserver, the server responsible for process execution, is not running. It
should restart automatically. Try again after a few minutes. If the problem
persists, restart the Graphics System software using the stopws and
startws commands.
RA8
The Network Monitor Alarm Collector daemon process is not running or
is busy. If it is not running, it should be restarted automatically within a
couple of minutes. Try again later. Use the HP-UX system command
ps -ef | grep nm_ac to determine if the process is running. If the problem
persists, restart the Graphics System software using the stopws and
startws commands.
C-4
StarKeeper II NMS Graphics System Guide, R10.0, Issue 1
Network Monitor Error Messages
Table C-2.
Recommended Actions—Continued
Recommended
Action
Number
Recommended Action Description
RA9
The Network Monitor Clear Alarms daemon process is not running or is
busy. If it is not running, it should be restarted automatically within a
couple of minutes. Try again later. Use the HP-UX system command
ps -ef | grep nm_clear to determine if the process is running. If the
problem persists, restart the Graphics System software using the stopws
and startws commands.
RA10
The Network Status and Network Map Window process nm_stat is not
running or is busy. Use the View Network Status option on the Monitor
menu of the Network Monitor Control Window to restart the process.
RA11
The alarms server on a Core System is not running or communications to
a Core System may have failed. Verify that the Graphics System can
communicate with a Core System. The alarms server should restart
automatically in a couple of minutes. Try again later. If the problem
persists, restart the Core System.
RA12
An internal communications error has occurred. This may be a transient
problem. If it persists, restart the process reporting the error or restart the
Graphics System software using the stopws and startws commands.
RA13
An internal error has occurred in the Network Monitor application. Try
again. If the problem persists, quit, then restart Network Monitor. If the
problem still occurs, contact your support organization.
RA14
There are a maximum of 32 simultaneous processes per Graphics
System that can communicate with the Alarm Collector process. The
nm_con, nm_stat, and nm_al processes, (Network Monitor Control,
Network Status/Network Maps, and List Alarms Windows), communicate
with the Alarm Collector. Also, there is a limit of 16 simultaneous List
Alarms Windows. Reduce the number of these processes currently
running. To determine the number and owners of these processes, use
the HP-UX system command ps -ef | egrep -e nm_con. Repeat, using
nm_stat and nm_al.
RA15
The Graphics System cannot be simultaneously connected to more than
16 Core Systems. Make some existing connections inactive before
adding new connections to additional Core Systems. There is also a limit
of 300 nodes and 1000 unique outstanding alarms that can be supported
by Network Monitor.
RA16
Look for other messages that should explain the cause of the problem.
RA17
There is a problem with the filter file $NM_ROOT/lib/filters. Check the
format of the file to make sure it is correct. When corrected, restart the
Alarm Collector using the filter_sync command.
StarKeeper II NMS Graphics System Guide, R10.0, Issue 1
C-5
Network Monitor Error Messages
Table C-2.
Recommended Actions—Continued
Recommended
Action
Number
Recommended Action Description
RA18
The named filter does not exist on the specified Core System. Either
change the name in the Network Monitor filter file $NM_ROOT/lib/filters
or create a filter with the corresponding name on the Core System. Use
the filter_sync command to restart the Alarm Collector using the new
filter.
RA19
When the Alarm Collector process shuts down, the View Network Status
task and the List Alarms Windows must be terminated. Re-start these
tasks/windows after the Alarm Collector process has been restarted.
RA20
There is a problem with the User Notice named in the error message. Try
re-creating the user notice definition using the Define User Notices option
from the Network Monitor Control Window. The View Network Status task
must be quit and then restarted to use the new User Notice definitions.
RA21
Use the Set Top Map option in the Administer Maps sub-menu of the
Network Monitor Control Window to specify the file name of the map to
be used as the top map of the hierarchy.
RA22
Either an internal error has occurred or there is a problem with one of the
network maps created using the Edit Maps Window. Re-create the map
in error.
RA23
Environment variables are set up through the adduser command. Use
the adduser command again to set up the environment properly.
RA24
Either the system administrator killed the process or the Graphics
System is being shut down. Try again later.
RA25
Communications with a Core System may have failed. Check the
messages from nm_map_gen to see which shelf maps were generated.
When communications are re-established, try again for those maps that
were not generated.
RA26
Non-unique data exists for the named node. The Core System config
database may be corrupted. Contact your support organization.
RA27
A partial node name was supplied to Diagnostics that is not unique
across the network. If a node is defined in more than one Core System
database, all instances must have exactly the same name. Use the cf
commands as described in the StarKeeper II NMS Core System Guide to
make the node names identical.
C-6
StarKeeper II NMS Graphics System Guide, R10.0, Issue 1
Network Monitor Error Messages
Table C-2.
Recommended Actions—Continued
Recommended
Action
Number
Recommended Action Description
RA28
Either the node/system is not known by the Graphics System (see
Synchronize Connections in the Graphics System administration task),
or the equipment type or generic is not supported by the Graphics
System and/or Network Monitor. Use the cf commands to confirm the
node is entered in the configuration database, and verify that the node's
type (for example, DKII) and generic are supported by the StarKeeper II
NMS distributed architecture.
RA29
An internal communications error has occurred. The daemon process
has exited. It should be restarted automatically within a couple of
minutes. Try again later. If the problem persists, restart the Graphics
System software using the stopws and startws commands.
RA30
An internal communications error has occurred. The daemon process is
still running, but service might be impaired. If so, restart the daemon
process. The Alarm Collector process can be restarted by issuing the
filter_sync command. All daemon processes can be restarted using the
stopws and startws commands to restart the Graphics System
software.
RA31
A Find Map command was issued for a certain network address. No
maps were found containing an object which has that address. Edit your
maps to add the new equipment.
RA32
Access to the database on the Core System has failed. This may be a
transient problem. Try again. If the problem persists, restarting the Core
System may help.
StarKeeper II NMS Graphics System Guide, R10.0, Issue 1
C-7
Network Monitor Error Messages
Error Messages from the Network
Monitor Control Window
Table C-3.
Error Messages from the Network Monitor Control Window
Control Window Error Messages
C-8
Recommended
Action
Address must be specified.
RA13
Alarm collector service is not being offered currently.
RA8
Both ‘:’ and ‘*’ may not be specified for address.
RA13
Can't open preference file <name>
Using default preferences for list alarms.
Check permissions on file.
RA1
Can't write preferences to file <name>
Using default preferences for list alarms.
Check permissions on file.
RA1
Cannot access user defined notice file <name>.
Check file permissions.
RA1
Cannot cancel subscription to alarm collector service.
RA12
Cannot get node data from SCP tables for NMS=<name>.
Check connection status.
RA3
Cannot get StarKeeper II NMS data from SCP tables. Check
connection status.
RA3
Cannot get SK NMS data from SCP tables. Error = <number>.
RA12
Cannot open Set Top Map file.
Please check directory permissions. <name>
RA1
Cannot open user defined notice file <name>.
Please check the file and or directory permissions, then try
again.
RA1
Cannot subscribe to <name> service. Errno=<number>.
RA12
Control process: Alarms collector service aborted.
It will be restarted by the system again.
RA8
Control process: Alarms collector service withdrawn.
It will be restarted again by the system.
RA8
Control process: Cannot initialize the fielded buffer.
RA1
Control process: Clear alarm service withdrawn.
RA9
Control process: Error in Input/Output (ioctl) setup
RA1
Control process: Error while receiving SCP message. Errno
=<number>.
RA12
StarKeeper II NMS Graphics System Guide, R10.0, Issue 1
Network Monitor Error Messages
Table C-3.
Error Messages from the Network Monitor Control Window —Continued
Control Window Error Messages
Recommended
Action
Control process: Error while sending SCP message.
Errno=<number>.
RA12
Control process: Network Monitor clear server aborted.
Alarm clear service will be restarted again.
RA9
Control process: Network Monitor netmap server aborted.
Please restart the netmap server again.
RA10
Control process: Received unknown message. Msg id =
<number>.
RA12
Control process: Unable to signup with the alarm collector
service.
RA8
Control process: Unable to subscribe to Alarm Collector
Status service.
RA8
Control process: Unable to subscribe to Clear Alarms service.
RA8
Control process: Unable to subscribe to the netmap service.
RA10
Environment variable <name> not set.
RA23
Error in address specified.
RA13
File name cannot be ‘.’ or ‘..’.
RA13
File name cannot contain a ‘/’.
RA13
File name cannot exceed <number> characters.
RA13
File name must be specified.
RA13
Last character of address must be alphanumeric.
RA13
Network Monitor netmap service withdrawn.
RA10
Network Monitor unable to terminate SCP communications.
Errno=<number>.
RA12
Server <name> denied to offer its services.
RA12
Severity must be specified.
RA13
Task Manager returns bad arguments error for tmexec
request.
RA13
Task Manager returns bad pathname error for tmexec request.
RA13
Task Manager returns exec failed error for tmexec request.
RA2
Task Manager returns fork failed error for tmexec request.
RA2
Task Manager returns system limit error for tmexec request.
RA2
Task Manager returns unknown return code for tmexec
request.
RA13
StarKeeper II NMS Graphics System Guide, R10.0, Issue 1
C-9
Network Monitor Error Messages
Table C-3.
Error Messages from the Network Monitor Control Window —Continued
Control Window Error Messages
C-10
Recommended
Action
Unable to cancel clear services. Errno=<number>.
RA12
Unable to cancel netmap services. Errno=<number>.
RA12
Unable to initialize seamless communication. Exiting.
RA5
Unable to subscribe to tmexec service.
RA8
Warning: Outstanding alarms exceeding 75% of the capacity.
Please clear some alarms.
RA15
Warning: Outstanding alarms reached 100% of the capacity.
New alarms will be dropped. Please clear some alarms.
RA15
Will not be able to clear alarms from control window.
RA16
Will not be able to list alarms from control window.
RA16
Will not be able to use netmap services from control window.
RA16
StarKeeper II NMS Graphics System Guide, R10.0, Issue 1
Network Monitor Error Messages
Error Messages from the Network
Status and Network Map Windows
Table C-4.
Error Messages from Network Status and Network Map Windows
Network Status and Network Map Window Error Messages
Recommended
Action
<Server name> has withdrawn its service.
RA16
<Server name> has terminated abnormally.
RA16
AD_ALARMS service has terminated. Network Status cannot
be provided.
RA5
Alarm Collector has terminated normally.
RA19
Cannot cancel <service name> service.
Unix error=<number>.
RA12
Cannot determine top map name. Execute “Set Top Map”
function.
RA21
Cannot offer service <service name> to Clients.
Unix error=<number>.
RA12
Cannot withdraw service <service name> from Clients.
Unix error=<number>.
RA12
Error in determining top map name. Execute “Set Top Map”
function.
RA21
Error in ad_find_obj().
RA13
Error in adding field <field name> to FB.
RA13
Error in building search routines for map hierarchy.
RA13
Error in creating a map widget.
RA13
Error in creating icon for
Network Status or Network Map window.
RA13
Error in creating map legend.
RA13
Error in determining top map name. Execute “Set Top Map”
function.
RA21
Error in format of user notice <notice number>.
RA20
Error in initializing FB.
RA13
Error in initializing map hierarchy Reason:
<reason>.
RA22
Error in initializing search routines for map hierarchy.
RA13
Error in notice(s) specification.
RA20
Error in processing clear request.
RA16
StarKeeper II NMS Graphics System Guide, R10.0, Issue 1
C-11
Network Monitor Error Messages
Table C-4.
Error Messages from Network Status and Network Map Windows —
Network Status and Network Map Window Error Messages
C-12
Recommended
Action
Error in reading input queue.
Unix error=<number>.
RA1
Error in SCP_ack() to tag=<hex number>.
Unix error=<number>.
RA12
Error in SCP_send() to tag=<hex number>.
Unix error=<number>.
RA12
Error in setting environment for task execution.
Unix error=<number>.
RA23
Error in trunk address specification:
<address pair separated by '='>.
RA22
Failed to execute <process name>.
RA2
Found object with no name.
RA13
Internal graphics error encountered in gp_build_gcs: Cannot
build GCs.
RA13
Map not found for selected address.
RA31
Received a FB with invalid <field name> field.
RA12
Received an SCP_ACK from unknown service <service
name>.
RA12
Received bad message type seamless communications.
RA12
Received subscription request for unknown service <service
name>.
RA12
Received unknown message type from seamless
communications.
RA12
Received unknown operation (op) code from seamless
communications.
RA12
Too many errors in reading input queue.
RA1
Unable to create initial network map widget.
RA13
Unable to initialize seamless communication. Exiting.
RA5
Unable to sign up for the AD_ALARMS service. The
AD_ALARMS service is not running at this time.
RA8
Unable to subscribe to SCP services.
RA12
Usage: nm_stat -D -T <top_mapname>
-L <legend_mapname> -B <Bell_flag>
-C <Num_bells_critical> -J <Num_bells_major>
-N <Num_bells_minor> -M <gp_printmalloc>
RA16
StarKeeper II NMS Graphics System Guide, R10.0, Issue 1
Network Monitor Error Messages
Error Messages from the List Alarms
Window
Table C-5.
Error Messages from the List Alarms Window
List Alarms Window Error Messages
Recommended
Action
Alarm collector service is not currently being offered.
RA8
Alarms service aborted. List alarms process exiting. Try again
later.
RA8
Alarms service being withdrawn. Alarm List process exiting.
Alarm service will be restarted. Try again later.
RA8
Bad Address given on command line.
RA16
Bad User Notice file name.
RA16
Cannot get StarKeeper II NMS data from SCP tables. Check
connection status.
RA3
Cannot open list alarms address selection data file.
RA1
Cannot open user defined notice address selection data file.
RA1
Cannot read alarm list preference file.
Using default preferences for list alarms.
RA1
Environment variable <name> not set.
RA23
Error in Input/Output (ioctl) setup.
RA1
File name must be specified to save alarm list.
RA16
Internal error: unable to allocate memory.
RA2
List alarms cannot add fields to the Fielded Buffer.
RA1
List alarms cannot initialize the fielded buffer.
RA1
List Alarms: Diagnostics process returns bad return.
Please check if the connection to the node is active.
RA28
List Alarms process unable to send <Find Map> request to
netmap server.
Start the View Network Status task.
RA10
List Alarms processing error. Try again later.
RA13
List Alarms unable to get alarm help.
Please check to ensure all local StarKeeper (R) II NMSs are
administered and active.
RA3
List alarms unable to subscribe to the clear alarms service.
RA9
List alarms unable to subscribe to the netmap service.
RA10
List alarms: cannot open node name file.
RA16
StarKeeper II NMS Graphics System Guide, R10.0, Issue 1
C-13
Network Monitor Error Messages
Table C-5.
Error Messages from the List Alarms Window —Continued
List Alarms Window Error Messages
C-14
Recommended
Action
List alarms: Error while process was accessing an alarm
record.
RA13
List alarms: Error while process was leaving an alarm record.
RA13
List alarms: Error while receiving SCP message. errno
=<number>.
RA12
List alarms: Error while sending SCP message.
errno=<number>.
RA12
Maximum number of clients for alarm collector's service
exceeded.
Please quit some list alarms, then try again.
RA15
Maximum number of list alarms exceeded.
Please quit some list alarms, then try again.
RA15
Memory allocation error, re-start Alarm List.
RA13
Netmap status service aborted. Find map service will be
disabled.
RA10
Network Monitor clear alarms service aborted.
Clear Alarms will be disabled until the service is restarted.
RA9
Network Monitor clear alarms service withdrawn.
Clear service will be disabled until the service is restarted.
RA9
No alarms in the list.
RA16
Received unknown message. Type=<number>.
RA12
Server <name> denied acknowledgment.
Not providing service.
RA12
Task Manager returns bad arguments error for tmexec
request.
RA13
Task Manager returns bad pathname error for tmexec request.
RA13
Task Manager returns exec failed error for tmexec request.
RA2
Task Manager returns fork failed error for tmexec request.
RA2
Task Manager returns system limit error for tmexec request.
RA2
Task Manager returns unknown return code for tmexec
request.
RA13
The alarms database has 999 or more outstanding alarms.
List Alarms will be restricted to 999 alarms.
Please clear some alarms.
RA15
Unable to access alarm record.
RA13
StarKeeper II NMS Graphics System Guide, R10.0, Issue 1
Network Monitor Error Messages
Table C-5.
Error Messages from the List Alarms Window —Continued
List Alarms Window Error Messages
Recommended
Action
Unable to attach alarms SHM segment.
RA2
Unable to attach roca SHM segment.
RA2
Unable to get alarms SHM segment address.
RA2
Unable to get block lock SEM.
RA2
Unable to get record lock SEM.
RA2
Unable to get roca shared memory id.
RA2
Unable to get roca shared memory id.
RA8
Unable to get roca shared memory pointer.
RA2
Unable to get shared memory address.
RA2
Unable to get shared memory id.
RA2
Unable to initialize seamless communication.
RA5
Unable to lock alarms SHM segment.
RA2
Unable to obtain client id from AD_ALARMS.
RA8
Unable to obtain client id from AD_ALARMS.
RA13
Unable to parse a node address listed in the node file.
RA16
Unable to signup for the AD_ALARMS service.
RA8
Unable to start new List Alarms process. The maximum
number of List Alarms processes has been reached.
RA2
Unable to subscribe to AD_ALARMS.
RA8
Unable to subscribe to Find Map service.
RA8
Unable to subscribe to tmexec service.
RA8
Unable to unlock alarms SHM segment.
RA2
Usage: ad_al <-n # nodes> <-a|-f|-h filename|address> -s
severity.
RA13
Wrong user defined notice selection data format.
RA20
You must select exactly one alarm.
RA16
You must specify an alarm ID.
RA16
StarKeeper II NMS Graphics System Guide, R10.0, Issue 1
C-15
Network Monitor Error Messages
Error Messages from the Diagnostics
Window
Table C-6.
Error Messages from the Diagnostics Window
Diagnostics Window Error Messages
C-16
Recommended
Action
Address: <network address> is invalid.
RA13
An inter-application protocol error has occurred.
RA13
Cannot focus on node: <nodename>.
RA28
Communications aborted. Try again later.
RA5
Communications cannot be initialized. Try again later.
RA5
Conc slot: <number/number> on node: <nodename> is not
defined in the database.
RA4
Could not set environment for user: <login_id>.
RA1
Database server subscription failed. Try again later.
RA6
Dbserver is not available. Try again later.
RA6
Error was encountered loading resource file: <filename>.
RA23
Error was encountered loading window structures.
RA23
Internal Diagnostics error. Offset for object definitions was not
found.
RA13
Internal Diagnostics error. Offset for verb definitions was not
found.
RA13
Module needs to be configured in core database.
RA4
Module type: <Modtype> is not supported.
RA28
Mux slot: <number.number> on node: <nodename> is not
defined in the database.
RA4
Node: <nodename> id not found in database.
RA4
Node: <nodename> is an unsupported system type: <type>.
RA28
Node: <nodename> is not unique.
RA27
Node: <nodename> is running unsupported generic:
<number>.
RA28
Node: <nodename> not found in database.
RA4
Setup procedure has timed out. Try again later.
RA2
Slot: <number> at node: <nodename> is not defined in the
database.
RA4
System cannot exec process. Try again later.
RA2
System cannot fork process. Try again later.
RA2
StarKeeper II NMS Graphics System Guide, R10.0, Issue 1
Network Monitor Error Messages
Table C-6.
Error Messages from the Diagnostics Window —Continued
Diagnostics Window Error Messages
Recommended
Action
Tmserver is not available. Try again later.
RA7
Too many programs are running. Try again later.
RA2
Unable to access a data base. Try again later.
error code = < error code>.
RA6
Undefined error condition has been encountered.
RA13
StarKeeper II NMS Graphics System Guide, R10.0, Issue 1
C-17
Network Monitor Error Messages
Error Messages from the Display Info
Window
Table C-7.
Error Messages from the Display Info Window
Display Info Window Error Messages
Recommended
Action
Access to config database server denied.
RA6
Database server config aborted.
RA6
Database server is busy. Cannot send more than one request
at a time.
RA13
Database services being withdrawn currently.
RA6
Display Info process cannot open the datafile send by
database server.
RA1
Display Info process invoked with incorrect options.
RA16
Display Info process received INFORMIX Error for transaction
id <trans id> INFORMIX error code <error code> and error
message <message>.
RA13
Display Info process received seamless communication error - RA12
DB_SCP_ERRNO. Error = <number>.
C-18
Display Info process received unknown control message.
Mtype = <type>.
RA13
Display Info process unable to cancel subscription to database
server.
Errno=<number>.
RA12
Display Info process unable to find node address.
RA4
Display Info process unable to get a server tag for node
address <address> Errno = <error number>. Check if the node
addr is configured in SK database.
RA16
Display Info process unable to initialize seamless
communication.
Errno=<number>.
RA5
Display Info process unable to send message to database
server. Check if the database server is active. Try again later.
RA32
Display Info process unable to subscribe with config database
service.
Errno=<number>.
RA6
Display Info process unable to terminate SCP communication.
Errno=<number>.
RA12
Display Info server cannot read the datafile sent by database
server.
RA1
StarKeeper II NMS Graphics System Guide, R10.0, Issue 1
Network Monitor Error Messages
Table C-7.
Error Messages from the Display Info Window
Display Info Window Error Messages
Recommended
Action
Display Info server received database query format or syntax
error.
RA32
Display Info unable to open trunk addresses data file.
RA1
Display Info unable to put FILEDTBLS as an environment
variable.
RA1
Display Info: Cannot initialize the fielded buffer.
RA1
Display Info: Cannot initialize the fielded buffer.
RA13
Display Info: Error in Input/Output (ioctl) setup.
RA1
Display Info: Error in seamless communication receive
message.
Errno =<number>.
RA12
Display Info: Error in seamless communication send message.
Errno=<number>.
RA12
Unknown server responded with a subscription response.
server = <server>.
RA13
Error Messages from the Edit Maps
Window
Table C-8.
Error Messages from the Edit Maps Window
Edit Maps Window Error Messages
Recommended
Action
Access failure to database server on StarKeeper II NMS
<name>.
RA6
Cannot delete map file <filename>. Cannot find map file.
RA22
Can't load map file. File= <filename>
RA22
Can't write map file.
RA22
Communication failure to StarKeeper II NMS <name>.
RA3
Communication initialization failure.
RA12
Database retrieval failed.
RA32
Database update failed.
RA32
Editor invocation failure.
RA13
Graphics initialization failure.
RA1
Input map name must not contain a ‘/’.
RA16
StarKeeper II NMS Graphics System Guide, R10.0, Issue 1
C-19
Network Monitor Error Messages
Table C-8.
Error Messages from the Edit Maps Window —Continued
Edit Maps Window Error Messages
C-20
Recommended
Action
Internal communication failure.
RA12
Map name cannot be ‘.’ or ‘..’.
RA16
Map name cannot exceed <maximum length> characters.
RA16
Request node data not available, check connections status.
RA3
Request conc/mux data not available, check connections
status.
RA3
Request trunk data not available, check connections status.
RA3
Save error: Can’t Write Map File: Check Permissions (Error =
error number> File = <file name>).
RA22
Set Network Address Error: Can’t Write Map File: Check
Permissions (Error = <error number> File = <filename>.
RA16
StarKeeper II NMS Graphics System Guide, R10.0, Issue 1
Network Monitor Error Messages
Error Messages from the Alarm
Collector Process
Table C-9.
Error Messages from the Alarm Collector Process
Alarm Collector Process Error Messages
Recommended
Action
Abnormal termination of client (tag=<hex number>).
RA16
Abnormal termination of client or server,
but (tag=<hex number>) not found in internal table.
RA12
Abnormal termination of server (tag=<hex number>).
RA16
Alarm Collector terminating abnormally.
RA13
Alarm Collector will not receive alarms from this StarKeeper II
NMS.
RA16
Cannot cancel <service name> service.
Unix error=<number>.
RA12
Cannot convert tag = <hex number> to StarKeeper II NMS
name.
RA12
Cannot free seamless communication resources.
Unix error=<number>.
RA12
Cannot offer services to Clients.
Unix error=<number>, Exiting.
RA29
Cannot subscribe to Alarm Handlers' services.
Unix error=<number>, Exiting.
RA29
Cannot withdraw from <service name> service.
Unix error=<number>.
RA12
Could not add Alarm Handler (tag=<hex number>,
on StarKeeper II NMS <name>) to internal table.
RA30
Could not add Client (tag=<hex number>) to internal table.
RA30
Could not find client (tag=<hex number>) in internal table.
RA12
Could not find client (tag=<hex number>) in list to delete.
RA12
Error in adding field <field name> to FB.
RA13
Error in bad filter type.
Line read is <line>.
RA17
Error in format of filter file.
Line read is <line>.
RA17
Error in initializing free list manager, Exiting.
RA30
Error in opening filter file.
Unix error=<number>.
RA17
StarKeeper II NMS Graphics System Guide, R10.0, Issue 1
C-21
Network Monitor Error Messages
Table C-9.
Error Messages from the Alarm Collector Process
Alarm Collector Process Error Messages
C-22
Recommended
Action
Error in processing A_SYNC message.
RA12
Error in reading input queue.
Unix error=<number>.
RA1
Error in SCP_ack() to tag=<hex number>.
Unix error=<number>.
RA12
Error in SCP_send() to tag=<hex number>.
Unix error=<number>.
RA12
Error waiting on a block semaphore.
Unix error=<number>, Exiting.
RA1
Filter specification for StarKeeper II NMS <name> is invalid.
No filtering will be applied for alarms from this StarKeeper II
NMS.
RA18
Memory allocation error.
Unix error=<number>, Exiting.
RA1
Number of Alarm Lists have exceeded the limit of 16.
RA14
Number of StarKeeper II NMSs connected to this Graphics
System has exceeded the limit of 16.
RA15
Number of clients of Alarm Collector has exceeded the limit of
32.
RA14
Number of filter specifications exceed the number
of StarKeeper II NMSs (16) supported.
RA17
Out of node storage memory.
Number of nodes exceeds <number>.
RA15
Out of shared memory to store alarms.
Number of outstanding alarms exceed <number>.
RA15
Received a FB with invalid <field name> field.
RA12
Received a FB with missing <field name> field.
RA12
Received a FB with unknown <field name> field.
RA12
Received bad message type from seamless communications.
RA12
Received control message for tag=<hex number>,
but client not found in internal table.
RA12
Received control message for tag=<hex number>,
but server not found in internal table.
RA12
Received subscription request for unknown service <service
name>.
RA13
StarKeeper II NMS Graphics System Guide, R10.0, Issue 1
Network Monitor Error Messages
Table C-9.
Error Messages from the Alarm Collector Process
Alarm Collector Process Error Messages
Recommended
Action
Received unknown message type from seamless
communications.
RA12
Received unknown operation (op) code from seamless
communications.
RA12
Too many errors in reading input queue, Exiting.
RA29
Unable to initialize seamless communication. Exiting.
RA5
StarKeeper II NMS Graphics System Guide, R10.0, Issue 1
C-23
Network Monitor Error Messages
Error Messages from the Clear Alarms
Process
Table C-10. Error Messages from the Clear Alarms Process
Clear Alarms Process Error Messages
C-24
Recommended
Action
Alarms service not being offered. Clear service disabled.
RA11
Alarms services denied. Clear services will not be available.
RA11
Clear process unable to ack clients. errno=<number>.
RA12
Clear process unable to cancel subscription to alarms.
errno=<number>.
RA12
Clear process unable to initialize seamless communication.
RA5
Clear process unable to initialize the fielded buffer.
RA1
Clear process unable to send broadcast message.
errno=<number>.
RA12
Clear process unable to send NACK to the clients.
errno=<number>.
RA12
Clear process unable to send withdraw message.
errno=<number>.
RA12
Clear process unable to subscribe with alarms service.
RA11
Clear process unable to terminate SCP communication.
errno=<number>.
RA12
Clear process: Error in Input/Output (ioctl) setup.
RA1
Clear process: Error while receiving SCP message. errno
=<number>.
RA12
Clear process: Error while sending SCP message.
errno=<number>.
RA12
Clear service unable to offer services to clients.
errno<number>.
RA12
No alarms services being offered currently. Clear service
disabled.
RA11
StarKeeper II NMS Graphics System Guide, R10.0, Issue 1
Network Monitor Error Messages
Error Messages from the Shelf Map
Generation Process
Table C-11. Error Messages from the Shelf Map Generation Process
Shelf Map Generation Process Error Messages
Recommended
Action
Address <address> not found in map file.
RA13
Badly formatted NMS address in input file.
RA13
Command line option <-option> not recognized.
RA13
Communication service aborted due to system error:
<system error description>.
RA25
Communication service aborted, error: <number>.
RA25
Communication service could not be established due to
system error:
<system error description>.
RA25
Communication service could not be established, error:
<number>.
RA25
Communication service failed to receive message due to
system error:
<system error description>.
RA25
Communication service failed to receive message, error:
<number>.
RA25
Communication service failed to send message due to system
error:
<system error description>.
RA25
Communication service failed to send message, error:
<number>.
RA25
Communication service termination failed due to system error
<error>.
RA25
Communication service termination failed, error <number>.
RA25
Communication service withdrawn due to system error:
<system error description>.
RA25
Communication service withdrawn, error: <number>.
RA25
Concentrator map generation failed for node
[<NMSaddr>]<node>.
RA16
Could not access hardware type definition file:
<system error description>.
RA1
Could not open node list input file, system error:
<system error description>.
RA1
StarKeeper II NMS Graphics System Guide, R10.0, Issue 1
C-25
Network Monitor Error Messages
Table C-11. Error Messages from the Shelf Map Generation Process —Continued
Shelf Map Generation Process Error Messages
C-26
Recommended
Action
Could not remove node list input file.
RA1
Database service could not be established due to system
error:
<system error description>.
RA6
Database service could not be established, error: <number>.
RA6
Environment variable NM_ROOT is not set.
RA23
Insufficient configuration data exists for
[<NMSaddr>]<node>.
RA4
Invalid format in nm_htype file on line <number>.
RA13
Map generation failed for NMS: <NMSaddr>.
RA16
Missing node address in input file.
RA13
No database servers are currently available.
RA6
Node list input file multiply defined.
RA13
Node list input file not specified.
RA13
Node map generation failed for node
[<NMSaddr>]<node>.
RA16
Non-unique data returned for node
[NMSaddr]<node name>.
RA26
Object <object label> in shelf map template could not be
found or is not unique.
RA13
Shelf map files not generated for
[<NMS addr>]<node> - cannot get configuration data.
RA6
Termination due to receipt of SIGTERM signal.
RA24
The database interface process has suffered a fatal error,
processing terminated.
RA6
The database interface process returned error <error
number>, processing continues.
RA6
The database interface process received communication
process error number <number>, processing terminated.
RA6
Unable to access concentrator data file: <file name> System
error:
<system error description>.
RA1
Unable to access concentrator module data file: <file name>
System error:
<system error description>.
RA1
StarKeeper II NMS Graphics System Guide, R10.0, Issue 1
Network Monitor Error Messages
Table C-11. Error Messages from the Shelf Map Generation Process —Continued
Shelf Map Generation Process Error Messages
Recommended
Action
Unable to access node data file: <file name> System error:
<system error description>.
RA1
Unable to access node module data file: <file name> System
error:
<system error description>.
RA1
Unable to access shelf data file: <file name> System error:
<error>.
RA13
Unable to access shelf map label in shelf map template:
<filename>.
RA13
Unable to access shelf map object label in shelf map
template: <filename>.
RA13
Unable to read from database transaction concentrator data
file: System error:
<system error description>.
RA1
Unable to read from database transaction concentrator
module data file:
<System error: <system error description>.
RA1
Unable to read from database transaction node data file: FML
error: <error>.
RA1
Unable to read from database transaction node module data
file: FML error: <error>.
RA1
Unable to read shelf map template: <template file> System
error:
<system error description>.
RA1
Unable to remove database transaction file: <file_name>.
System error:
<system error description>.
RA1
Unable to write shelf map to disk file: <template file>.
RA1
Unexpected communication service application message.
RA25
Unknown communication service control message received.
RA25
Unknown type of message received by communication
process.
RA25
WARNING: <NMSname> database service not available, no
maps generated for <NMSname>.
RA6
StarKeeper II NMS Graphics System Guide, R10.0, Issue 1
C-27
Network Monitor Error Messages
Table of HP-UX System Error Codes
Table C-12. HP-UX System Error Codes
HP-UX
System Error
Number
C-28
Error Description
1
Not super-user
2
No such file or directory
3
No such process
4
Interrupted system call
5
I/O error
6
No such device or address
7
Arg list too long
8
Exec format error
9
Bad file number
10
No children
11
No more processes
12
Not enough core
13
Permission denied
14
Bad address
15
Block device required
16
Mount device busy
17
File exists
18
Cross-device link
19
No such device
20
Not a directory
21
Is a directory
22
Invalid argument
23
File table overflow
24
Too many open files
25
Not a typewriter
26
Text file busy
27
File too large
28
No space left on device
29
Illegal seek
30
Read only file system
StarKeeper II NMS Graphics System Guide, R10.0, Issue 1
Network Monitor Error Messages
Table C-12. HP-UX System Error Codes —Continued
HP-UX
System Error
Number
Error Description
31
Too many links
32
Broken pipe
33
Math arg out of domain of func
34
Math result not representable
35
No message of desired type
36
Identifier removed
37
Channel number out of range
38
Level 2 not synchronized
39
Level 3 halted
40
Level 3 reset
41
Link number out of range
42
Protocol driver not attached
43
No CSI structure available
44
Level 2 halted
45
Record locking deadlock
StarKeeper II NMS Graphics System Guide, R10.0, Issue 1
C-29
Network Monitor Error Messages
Table of SCP Error Codes
Table C-13. SCP Error Codes
SCP Error Code
C-30
Description
64 (EX_USAGE)
command line usage error
65 (EX_DATAERR)
data format error
66 (EX_NOINPUT)
cannot open input file
67 (EX_NOUSER)
addressee unknown
68 (EX_NOHOST)
host name unknown
69 (EX_UNAVAILABLE)
service unavailable
70 (EX_SOFTWARE)
internal software error
71 (EX_OSERR)
system error (e.g., can't fork)
72 (EX_OSFILE)
critical OS file missing
73 (EX_CANTCREAT)
can't create output file
74 (EX_IOERR)
input/output error
75 (EX_TEMPFAIL)
temporary failure; user is invited to retry
76 (EX_PROTOCOL)
remote error in protocol
77 (EX_NOPERM)
permission denied
78 (EX_HBUSY)
all channels busy
79 (EX_TOSRV)
remote node not answering
80 (EX_HOSRV)
server not answering
81 (EX_TBUSY)
all trunk channels busy
401 (SCP_ESYSERR)
UNIX system error, examine errno
402 (SCP_ENOEXIST)
SCP_CTL function calls: tested field
does not exist
403 (SCP_ENOTFULL)
specified path is not a full pathname
404 (SCP_ESH)
system(3) calls RC not 0
405 (SCP_EBADENV)
environment variable not found
406 (SCP_EBADTAG)
bad session id
407 (SCP_EQ)
trouble with queues
408 (SCP_EALLOC)
could not allocate memory
409 (SCP_EMEM)
trouble with shared memory
410 (SCP_ECOMPAT)
compatibility problem with code
411 (SCP_EBADARG)
bad argument to routine
412 (SCP_EBADMACH)
trouble with machine table
StarKeeper II NMS Graphics System Guide, R10.0, Issue 1
Network Monitor Error Messages
Table C-13. SCP Error Codes —Continued
SCP Error Code
Description
413 (SCP_ETOOLONG)
argument too long
414 (SCP_EFMLERR)
FML error, examine Ferror
415 (SCP_EMINIT)
called SCP init more than once
416 (SCP_ENIT)
SCP init not called
417 (SCP_EFILE)
trouble with a file
418 (SCP_EXQ)
trouble with expandable queues
419 (SCP_ELINT)
lint forced a return, need errno set
420 (SCP_EBADFENV)
file environment variable not found
421 (SCP_EBADSRVC)
service name is not good
422 (SCP_ENOENT)
error, no entry exists in a table
423 (SCP_EINVAL)
error in the way arguments were passed
(INVALID) to a function
424 (SCP_ENOTUNIQUE)
error, partial node name NOT UNIQUE
425 (SCP_EBADFLAG)
error in SCP_Waitf flag set to a value
426 (SCP_ENOCNCLASS)
error, no connection class to connection
field mapping in connection SHM
segment
427 (SCP_EBADVERSION)
invalid VERSION/SK_RELEASE
StarKeeper II NMS Graphics System Guide, R10.0, Issue 1
C-31
Network Monitor Error Messages
C-32
StarKeeper II NMS Graphics System Guide, R10.0, Issue 1
Performance Reporter Error
Messages
D
This section contains a list of error messages that are displayed by Performance
Reporter.
■
Cannot create link to report file. See event log for
more information.
This message is displayed when the Performance Reporter application
tries to create a link to its report file. Look at the EVENTLOG for more information and report it to your Support Personnel/Organization.
■
Cannot delete request. See event log for more information.
This message is displayed when the Performance Reporter application
fails to delete a report request. Look at the EVENTLOG for more information and report it to your Support Personnel/Organization.
■
Cannot find form data file. See event log for more
information.
This message is displayed when the Performance Reporter application
cannot find a form data file for a selected report request. Look at the
EVENTLOG for more information and report it to your Support Personnel/
Organization.
■
Cannot get a list of group names. See event log for more
information.
This message is displayed when the Performance Reporter application
fails to get a list of group names due to an internal error. Look at the
EVENTLOG for more information and report it to your Support Personnel/
Organization.
StarKeeper II NMS Graphics System Guide, R10.0, Issue 1
D-1
Performance Reporter Error Messages
■
Cannot get a list of node names. See event log for more
information.
This message is displayed when the Performance Reporter application
fails to get a list of node names due to an SCP error. Look at the EVENTLOG for more information and report it to your Support Personnel/Organization.
■
Cannot get a list of StarKeeper II NMS host names. See
event log for more information.
This message is displayed when the Performance Reporter application
fails to get a list of Core System names due to an SCP error. Look at the
EVENTLOG for more information and report it to your Support Personnel/
Organization.
■
Cannot get a list of trunk names. See event log for more
information.
This message is displayed when the Performance Reporter application
fails to get a list of trunk names due to an internal error. Look at the
EVENTLOG for more information and report it to your Support Personnel/
Organization.
■
Cannot get list of report files. See event log for more
information.
This message is displayed when the Performance Reporter application
fails to get a list of report files for the List Exception Reports and List Filed
Reports options. Look at the EVENTLOG for more information and report it
to your Support Personnel/Organization.
■
Cannot get list of report requests. See event log for
more information.
This message is displayed when the Performance Reporter application
fails to get a list of report requests for the List Report Request option. Look
at the EVENTLOG for more information and report it to your Support Personnel/Organization.
■
Cannot open data file <datafile>. <Reason>.
This message is displayed when the Performance Reporter application
fails to open a data file <datafile> for reading or writing. Look at <Reason>
for further details. <Reason> is given by the HP-UX system.
■
Cannot open report file <rptfile>. <Reason>.
This message is displayed when the Performance Reporter application
fails to open a report file <rptfile> for reading or writing. Look at <Reason>
for further details. <Reason> is given by the HP-UX system.
D-2
StarKeeper II NMS Graphics System Guide, R10.0, Issue 1
Performance Reporter Error Messages
■
Cannot print report. See event log for more information.
This message is displayed when the Performance Reporter application
fails to print a report. Look at the EVENTLOG for more information and
report it to your Support Personnel/Organization.
■
Cannot re-create cronfile. See event log for more
information.
This message is displayed when the Performance Reporter application
fails to re-create the user’s missing .cronfile. Look at the EVENTLOG for
more information and report it to your Support Personnel/Organization.
■
Cannot rename over existing file.
This message is displayed when the user attempts to rename a file over an
existing file. Choose a different file name or delete the existing file and execute the Rename option again.
■
Cannot rename report. See event log for more information.
This message is displayed when the Performance Reporter application
fails to rename a report. Look at the EVENTLOG for more information and
report it to your Support Personnel/Organization.
■
Cannot save report. See event log for more information.
This message is displayed when the Performance Reporter application
fails to save a report. Look at the EVENTLOG for more information and
report it to your Support Personnel/Organization.
■
Cannot schedule report requests. See event log for more
information.
This message is displayed when the Performance Reporter application
fails to schedule report requests. Look at the EVENTLOG for more information and report it to your Support Personnel/Organization.
■
Cannot send report request. See event log for more
information.
This message is displayed when the Performance Reporter application
fails to send a report request. Look at the EVENTLOG for more information
and report it to your Support Personnel/Organization.
■
Cannot send threshold status update request. See event
log for more information.
This message is displayed when the Performance Reporter application
fails to send a threshold status update request. Look at the EVENTLOG for
more information and report it to your Support Personnel/Organization.
StarKeeper II NMS Graphics System Guide, R10.0, Issue 1
D-3
Performance Reporter Error Messages
■
Cannot send threshold update request. See event log for
more information.
This message is displayed when the Performance Reporter application
fails to send a threshold update request. Look at the EVENTLOG for more
information and report it to your Support Personnel/Organization.
■
Cannot update request. See event log for more information.
This message is displayed when the Performance Reporter application
fails to update a report request. Look at the EVENTLOG for more information and report it to your Support Personnel/Organization.
■
Environment variable “<variable name>” is not set. Contact your System Administrator.
This message is displayed when one of the environment variables needed
by the Performance Reporter application is not set. Contact your System
Administrator.
■
Initialization failed. See event log for more information.
This message is displayed when you bring up the Performance Reporter
application but it encounters problems during its initialization. Look at the
EVENTLOG for more information and report it to your Support Personnel/
Organization.
■
Missing directory or file <home_directory>/.cronfile.
Attempting to re-create.
This message is displayed when a user tries to bring up Performance
Reporter but the application cannot find the file .cronfile for that user as
part of its initialization. Performance Reporter will attempt to re-create this
missing file.
■
No data available
This message can appear in the body of a report you have requested
where you would expect to see data. It will be displayed whenever your
entire report request cannot be met. However, if you have requested a
trunk report for two trunks and there is data for one of the trunks, then the
report for only one of the trunks will be printed. There will be no message.
There are several places where things could be out of synch in the data
collection, summarization, and reporting process. Here are some troubleshooting guidelines for when you encounter this message.
1. There are no resources of the specified type in your network or in
the node(s) that you selected.
2. The resources were not in service.
3. The data was not scheduled on the node or the Core System.
D-4
StarKeeper II NMS Graphics System Guide, R10.0, Issue 1
Performance Reporter Error Messages
4. The data was not generated on the node.
The node could be out of service or something could be wrong with
the data generation; for example, a malfunctioning module.
5. Core System was not connected to the node.
6. The data was not summarized (for weekly and monthly reports).
This can happen if you request a report earlier than when the data is
scheduled to be summarized.
7. The data has been deleted and is no longer in the Core System
database.
Check the data retention periods.
8. You have requested a report for a future date.
9. Performance Reporter cannot access the data on the Core System
to generate the report.
10. The configuration information has changed on the node or on the
Core System and Performance Reporter is not aware of the
changes.
To synchronize the configuration information on a Core System with
that on the node, run the cfg_sync command on the Core System.
To synchronize the configuration information on Performance
Reporter, use Update Configuration Data available from the
Administer menu in the Performance Reporter Control Window.
■
Node/Module configuration file does not exist. Check
connection(s) to StarKeeper II NMS.
This message is displayed when you don’t have any connections to your
Core System or the connections have not been established long enough
before you bring up the Performance Reporter application. Check your connections using Workstation Administration. If there exists one or more connections from your Graphics System to your Core System, you may want to
exit Performance Reporter now, wait for a few seconds and then try to bring
it up again.
■
Unable to process the request for the appropriate StarKeeper II NMS
This message is displayed when the Core System is disconnected, inactive, or has not been synchronized. Possible solutions are to update the
connections and perform a conn_sync on the Core System, activate the
Core System and Synchronize through Workstation Administration, or
Update Configuration Data through Performance Reporter.
StarKeeper II NMS Graphics System Guide, R10.0, Issue 1
D-5
Performance Reporter Error Messages
D-6
StarKeeper II NMS Graphics System Guide, R10.0, Issue 1
Glossary
The definitions in this section appear in alphabetical order. Cross references in the entries
are printed in bold type.
A
aau command parameter. An abbreviation
for alarm activator unit.
absolute pathname. The pathname used
to specify a command or program from
the root directory.
access. To connect with and use a software package or hardware device.
ACE. An abbreviation for Automated Cable
Expertise (OS).
ACF. An abbreviation for Access control
field (SMDS) .
adapter. 1. An auxiliary device or unit used
to extend the operation of another system. 2. An electronic part used to connect two dissimilar parts or machines.
address. An identifying name or code for a
network element or a service that end
users can access. Addresses reflect a
network hierarchy of four level mnemonic
addressing: network/area/exchange/
local service address or the X.121
scheme of: DNIC/SR/SA/EPN.
administration connection. A connection
in which the transfer of node data to
StarKeeper II NMS databases using
StarKeeper II NMS Network Builder, the
skload and cfg_sync commands, and
the Session Maintenance smverify and
smstat commands used to monitor Session Maintenance trunks is permitted.
AIM8. An abbreviation for Asynchronous
Interface Module 8-port (ISN) .
alarms connection. A connection type in
which alarms from external system elements other than BNS-2000 or BNS2000 VCS nodes are collected.
alias. An alternative (usually shortened)
area or exchange name for a node.
American Standard Code for Information
Interchange (ASCII). ASCII represents
characters, numbers, punctuation marks,
or signals in seven on-off bits plus a parity bit.
AMUX. An abbreviation for Asynchronous
Multiplexer.
anchor. A method, used in StarKeeper II
NMS network addressing, to limit the
matching criteria when searching for
specified records in the database. Compare wild card.
ANSI. An abbreviation for American
National Standards Institute .
application. A program that performs a
specific task, such as displaying network
alarms or running diagnostics.
area. Part of the destination code used in
addressing; similar to a telephone area
code. Each area may include multiple
exchanges and each exchange may
include multiple local service
addresses.
AI. An abbreviation for Alarm indication signal (SMDS) .
ASCII. An abbreviation for American Standard Code for Information Interchange.
AIM. An abbreviation for Asynchronous
Interface Module (ISN) .
Async. An abbreviation for asynchronous
communication/protocol. See Bisync.
StarKeeper II NMS Graphics System Guide, R10.0, Issue 1
GL-1
Glossary
asynchronous. Transmission in which the
time intervals between data characters
can be of unequal length, controlled by
start and stop bits at the beginning and
end of each character. Compare synchronous.
Asynchronous Interface Module 8-port
(AIM8). An eight-port module for placement in a bridging concentrator.
Asynchronous Multiplexer (AMUX). A
concentrator that provides either 32,
64, or 504 asynchronous ports. See
also Synchronous/Asynchronous Multiplexer.
board. A rectangular piece of fiberglass
that has pins on one side and electronic
parts on the other; also called a card, PC
board, or PCB (printed circuit board).
The system is always supplied with a
system board. Other boards can include
a video adapter board, a disk controller
board, a network communication board,
memory boards, multiplexed host interface boards, and multifunction boards.
bps. An abbreviation for bits per second.
B
background processing. The automatic
execution of a job, to be run in the background, while the user continues to perform other tasks.
backplane. The bus in a node to which all
control and interface modules connect.
backup. A spare copy of data or software
kept in case the original is damaged or
lost.
bad track. A part of the hard disk which is
not usable.
billing. A service that allows the network
administrator to track the date and connection time of asynchronous, multiplexed host, synchronous, and X.25 calls
through the network on a per-port basis
and assign a charge for the service.
billing connection. A connection type
used to capture billing data. There must
be a billing connection to StarKeeper II
NMS from each node reporting billing
data.
BISYNC. A Binary Synchronous Communication, link-layered, character oriented
IBM protocol used in synchronized transmission of binary coded data.
GL-2
BNS-2000. A cell relay switch that offers
connection-oriented service and connectionless, high-speed service using
broadband technology.
bridge modules. Interface modules residing in a bridging concentrator.
BSC3270. See SYNC8 .
buffer. A temporary storage location for
information being sent or received. It is
usually located between two different
devices that have different abilities concerning speeds for handling the data.
bus. The parallel wiring through which bits
of data travel to and from the parts of a
computer.
C
CAC. An abbreviation for Customer Assistance Center.
call hold. A feature that allows a user to
have more than one call active at any
time.
call setup. The node activity that establishes a virtual circuit connection
across the network.
CCS. An abbreviation for Customer Control
System (StarKeeper II NMS) .
central office (CO). An operating telephone company location where call
switching is done.
StarKeeper II NMS Graphics System Guide, R10.0, Issue 1
Glossary
central office local area network (CO
LAN). A data communications network
switched through a central office.
central processing unit (CPU). A component of the control computer.
channel. A transmission path or link.
CIC. An abbreviation for Customer Information Center.
CNM. An abbreviation for Customer network management (SMDS) .
CO. An abbreviation for Central office .
CO-LAN. An abbreviation for Central office
local area network .
command partitioning. A StarKeeper II
NMS security feature that allows certain
users access only to specified commands.
Computer Port Module-High-speed
(CPM-HS). A multiplexed optical fiber
interface.
Computer Port Module-Multiple Link
(CPM-ML). The CPMML can be located
in nodes and Multipurpose Concentrators to provide up to eight wire connections to LAN servers that use a version
of Datakit II VCS Host Interface Software for multiplexed communications
with the network. It supports speeds up
to 64 Kbps over RS-232-C or V.35 interfaces.
concentrator. A communications device
that can connect many devices of differing speeds to the node.
config. An abbreviation for configuration.
configuration. 1. The hardware and software components of a system that determine its capacity and performance. 2.
The task of populating databases with
information to identify the components
with which they communicate.
connector. A device allowing the connection of various electrical elements.
console. A video display terminal with keyboard used as an interface to the node
or network management system.
console security. A password optionally
required for administrative access to a
node or network management system.
contention. A condition where several systems are vying for access to a line and
only one can establish a connection.
When a connection cannot be established, it is said that this device is lost in
contention.
control computer (CC). The modules
making up node intelligence.
controller. See control computer.
Core System. Core StarKeeper II NMS
processor. A processor equipped with
StarKeeper II NMS Core processes. This
processor does not contain any graphic
system software.
Co-resident System. A StarKeeper II NMS
processor equipped with StarKeeper II
NMS Core and Graphics processes.
CPE. An abbreviation for Customer premises equipment.
CPM. An abbreviation for Computer Port
Module.
CPM-HS. An abbreviation for Computer
Port Module–High Speed.
CPMML. An abbreviation for Computer Port
Module Multiple Link
CPU. An abbreviation for Central processing unit.
CRC. An abbreviation for Cyclic redundancy check.
cron. An abbreviation for chronological.
StarKeeper II NMS Graphics System Guide, R10.0, Issue 1
GL-3
Glossary
critical modules. The Clock, Eswitch/
Switch, and Repeater modules; if these
modules fail, the node fails.
crons. StarKeeper II NMS processes that
run automatically at specified times,
usually to clean up old files. Cron is an
abbreviated form of the word
chronological.
crontab. A StarKeeper II NMS criteria
listing that allows crons to be
automatically run at specified times.
Crontab is an abbreviated form of the
words chronological table.
cursor. 1. In computer graphics, a movable
marker used to indicate position on a
display. 2. A displayed symbol that acts
as a marker to help the user locate a
point in text, in a system command, or in
storage. 3. A movable spot of light on the
screen of a display device, usually indicating where the next character is to be
entered, replaced, or deleted.
Cut-Through Application. A Graphics
System application that allows simultaneous access to several different computers from a single workstation. Direct
access to a host by way of a terminal
emulation program in StarKeeper II
NMS.
Cyclic Redundancy Check (CRC). A common method of establishing that data
was correctly received in data communications. A check performed on data to
determine if an error has occurred in the
transmitting, reading, or writing of the
data.
D
database. A collection of data that can be
immediately accessed and operated
upon by a data processing system for a
specific purpose.
database conversion. Upgrading a
machine running a previous release of
GL-4
StarKeeper II NMS to the latest release
of StarKeeper II NMS.
Datakit Applications Processor (DKAP).
A programmable module for customized
applications.
Datakit II VCS Host Interface Software.
Multiplexed host software that enables a
host connection to the node's Computer
Port Module (CPM).
Datakit II Virtual Circuit Switch (VCS). A
multiple feature data switch that provides
high-speed data communication
between different networks and various
computer equipment. The switch can
connect local area networks to wide
area networks, and can be used in a
single building or an environment with
multiple buildings such as a college campus; it can also connect multiple campuses or businesses nationwide. Each
Datakit II VCS switch is called a node.
DCE. An abbreviation for Data Communication Equipment. Usually a modem.
DDS. An abbreviation for Digital Data System (ACCUNET DATAPHONE Data
Service).
diagnostic. Pertaining to the detection and
isolation of a malfunction or mistake.
Digital Data Service (DDS). Digital transmission carrier service.
direct connection. A connection in which
a StarKeeper II NMS host computer is
cabled directly to a remote element with
RS-232-C (port B on a BNS-2000 or
BNS-2000 VCS node).
Disk Cleaner Administration Application. A feature that allows a Workstation
Administrator to monitor disk storage
space and remove directories/files.
disk crash. A malfunction that may result
in loss of data or an inoperable system
due to unreadable sectors.
StarKeeper II NMS Graphics System Guide, R10.0, Issue 1
Glossary
DKAP. An abbreviation for Datakit Applications Processor.
nected to StarKeeper II NMS via the Uniform Alarm Interface (UAI).
DLCI. An abbreviation for Data link connection identifier (frame relay) .
EMS. An abbreviation for Element Management System.
DN. An abbreviation for Distinguished
name (SMDS); Data Networking.
end user. Designates a terminal user in the
network or, the user who is operating
one of the optional graphics-based applications.
DNIC. An abbreviation for Data Network
Identification Code as used in X.121
addressing.
download. From the viewpoint of the reference computer or node, the act of
receiving data from another computer.
Choosing the download option in some
communications programs automatically erases a file of the same name that
was meant for transmission. See
upload.
DTE. An abbreviation for Data Terminating
Equipment. Usually a terminal or computer.
DTF. An abbreviation for Digital transmission facility (DS1/DS3) .
DXI. An abbreviation for Data Exchange
Interface (SMDS) .
DXI/SNI. An abbreviation for Data
Exchange Interface/Subscriber Network
Interface (SMDS) .
E
EBIM. An abbreviation for Ethernet Bridge
Interface Module.
EGA. An abbreviation for Enhanced graphics adapter.
EISA. An abbreviation for Extended Industry Standard Architecture.
Element Management System (EMS). A
system designed to manage a specific
element or group of elements in a network, other than BNS-2000 or BNS-2000
VCS nodes. An EMS sends alarms to a
user's workstation that is logically con-
envelope. A 10-bit value containing a data
or control byte, a control bit, and a parity bit.
EPN. An abbreviation for endpoint number,
which is part of the X.121 addressing
scheme.
error message. A response from a program indicating that a problem has
arisen or something unexpected has
happened, requiring attention.
Ethernet Bridge Interface Module
(EBIM). An interface module that supports LAN bridging for Ethernet environments.
exchange. Part of the node destination
code used in the addressing scheme.
See also network, area, and local service address.
exit. To leave the operations of a program
or a routine of a program.
F
factory default. Parameters defined and
set prior to shipment that may or may not
be changed or customized.
FCC. An abbreviation for Federal Communications Commission.
FEP. An abbreviation for Front-end processor.
female connector. A cable connector in
which the conducting elements are
embedded in recessed sockets designed
to receive complementary male parts
such as a pin or prong.
StarKeeper II NMS Graphics System Guide, R10.0, Issue 1
GL-5
Glossary
First-in, First-out (FIFO). A queue that
interprets and processes messages, one
by one, in the order in which they arrive.
floppy disk drive. A device that reads and
writes information on a floppy diskette.
format. 1. To prepare a new floppy diskette
or hard disk for use with the computer. 2.
The way data is displayed. Pertains to
the way data appears on the screen or
on printed copy.
Frame Relay. A data service incorporating
basic aspects of CCITT's LAPD protocol.
It is used as one means of providing LAN
interconnect service over packet switching networks.
Frame Relay Module (FRM). A node module providing a standard-based multiplexed interface to routers and gateways
from other FRMs resident on the network.
FRM. An abbreviation for Frame Relay
Module.
front end processor (FEP). A computer
under the control of another, larger computer in a communications network. The
FEP performs basic housekeeping operations on data streams as they arrive to
be processed by the larger computer.
function keys. Numbered keys (F1, F2,
and so forth) located on the side or
across the top of a keyboard, programmed to perform specific commands
with a single keystroke.
G
gateway. A conceptual or logical network
station that serves to interconnect two
otherwise incompatible networks, nodes,
subnetworks, or devices; performs a protocol-conversion operation across a wide
spectrum of communications functions,
or layers.
GB. An abbreviation for “gigabyte.” A
gigabyte equals 1000 megabytes.
Graphics System. A separate processor
that contains graphics capabilities to run
application packages.
Graphics System Platform. A base software package on which all optional,
graphics-based StarKeeper II NMS
application packages are installed.
group. A database component identifying a
set of ports or channels that are considered a unit. There are two kinds of
groups: local (can include any module
except a trunk) and trunk (can include
only trunk modules).
group name. An identifying label for a
database element consisting of a set of
ports.
GUI. An abbreviation for Graphical user
interface.
H
hardcopy. Printed characters on paper.
Any off-line documentation.
HDLC. An abbreviation for High Level Data
Link Control.
help. A StarKeeper II NMS interface that
provides on-screen assistance. Each
application supplies help for its own
application functions and elements.
High Level Data Link Control. A link-layer,
bit-oriented synchronous data communications protocol included in the X.25
packet-switching protocol.
High-speed Trunk (HS-TRUNK). A highspeed trunk module in the node or in a
SAM64/504.
hop. The logical distance between one
node and an adjacent node, at the routing layer.
hop count. The number of nodes a call
setup attempt traverses.
GL-6
StarKeeper II NMS Graphics System Guide, R10.0, Issue 1
Glossary
interface. XA-SMDS and intercompany
serving arrangements are available via
the ICI. Since the ICI is an open interface, networks can interconnect with
other vendors' SMDS networks, provided
those networks comply with the proper
requirements.
host computer. A computer attached to a
network that provides services such as
computation, database access, or special programs system languages.
host connection. A connection in which a
StarKeeper II NMS host computer is
connected to a node by a fiber optic
cable.
Host Interface Software, Datakit II VCS.
Multiplexed host software that enables
the host connection to a node's Computer Port Module (CPM).
HP. An abbreviation for Hewlett-Packard.
HP-UX system. A general-purpose,
multi-user, interactive, time-sharing operating system used with your computer.
HS (High Speed). See Trunk-HS.
HS-TRK. An abbreviation for High Speed–
Trunk (link) module (in SAM64/504).
hub node. The network node to which the
StarKeeper II NMS host computer is
connected.
hunt group. The association of a list of
receiving devices with a single service
address.
Hz. An abbreviation for Hertz.
I
ICI. An abbreviation for Inter-Carrier Interface.
ID. An abbreviation for identification.
init. An abbreviation for initialize.
interactive. The ability to interact with a
computer, or to be in a conversational
mode with a computer. Interactive processing is time dependent, since a user
is waiting for the computer to ask questions and the user responds to the questions.
Inter-Carrier Interface (ICI) The Inter-Carrier Interface is a network-to-network
interface. The relationship between communicating modules, usually in the same
node; between different computers; and
also the method of access between a
program and an end user.
interface module. A printed-circuit board
providing network access for a specific
type of end device.
interrupt. A suspension of a process, such
as the execution of a computer program,
caused by an event external to that process and performed in such a way that
the process can be resumed.
ISDN. CCITT Recommendation. An abbreviation for Integrated Services Digital
Network.
J
jumper block. An electrical connector
designed to form a connection, or
jumper, between corresponding pins on
a jumper strip.
jumper strip. A component on a printed
circuit board that contains pairs of pins
that can receive jumper blocks to set
hardware options for the board.
K
KB. An abbreviation for kilobytes.
Kbps. An abbreviation for Kilobits per second.
keyboard. Commonly used input device.
L
LAN. An abbreviation for Local area network.
StarKeeper II NMS Graphics System Guide, R10.0, Issue 1
GL-7
Glossary
LCS. An abbreviation for LAN Communication System(s).
LPM. An abbreviation for LAN Protocol
Module.
legend. A set of symbols a user selects
and places on network maps to represent network equipment.
M
LIM. An abbreviation for Link Interface
Module.
link interface module (LIM). A trunk module (SFT or SWT) that connects concentrators to the node.
listener address. The address recognized
by a StarKeeper II NMS Core System’s
listener process. This address must be
entered into the database of the node(s)
that provides Datakit II VCS Host Interface Access to the Core System.
local area network (LAN). A data network
with communicating devices and connection media that occupy a single geographic location.
local listener address. The address that
the listener process on the local machine
responds to when a remote StarKeeper
II NMS attempts to establish a connection to the local machine. The local listener address must be fully qualified and
entered as a service address in the
BNS-2000 VCS node that provides network connectivity to the local machine.
local machine ID. An integer between 1
and 100, inclusive, and unique among
other StarKeeper II NMS machines
within the StarKeeper II NMS network.
The assignment of the local machine ID
must be made with consideration of the
machine IDs assigned to the other StarKeeper II NMS machines that comprise
the network.
local service address. Part of the BNS2000 VCS (R2.0 and later) addressing
scheme that refers to endpoints or a host
on a network that receive calls. See
addressing. Also see network, area,
and exchange.
GL-8
MAC protocol. An abbreviation for Media
Access Control (IEEE 802); Master
Alarm Collector (StarKeeper II NMS).
machine. A generic term for a computer or
workstation.
machine ID. See local machine ID.
Maintenance and Redundancy Control
Module (MRCM). An (optional) intelligent module that monitors the operational state of the control computers in a
node; a multiport administrative interface that gives enhanced maintenance
and automatic recovery capabilities to a
node.
male connector. A cable connector in
which the connections are made with
pins or prongs that fit into complementary receptacles in a female connector.
Master Alarm Collector (MAC). A StarKeeper II NMS configured to receive and
collect alarm messages from other network and element management systems.
MB. An abbreviation for megabyte(s).
Mbps. An abbreviation for megabits per
second.
message of the day. A node feature that
allows the network administrator to send
up to three lines of text to terminal users
when they connect to the network.
meta-characters. Special keyboard characters used in StarKeeper II NMS for
searches (patterns matching) and substitutions.
message units. Can be either packets or
segments; depends on the type of node
from which this data was collected.
StarKeeper II NMS Graphics System Guide, R10.0, Issue 1
Glossary
modem (modulator-demodulator). A
device pair that allows a terminal user to
communicate with network services over
telephone lines.
M1. Series M1 shelf (BNS-2000).
monitor. 1. A device for visual presentation
of information as temporary images. A
video display. 2. Syn: cathode ray tube
display.
MPC. An abbreviation for Multipurpose
Concentrator.
MRCM. An abbreviation for Maintenance
and Redundancy Control Module.
MRCM connection. A connection type in
which a connection is made to the
MRCM module.
MS-DOS . An abbreviation for Microsoft
Disk Operating System.
multiplexer. A device that allows multiple
devices to communicate with hosts,
public data networks, or a data switch.
Multipurpose Concentrator. A concentrator consisting of a modular cabinet
without a Control Computer. Connects
to the node via optical fiber or wire
trunk, and has interface slots for TY12,
BA12, TSM8, CPM-HS, CPM-422B,
Sync8, and X.25 modules. Two types of
Multipurpose Concentrators are available: 7-slot and 15-slot.
MUX. An abbreviation for multiplexer.
N
NAC. An abbreviation for Network Access
Controller (Network Access Control System) .
NB. An abbreviation for Network Builder
(StarKeeper II NMS) .
Netstation. A supported device, on a Local
Area Network, that supports StarKeeper
II NMS graphics application packages.
network. 1. The interconnection of a number of points (nodes, computers, terminals, and so forth) by communications
facilities. 2. Part of the BNS-2000 VCS
addressing scheme that is equivalent to
the overall network name. See addressing. Also see area; exchange; service
address.
network address. A StarKeeper II NMS
representation, input by keyboard characters, of a specified network element.
The network address positively identifies
the component. Often abbreviated
netaddr.
network administrator. Individual responsible for the operation, administration,
and maintenance of a network.
Network Builder. StarKeeper II NMS
Graphics application used for configuration management and analysis. The
application provides a Forms Interface to
configure network elements.
network connection. A connection in
which a StarKeeper II NMS host computer is cabled to a TY port on a node
and uses the node to connect to a
remote element.
network elements. The equipment and
services that comprise a data communications network.
Network Management System (NMS). A
centralized system used to operate,
administer, and maintain an entire data
communications network.
Network Monitor. StarKeeper II NMS
Graphics application used for fault
management by providing alarms and
diagnostics capabilities on geographic
network maps. The application provides
an easy-to-use map editor and can
generate maps automatically.
NM. An abbreviation for Network management; network manager; Network Monitor (StarKeeper II NMS) .
StarKeeper II NMS Graphics System Guide, R10.0, Issue 1
GL-9
Glossary
NMS. An abbreviation for Network Management System .
node. 1. One or more BNS-2000 or BNS2000 VCS cabinets containing a Control
Computer, one Clock module, and one
Switch module. 2. All backplanes sharing a transmit and a receive bus, connected by Repeater modules.
O
operating system. The software that controls and allocates the resources, such
as memory, disk storage and the screen
display for the computer.
option. An addition to a command to
improve or provide an extra enhancement to the command. The option is usually depicted with a minus (-) sign in front
of it.
originating group. The type of group
assigned to devices, such as data terminals, that can initiate calls to other
devices.
OS. An abbreviation for operating system.
overhead. All information, such as control,
routing, and error-checking characters,
that is in addition to user-transmitted
data; includes information that carries
network status or operational instructions, network routing information, as
well as retransmissions of user-data
messages.
P
packet. A unit of data transmitted through a
network.
packet assembler/disassembler (PAD). A
device that disassembles data for transmission and assembles it at data reception. A node performs PAD functions to
connect the node to a PDN or X.25 host.
PAD. An abbreviation for Packet assembler/
disassembler .
GL-10
paddle board. The input/output distribution
board at the rear of the node or concentrator cabinet that provides external connections to the interface modules.
parameter. 1. A variable that is given a
constant value for a specified application
and that may denote the application. 2. A
name in a procedure that is used to refer
to an argument passed to that procedure.
parity. Addition of non-information bits to
data, making the number of ones in each
grouping of bits either always odd (for
odd parity), or always even (for even parity). This permits detection of a single-bit
error in each transmitted or stored character.
parity bit. An extra bit added to a byte,
character, or word to ensure that there is
always either an even or odd number of
bits according to the logic of the system.
If, through a hardware failure, a bit
should be lost in transmission, its loss
can be detected by checking the parity.
The same bit pattern remains as long as
the contents of the byte, character, or
word remain unchanged.
parity error (PE). A signal that flags a parity bit error.
partition. A section of the hard disk used to
store an operating system and data files
or programs. By dividing the disk into
partitions, the space allocated can be
used in a more efficient and organized
manner.
partitioned user. A StarKeeper II NMS
user with a login on the system and
access the commands specified by the
network administrator.
PC. An abbreviation for Personal computer.
PDN. An abbreviation for Public Data Network.
PE. An abbreviation for Parity error.
StarKeeper II NMS Graphics System Guide, R10.0, Issue 1
Glossary
performance connection. A connection in
which performance measurement data is
collected from nodes.
Performance Reporter. StarKeeper II
NMS Graphics application used for routine assurance and long term engineering. Error counts, indicators, and
thresholding are provided, as well as
performance reports for trunk utilization
and connections.
pipelining. The transmission of synchronous data as it arrives at the network
interface, without waiting until a frame is
filled.
port. An access point for data entry or exit.
PQ (Priority Queuing). See Trunk-PQ.
PR. An abbreviation for Performance
Reporter.
predefined destination (PDD). An administered association of a fixed network
destination with an originating end
device, resulting in an automatic call
setup request as soon as the originating
device comes on-line. Compare virtual
circuit.
printer sharing. An arrangement in which
two or more Systems share the use of a
printer by sending files through the wide
area network to the spooling host that
has a direct connection to the printer.
program. See application.
Programmer's Interface. A StarKeeper II
NMS feature that allows the development of custom application programs
through the use of scripting tools.
protocol. A formal set of rules governing
message exchange between two communicating devices.
PVC. An abbreviation for Permanent virtual
circuit.
Q
query. A request for information (displayed
on the terminal screen) from the system
that requires a response from the user.
queue. A line or list formed by items in a
system waiting for service.
R
RAM. An abbreviation for Random access
memory.
reboot. To reinitialize the operating system
and StarKeeper II NMS.
receiving group. The type of group
assigned to devices, such as host computers, that can receive calls from other
devices connected to the node.
remote StarKeeper NMS. 1. A pre-R3.0
version acting as a subordinate to a
Master Alarm Collector. 2. In a distributed StarKeeper II NMS environment,
The machine you are administering is
viewed as the local machine and any
other machine is a remote StarKeeper II
NMS.
reverse video. A form of highlighting a
character, field, or cursor by reversing
the color of the character, field, or cursor
with its background; for example, changing a red character on a black background to a black character on a red
background.
root. The superuser login ID. You must log
in as root to install software or to perform system administration tasks.
RS-232-C. An EIA standard for data
communications, describing the
electrical, mechanical, and functional
characteristics of the connections
between devices exchanging data in
serial binary form. RS-232-C
connections are those cables and
connectors conforming to this standard.
StarKeeper II NMS Graphics System Guide, R10.0, Issue 1
GL-11
Glossary
S
SA. An abbreviation for Source address
(SMDS); Service Area (X.121).
SAM. An abbreviation for Synchronous/
Asynchronous Multiplexer.
SAMML. A Synchronous/Asynchronous
Multiplexer Multiport Link.
SAM Multiport Link. An interface module
in a node providing connection to up to 8
SAMs.
SAMSL. A Synchronous/Asynchronous
Multiplexer Single Link.
SAM16. An abbreviation for Synchronous/
Asynchronous Multiplexer 16-port.
SAM64. An abbreviation for Synchronous/
Asynchronous Multiplexer 64-port.
screen blanking. A feature that causes a
screen to go blank if no keyboard or
mouse input occurs within a specified
number of minutes.
SCP. An abbreviation for Seamless Communication Platform.
SCSI. See Small Computer System Interface.
SDLC. See Synchronous Data Link Control.
SDLC8. See Synchronous Data Link
Control Module, 8-port.
SDS. An abbreviation for Software Disk
Stripping.
SFT. An abbreviation for Standard Fiber
Trunk (interface module) .
segment. A protocol data unit of 53 octets.
select. To choose an object or objects on
the screen for which an action is
intended.
server. A machine in a network that provides a particular service to other
GL-12
machines; for example, a database
server manages a large database.
service address. An administered identifier for a destination in the BNS-2000
VCS network.
Session Maintenance. A feature that provides data transport reliability over internodal trunks between ECPU Systems in
BNS-2000 and BNS-2000 VCS networks.
setup. 1. In a computer that consists of an
assembly of individual computing units,
the arrangement of interconnections
between the units, and the adjustments
needed for the computer to operate. 2.
The preparation of the system for normal
operation.
shelf. A carrier inside a cabinet that contains a backplane and other hardware.
It supports the insertion of modules into
the backplane.
SIG. An abbreviation for SMDS Interest
Group.
Small Computer Systems Interface
(SCSI). Pertaining to the ANSI-defined
standard for attaching intelligent peripherals to computers.
SMDS. An abbreviation for Switched Multimegabit Data Service.
SNA. An abbreviation for System Network
Architecture.
SNI. An abbreviation for Subscriber Network Interface.
SNMP. An abbreviation for Simple Network
Management Protocol (Internet/TCP/IP
standard).
Software Package System. StarKeeper II
NMS software that is sent to the customer, who installs it on his or her own
hardware.
SP. An abbreviation for Software Package.
StarKeeper II NMS Graphics System Guide, R10.0, Issue 1
Glossary
speedcall. An administered shortened
name or short code for a network destination address.
spooling host. The computer with a direct
connection to the printer when two or
more systems share the same printer. In
a client-server model, the spooling host
is a print server.
SQL. An abbreviation for Structured Query
Language.
SR. An abbreviation for Special report
(SMDS); Service Region (X.121) .
SS. An abbreviation for Staged System.
Staged System. A StarKeeper II NMS system shipped from the factory equipped
with specified software and host connection hardware.
Standard Fiber Trunk (SFT). An interface
module for an optical fiber connection
between two nodes, a node and an
MPC.
Standard Wire Trunk (SWT). An interface
module for a wire connection between
two nodes or a node and a concentrator.
StarGROUP®. A star network configuration
that connects Local Area Networks.
StarGROUP Interface Module–Bridge
(SLIM-B). An interface module that
supports LAN bridging.
StarGROUP Software VCS Access Program. Asynchronous gateway server.
StarKeeper® II Network Management
System (NMS). A centralized system
used to view an entire network and monitor, control, configure, and diagnose any
node in the network.
StarKeeper II NMS connection. A connection type in which the transfer of configuration information between StarKeeper
II NMS machines is permitted.
Subscriber Network Interface (SNI) The
SNI is the interface between a carrier's
SMDS network and the subscriberowned, Customer Premises Equipment
(CPE). At this interface, the CPE
attaches to an access facility—such as a
DS1 digital transmission facility (DTF)—
that connects it via a dedicated path to
the AI module.
superuser. A user with OS administrative
privileges.
supported applications. Applications for
which Lucent Technologies provides
telephone hot line assistance and client-site software support.
SVC. An abbreviation for Switched virtual
circuit; service connection(s) .
SWT. An abbreviation for Standard Wire
Trunk (interface module) .
Switched Multimegabit Data Service
(SMDS) A high-speed, connectionless,
public packet-switched service. SMDS
can interconnect local area networks
(LANs) through a wide area network
(WAN) or across a metropolitan area to
form a metropolitan area network (MAN)
using a network-to-network interface
called an Intercarrier Interface (ICI).
When using SMDS across a wide area
network, multiple carriers and multiple
networks are interconnected.
synchronous. Transmission in which the
data characters and bits are sent at a
fixed rate with the transmitter and
receiver synchronized. Compare asynchronous.
Synchronous Data Link Control (SDLC).
A link-layer, bit oriented protocol, similar
to HDLC, used primarily by IBM devices.
Synchronous Data Link Control Module,
8-port (SDLC8). An interface module for
SNA/SDLC hosts to the network, used in
conjunction with the LAN Communications System (LCS100 Network Gate-
StarKeeper II NMS Graphics System Guide, R10.0, Issue 1
GL-13
Glossary
way). Multiple LCSs can originate and
receive circuit calls through a CPMML to
a single SDLC8 port.
syntax. The format of a command line.
T
terminal emulator. An application that
makes the host terminal appear to be
another type of terminal; this change of
appearance is for the benefit of the connecting device, which recognizes the terminal being emulated.
text field. An area in a window where text
is entered from the keyboard.
toggle. 1. The name given to a switch that
changes for every input pulse or, any
simple two-position switch. 2. The action
of going back and forth between two
conditions.
T1. A digital carrier (wire transmission)
facility providing 1.544 Mbps of bandwidth (2 Mbps. internationally).
T1 Trunk. A module in the SAM64,
SAM504, or VDM-SAM504 that is a
counterpart to the TRUNK-T1 module in
the node.
Transparent Synchronous Module
(TSM8). A transparent synchronous
8-port interface module that supports
synchronous or asynchronous communication.
TRK. An abbreviation, on a screen, for
trunk.
trm. An abbreviation for terminal emulation
software (StarKeeper II NMS) .
troubleshooting. The process of finding
the cause of a problem in a system and
taking actions to fix the problem.
trunk. A facility connecting two nodes.
TRKE3S. A Trunk-E3 SMDS interface module to a T1 transmission facility between
two nodes.
GL-14
TRKT3. A Trunk-T3 interface module that
supports connection-oriented (CONS)
and connectionless traffic between
nodes at transmission speeds up to T3.
TRKT3I. A Trunk-T3 Interexchange connection-oriented and connectionless ICI
interface module.
TRKT3. A Trunk-T3 Screening connection-oriented and connectionless SMDS
interface module.
TRK64. A wire interface module that provides communications between nodes
over a Digital Data Service (DDS) line,
using one of two I/O boards (AWJ9,
AWJ11).
Trunk-DDS. A Digital Data Service (DDS)
trunk module consisting of a single-board processor (MC5P033A1) and
an SC/DK1 interface board (UN221).
The SC/DK1 board is on the left side of
the module and contains the module
switches and LEDs.
Trunk-HS. A High Speed (HS) fiber
interface module that uses the AWJ2 I/O
board to provide connections between
nodes as well as connections between
nodes and SAM504 and SAM64
modules. The counterpart for the
Trunk-HS in the SAMs is the HS-Trunk
module. Refer to the Synchronous/
Asynchronous Multiplexer Reference for
a description of the HS-Trunk module.
Trunk-PQ. A Priority Queuing (PQ) single
port wire interface module that provides
fair queuing and enhanced buffering for
multi-protocol traffic, and enforcement of
Committed Information Rate (CIR) for
frame relay traffic at up to T1/E1 rates.
The AWJ24 I/) board provides a V.35
DTE connection to the external device.
Trunk-SFT. A Standard Fiber Trunk interface module that links nodes over fiber
optic cable to other nodes and to MPCs.
The maximum cable length for fiber
trunks is 2.91 km.
StarKeeper II NMS Graphics System Guide, R10.0, Issue 1
Glossary
Trunk-SWT. A Standard Wire Trunk interface module for wire trunks between
nodes and from nodes to MPCs. A variety of connections can be made by
selecting the appropriate I/O board. For
more detail, refer to the BNS-2000 VCS
Trunk Module Reference Trunk Module
Installation.
Trunk-T1. An interface module for wire
trunks that provide long-distance,
high-speed point-to-point communication
over a T1 digital transmission facility
between nodes. The Trunk-T1 module is
used with an AWJ4 I/O board that provides
TSM8. See Transparent Synchronous
Module (TSM8).
TSM-T1. A transparent synchronous T1
interface module.
two-way (2-way) group. The type of group
assigned to devices that can originate
and receive calls to and from a node.
turnkey shutdown. The capability to automatically log off of application programs
on system shutdown.
TY12. A 12-port asynchronous interface
module.
U
UAI. An abbreviation for Uniform Alarm
Interface (StarKeeper II NMS) .
UART. An abbreviation for Universal asynchronous receiver/transmitter (integrated
circuit) .
uname. (unique name); the local HP-UX
machine name.
UNIX system. A general-purpose, multiuser, interactive, time-sharing operating
system used with your computer.
upgrade. The latest release of StarKeeper
II NMS to be installed on a system running an earlier release.
upload. From the viewpoint of the reference computer or node, the act of sending data to another computer or storage
device. See download.
utilities. A group of programs combined
into a package that represent a specific
application available with your computer.
USART. An abbreviation for universal
synchronous/asynchronous receiver/
terminal.
V
validation. The application’s verification
that the contents of a text field are appropriate to the function.
virtual circuit. A connection between a
source and destination in a network that
is realized by network addressing
through switching elements, as opposed
to a direct hardwired connection.
voice/data multiplexer (VDM). A device
that allows the sending and receiving of
simultaneous voice and data transmissions through existing telephone lines.
W
wide area network (WAN). A communications network that can cover an area with
a radius of greater than 3km.
wild card. A method, used in StarKeeper II
NMS network addressing, to expand the
matching criteria when searching for
specified records in the database. (Compare anchor).
Workstation Administration Application. A Graphics System application that
allows a Workstation Administrator to
oversee administrative tasks.
X
X.25. An interface module that supplies
X.25 services, allowing X.28 hosts and
asynchronous terminals to connect to a
StarKeeper II NMS Graphics System Guide, R10.0, Issue 1
GL-15
Glossary
public data network (PDN) or other X.28
hosts.
X.75. An interface module that supplies
X.75 services.
X.121. A CCITT recommendation for an
addressing scheme in Public Data Networks. (Part of the X.25 protocol.)
GL-16
StarKeeper II NMS Graphics System Guide, R10.0, Issue 1
Index
Symbols
$EVENTLOG, C-2
%AVG CPU UTIL, 17-29
%AVG LINE UTIL, 17-21
%AVG MAIN PROC BUSY, 17-29
%AVG UTIL, 17-11
%BUSY, 17-29
%EPS, 17-29
%EPT, 17-29
%I/O BD UTIL, 17-29
%OVERHEAD, 17-29
%PEAK CPU UTIL, 17-29
%PEAK LINE UTIL, 17-22
%PEAK MAIN PROC BUSY, 17-29
%PEAK UTIL, 17-11, 17-22
%PORT UTIL, 17-22
(I) INCOMPLETE INTERVAL, 17-11
A
ABNORMAL TERM, 17-29
ABORTS, 17-29
Activating connections
night fold-down, 11-22
Add Background Text
user reference, 12-27
Add Equipment
user reference, 12-22
Adding a Netstation to a host server, 2-15
Adding Scratch Pad Information, 10-46
Adding Trunks and Labels, 10-44
Adding users, 10-1
Additional reroute requests (Session Maintenance simulation), 9-69
Add-On Computers property window
Cut-through Application, 6-7
Addresses
special, 8-67
Addressing
Link Level, Netstation, 2-15
Network Level, Netstation, 2-15
scheme
hierarchical, 10-4
Administer Maps user reference, 12-11
Administer Menu, Set Alarm List Preferences, 12-7
Administer Property Window, 7-2
Administering connections, 2-8
Administration, 10-1, 13-1
and maintenance, 1-26
connection class, 8-32
Netstation, 2-17
Network Builder, 7-1, 8-1
Administration tutorial
Phase II, overview, 10-22
purpose, 10-2
Administrator
network, xxxvii
Aggregate location symbols
adding, 10-27
adding labels, 10-30
planning, 10-13
trunk, 10-17
AI TYPE, 17-22, 17-29
AIS SECS, 17-29
Alarm Collector process error messages, C-21
Alarm severity notices, 1-19, 12-32
checking, 11-8, 11-15
user reference, 12-32
Alarms
clearing, 11-14, 11-21, 12-5, 12-35, 12-40
collection, xxxvii
color-coding, 1-20
colors, 12-32
detailed information, 11-16
filters
file format, 10-60, 10-61
negative, 10-60
positive, 10-60
specifying, 10-60
synchronizing, 10-62
format
user reference, 12-7
freezing, 12-42
help, 11-17, 12-42
user reference, 12-42
Alt. File Server
net config field, 2-18
Alt. Name Server
net config field, 2-18
Analysis, 9-1
address level, 9-9
invalid model, 9-9
overall functions, 9-1
trunk group constraint, 9-9
Analyze
a new network, 9-23
existing network, 9-35
menu description, 1-14
Any Alarm
user reference, 12-41
Application administration
Workstation Administration starting, 5-1
Area
Node field, 8-41
Assisting Nodes
NRT field, 8-73
StarKeeper II NMS Graphics System Guide, R10.0, Issue 1
Index-1
Index
authorize command, 10-63
Automatic labeling, 10-12
Automatic login setup
Cut-through Application, 6-5
AVG BUFFER UTIL, 17-29
AVG FRAME SIZE, 17-22
Awaiting Retry (task status definition), 8-13
B
Babbling Port Removal
Node field, 8-46
Babbling Signal Alarms
Node field, 8-46
Background
adding, 10-26, 10-39
adding text, 12-26
editing text, 12-27
List of, 10-10
setting, 12-21
Background Text
user reference, 12-26
BAD CRC, 17-29
BAD FCS, 17-29
BAD FRAMES, 17-29
Bandwidth Utilization Link Report
example, 17-9, 17-10
Bandwidth Utilization Node Report, 17-6
Bandwidth utilization reports, 1-28, 17-5
Bandwidth utilization shelf report
example, 17-11
Bandwidth Utilization Trunk Report, 17-8
Base window
workstation administration, 5-2
BER6 SECS, 17-29
Billing
SNI field, 8-79
Billing connection class
described, 8-31
Billing Data Storage, 8-70
Blocked path, 9-7
BNS-2000 alarms
user notices, 10-58
BNS-2000 documentation, xliv
BNS-2000 VCS documentation, xliv
BNS-microSwitch Access
SNI field, 8-79
BP PARITY ERROR, 17-29
Broadcast Message
Node field, 8-40
BUFFER NOT AVAIL, 17-29
Building a map hierarchy
creating Top Map, 10-26
overview, 10-22
setting up Connections, 10-23
starting Map Editor, 10-24
Index-2
starting Network Monitor, 10-24
synchronizing database(s), 10-23
button
Delete, 8-29
Edit, 8-29
Insert, 8-29
C
Call Screening Profile ID
Trunk field, 8-55
Call trace static, 9-7
Call-blocking path condition, 9-4
Call-looping condition, 9-4
CALLS ABN TERM, 17-29
Cancel Delete (configuration File menu), 8-9
Cancel Update (configuration File menu), 8-9
Canceled (task status definition), 8-13
Carrier
Trunk field, 8-55
CARRIER COUNT, 17-29
C-Bit Mode
Trunk field, 8-55
cfg_sync
StarKeeper command, 8-2, 8-32, 10-23
Change Others with Same Pattern, 8-68, 8-70
Channel
user reference, 12-46
CHANNEL ERROR, 17-29
Checking Network Alarm Severity notices, 11-15
Checking Network Status Window, 11-8
Checking user notices, 11-15
Checklist for testing maps, 10-55
Choose command windows, 8-27
CIR From Local
frame relay field, 8-137
CIR From Remote
frame relay field, 8-137
Clear Alarms
process error messages, C-24
user reference, 12-5, 12-35, 12-40
Clearing
Edit Maps Window, 12-16
Clearing alarms, 11-14, 11-21, 12-35
forced clear, 12-40
from Control Window, 12-5
from List Alarms Window, 12-40
from Network Map Window, 12-35
Closed User Group Security, 8-67
CODE VIOL, 17-29
Color-code for alarms, 1-20
Colors
alarms, 12-32
StarKeeper II NMS Graphics System Guide, R10.0, Issue 1
Index
Commands, 2-5
copymaps, 10-64
diagnostic
node, 1-16
disp traffic, 1-16
edit_maps, 10-1
node, 12-43
Commands Menu
user reference, 12-34, 12-39
Committed Burst Local
frame relay field, 8-138
Committed Burst Remote
frame relay field, 8-138
Committed data, 9-3, 9-8
Completed path, 9-7
Completed Successfully (task status definition), 8-13
Component Address
user reference, 12-45
Concentrators/SAMs
adding, 10-42, 10-49
Configuration Activity Log
operator tips, 8-26
Configuration data
updating, 13-8
Configuration form, 8-10
accessing, 8-16, 8-20
changing data, 8-21
populating, 8-17
submitting the update, 8-17, 8-22
verifying data, 8-21
Configuration Report, 8-84
Confirmation Notices, 8-14
conn_sync
StarKeeper command, 8-38
Connecting symbols
adding, 10-45, 10-49
Connection classes
described, 8-31
NMS Connections field, 8-35
Connection configuration
when adding a new node, 8-33
Connection utilization node report
example, 17-18
Connection utilization receiving group report
example, 17-14
Connection utilization reports, 1-29, 17-6
Connection utilization trunk group report
example, 17-16
Connection utilization X.25 report
example, 17-17
Connection window
Cut-through Application, 6-4
Connections
(NMS) configuration, 8-31
administering, 2-8
Administration, 8-32
Billing, 8-31
Console, 8-31
data synchronizing, 2-12, 5-6
Dial Backup, 8-32
for optional applications, 8-33
MRCM Maint, 8-32
NMS, background data, 8-31
Performance, 8-32
Connections data pane (NMS standard), 8-35
Connections status
listener address, 5-4
status flag, 5-4
uname, 5-4
Connectivity, 9-5
Connectivity analysis, 9-2
base window, 9-10
base window edit controls, 9-16
data sources, 9-1
example, 9-78
File menu, 9-11
implementing recommendations, 9-35
input reports, 9-43
output reports, 9-47
procedures, 9-21
report viewing windows, 9-14
Run menu, 9-11
user interface controls, 9-10
View menu, 9-12
Connectivity analysis tools
constraints and limitations, 9-8
overall functions, 9-2
using the, 9-8
Console Password
NMS Connections field, 8-35
Control Window
clearing alarms, 12-5
functions, 1-18
introduction, 1-18
user reference, 12-2
Copy feature, 8-25
copymaps command, 10-64
Crankback path, 9-7
CRC ERROR, 17-30
cron command, 8-2
CUG Profile ID
Service Address field, 8-68
Current Data
operator tip, 8-25
Current Password
change Node field, 8-45
Cut-Through, 8-29
Cut-through administration window, 5-11
Cut-through Application, 8-29
Add-On Computers property window, 6-7
Connection window, 6-4
Properties menu button, 6-3
setup for automatic login, 6-5
starting, 6-1
StarKeeper II NMS Graphics System Guide, R10.0, Issue 1
Index-3
Index
D
Daily exception report - detail, 14-5
Daily exception report - summary, 14-2
Daily exception reports, 1-24
DATA BYTES, 17-22, 17-30
Data panes, 8-11
Database Audits, 8-89
Database Management Concerns, 8-89
Database Validation report, 9-45
review, 9-25
screen, 9-46
Deactivating connections
night fold-down, 11-22
Dead-end condition, 9-4
Dead-end path
final hop in, 9-54
Defaults control
operator tip, 8-25
Define User Notices Window, 10-57
Defining user notices, 10-56
user reference, 12-9
Delete (configuration File menu), 8-8
Delete button, 8-29
Delete Object
user reference, 12-19
Delete operation
choosing, 8-22
Configure menu, 8-7, 8-14
executing, 8-23
Deleting objects, 12-19
Design
create, 9-36
current, 9-3
in connectivity analysis, 9-3
load, 9-36, 9-40
maximum number of, 9-3
name, 9-3
saved, 9-3
Designs
evaluating in parallel, 9-35
Destination
Trunk field, 8-55
Destination address, 9-15
Destination routing report, 9-30, 9-54
with error-free routing, screen, 9-85
Detailed maps
choosing, 10-16
displaying map of node, 11-11
Detailed maps of nodes, 10-16
Detailed maps of trunks, 10-17
Detailed report, 9-69, 9-74
diagnose command and Diagnostics Window, 11-20
Diagnosing faults, 1-16
Diagnostics
user reference, 12-36, 12-40
Index-4
Diagnostics commands, 1-16, 12-43
Diagnostics Window, 12-36, 12-40, 12-43
characteristics, 1-22
error messages, C-16
introduction, 1-22
user reference, 12-43
using, 11-18
using the diagnose command, 11-20
using the dstat command, 11-19
Dial Backup connection class
described, 8-32
Dial String
Service Address field, 8-69
Direction field
for local group, 8-25
Directory Entry
Service Address field, 8-68, 8-70
Disk Cleaner Administration application, 5-8
disp traffic command, 1-16
Display Detail
user reference, 12-39
Display info, 10-46, 12-28, 12-34
user reference, 12-34
Display Info Window error messages, C-18
Display Top Map
user reference, 12-32
Displaying alarm detail, 12-39
Displaying alarm help, 11-17
Displaying regional map, 11-9
Distributing network maps to other Graphics Systems,
10-63
DLCI ADDR, 17-30
Documentation
BNS-2000, xliv
BNS-2000 VCS, xliv
StarKeeper II NMS Core, xliv
Domain Name
net config field, 2-18
Down
user reference, 12-36
Download Server
frame relay field, 8-118, 8-121
Trunk field, 8-55
dstat command and Diagnostics Window, 11-19
DUPLEX, 17-22
E
E Bits
frame relay field, 8-118, 8-128
Edit
user reference, 12-18
Edit Background Text
user reference, 12-27
Edit button, 8-29
Edit Maps Window
StarKeeper II NMS Graphics System Guide, R10.0, Issue 1
Index
characteristics, 1-19
clearing, 12-16
Editor Legend, 10-27, 12-25
error messages, C-19
functions, 1-19
introduction, 1-19
invoking, 12-14
user reference, 12-11, 12-14
edit_maps command, 10-1
Editing alarm filter files, 10-60
Editing maps, 10-48, 10-51
adding aggregate location symbols, 10-27
adding background, 10-26, 10-39
adding Concentrators/SAMs, 10-42, 10-49, 12-23
adding labels, 10-30, 10-36, 10-43, 10-50
adding nodes, 10-40, 10-48, 12-23
adding other connecting symbols, 10-45, 10-49
adding other systems, 10-41
adding scratch pad information, 10-46
adding StarKeeper II NMS symbols, 10-31
adding trunk aggregate symbols, 10-35
adding trunks, 10-33, 10-43, 12-24
adding unmonitored objects, 10-49
creating top map, 10-26
moving labels, 10-35, 10-43
regional maps, 10-39
saving maps, 10-38, 10-48, 10-50
setting map pointers, 10-29, 10-36, 10-47
setting map titles, 10-37, 10-47, 10-50
Editor Legend
invoking, 10-27, 12-25
symbols
explanation, 12-26
EFT (see error free transmission), 14-14
Egress Download Server
Trunk field, 8-55
Egress MCDU
SNI field, 8-79
Egress Software Version
Trunk field, 8-55
Engineering Data, 9-69
equalization
frame relay field, 8-119, 8-128
Equipment
adding, 10-31, 10-33, 10-40, 10-42, 10-44, 10-45,
10-49, 10-51, 12-22
ERR SECS, 17-30
Error free transmission, 14-14
ERROR INTVLS, 17-30
Error messages, D-1
Alarm Collector process, C-21
Clear Alarms process, C-24
Diagnostics Window, C-16
Display Info Window, C-18
Edit Maps Window, C-19
how displayed, C-2
List Alarms Window, C-13
Network Builder, 8-12
Network Map Windows, C-11
Network Monitor Control Window, C-8
Network Status Windows, C-11
notice windows, C-2
reading, C-1
recommended actions, C-4
Shelf Map Generation process, C-25
Task Manager Bulletin Board, C-2
truncated list, 8-28
Errored Trunk Removal
Node field, 8-46
Ethernet Link Level Address, 2-15
Event log, C-2
Exception reports
accessing, 14-2
excluding items from, 13-7
including items from, 13-7
Excess Burst Local
frame relay field, 8-138
Exchange
Node field, 8-41
Exit, 12-6
Extended routing, 9-30, 9-37
Node field, 8-46
F
Factory reset of parameters, 7-3
Failed (task status definition), 8-13
Failed tasks
resubmitting, 8-26
Failed trunks
control (Session Maintenance simulation), 9-68
Failure, 9-8
Failure mode
control (Session Maintenance simulation), 9-68
Fault diagnosing, 1-16
Features
Performance Reporter, 1-23
FIFO INTRPT, 17-30
FIFO OVRFLW, 17-30
File
user reference, 12-15
File Menu
button, 8-6
user reference, 12-38
File Server
net config field, 2-18
Files
characteristics, 10-38
loading, 10-39, 10-48, 10-51, 12-16
Save Design command window
screen, 9-34
saving, 10-38, 10-48, 10-50, 12-15
filter_sync (Network Monitor command), 11-22
filter_sync command, 10-62
StarKeeper II NMS Graphics System Guide, R10.0, Issue 1
Index-5
Index
Find Map
user reference, 12-39
Forced clear, 12-40
FRAME BYTES, 17-22, 17-30
FRAME ERROR, 17-30
Frame Relay Report
example, 17-20
Frame Term Length
Trunk field, 8-56
FRAMES, 17-30
FRAMES DISCARDED, 17-30
framing format
frame relay field, 8-119, 8-128
Freeze and unfreeze
user reference, 12-42
Freezing alarms, 12-42
FRM FMT, 17-30
Front end processors (FEPs), 10-14, 10-48
Full Status Polling Counter
frame relay field, 8-124, 8-131
user reference, 12-41
Hierarchical addressing scheme, 10-4
High Level Protocol ID
Service Address field, 8-69
Highest severity alarm principle, 10-6
Hop Counting
Node field, 8-46
Hops
maximum number, 9-7
NRT field, 8-74
Host computer problem
example, 11-7
Host Server
adding a Netstation, 2-15
Hosts, 10-14
HP ENVIZEX station, 2-13
HP-UX system error codes, C-28
G
I/O Board
frame relay field, 8-119, 8-121
ICI Address Prefix
background data, 8-98
ICI Carrier
background information, 8-92
ICI Group Address, 8-103
background information, 8-104
reports, 8-106
In Progress (task status definition), 8-13
Individual Addresses
ICI Group Address field, 8-106
SNI field, 8-79
Ingress Download Server
Trunk field, 8-56
Ingress MCDU
SNI field, 8-79
Ingress Software Version
Trunk field, 8-56
Initial Routing
example, 9-80
Initial Topology Evaluation
example, 9-80
Input and output report data fields, 9-59
Input data
edit, 9-28
Input data panes, 9-3
Insert button, 8-29
Interactive bit-mapped graphical displays, 1-15
Interactive lists of alarm information, 1-16
INTRPTS, 17-30
INTVL, 17-11, 17-22, 17-30
Invalid model, 9-9
IP address, 2-15
IP protocol, 2-15
Gateway
net config field, 2-18
Generating shelf maps, 10-52
for concentrators/SAMs, 10-53
for nodes, 10-53
user reference, 12-12
Graphical option, 1-30
port capacity utilization reports, 17-23
Group
background information, 8-63
Group configuration, 1-10, 8-63
Group Name
frame relay field, 8-139
Service Address field, 8-68
Trunk field, 8-54, 8-56
Group Screening
SNI field, 8-82
Guidelines for monitoring a network, 11-4
H
Handling Conflicting Data, 8-89
Head Of Bus A
Trunk field, 8-56
Held (task status definition), 8-13
Help
for alarms, 11-17, 12-42
menu description, 1-14
Help Menu
button, 8-6
Index-6
I
StarKeeper II NMS Graphics System Guide, R10.0, Issue 1
Index
J
Japanese Remote Frame Alarm (yellow)
frame relay field, 8-119, 8-128
K
K BYTES DROPPED, 17-30
K LINE SEGMENTS, 17-30
Key panes
general description, 8-11
L
L2_PDU, 17-22, 17-30
L3_PDU, 17-22, 17-30
Labels
adding, 10-30, 10-36, 10-43, 10-50
automatic placement, 10-12
Editing, 12-21
manual placement, 10-12
moving, 10-35, 10-43
user reference, 12-19
Labels Off
user reference, 12-37
LAN interface cable
for Netstations, 2-17
LATA ID
Trunk field, 8-56
LCODE VIOL, 17-30
Leaf node (Connectivity Analysis), 9-28
Legend
editor, 10-27
invoking, 12-25
map, 12-36
user reference, 12-36
L-FERR, 17-30
Licensing applications, xxxviii
Line Coding
frame relay field, 8-119, 8-128
LINE ERRD SECS, 17-30
LINE SEVR ERRD SECS, 17-30
Link Integrity Error Threshold
frame relay field, 8-124, 8-131
Link Integrity Polling Timer
frame relay field, 8-124, 8-131
Link Level Addressing
Netstation, 2-15
LINK TYPE, 17-30
LINK TYPE/SPEED, 17-11
Link Utilization Report, 1-28, 17-5
Links
Concentrator/SAM, 10-49
List Alarms
user reference, 12-35
List Alarms Window, 1-16, 12-35, 12-37
alarm help, 12-42
characteristics, 1-21
clearing alarms, 11-21, 12-40
diagnostics, 12-40
displaying, 11-13
displaying alarm detail, 11-16, 12-39
error messages, C-13
finding maps, 12-39
freezing alarms, 12-42
introduction, 1-21
printing, 12-38
running diagnostics, 11-18
saving, 12-38
selection criteria, 12-3
setting alarm list preferences, 12-7
sorting alarms, 12-40
user reference, 12-3, 12-37
List Concentrators/SAMs
user reference, 12-23
List Editing Controls, 8-29
List Nodes
user reference, 12-23
listener address
connection status, 5-4
Load (configuration File menu), 8-8
Load command window, 8-20
Load Map
user reference, 12-16
Load operation, 8-19
Configure menu, 8-7, 8-14
Loading files, 10-39, 10-48, 10-51, 12-16
Local Node
Node field, 8-41
Local Node Prefix
Node field, 8-46
Long term engineering, 1-25
Long term traffic engineering, 15-1
M
M1 SHELF NUM, 17-11
M2 SHELF NUM, 17-11
Machine parameters, 2-7
Maintenance, 16-1
Managing scheduled filed reports, 16-4
Manual labeling, 10-12
Map editor, 1-15
starting, 10-24
Map hierarchy, 1-19
branches, 10-21
definition, 10-3
StarKeeper II NMS Graphics System Guide, R10.0, Issue 1
Index-7
Index
planning on paper, 10-7
tutorial, 10-2
Map Legend, 12-36
Map pointers
setting, 10-29, 10-36, 10-47, 12-29
Map titles, 10-15
setting, 10-37, 10-47, 10-50, 12-30
Maps
adding background, 10-39
and directories, 10-64
distributing to other Graphics Systems, 10-63
loading, 10-51
saving, 10-38, 10-48, 10-50
subsets using Top Map parameter, 11-22
testing checklist, 10-55
updating, 10-63
MAX %MID USED, 17-30
Max Aggregate CIR
frame relay field, 8-132
Trunk field, 8-56
Max Aggregate Non-CIR
Trunk field, 8-56
Max Consec. Test Failures
Trunk field, 8-56
Maximum Arrival Rate
ICI Group Address, 8-105
Maximum Frame Size
frame relay field, 8-124
Maximum Retry Cycles, 7-3
MCDU
Trunk field, 8-56
Message IDs
user reference, 12-11
Messages, 8-12
error, 8-28
Minimum hop criterion, 9-5
Minimum Interframe Delay
frame relay field, 8-124, 8-132
Mnemonic Addresses, 8-66
Mnemonic and X.121 address field, 8-41
MOD ADDR, 17-11, 17-19, 17-22, 17-31
MOD TYPE, 17-11, 17-31
Modify Connection Data property window, 5-3
Modifying local connection parameters, 5-6
Modifying network maps
night fold-down, 11-22
Module Address
Trunk field, 8-54
Module performance reports, 1-30
modules, 17-7
Module type user reference, 12-11
Monitor Menu
List Alarms Selection Criteria, 12-3
user reference, 12-2
Monitored Event Count
frame relay field, 8-124, 8-132
Monitoring a network
checking Network Status Window, example, 11-15
Index-8
clearing alarms, 11-14
determining the problem, 11-14
displaying detailed map of node, 11-11
displaying List Alarms Window, 11-13
generic guidelines, 11-4
how to start, 11-6
sequence, 11-3
starting Network Monitor, 11-6
starting Task Manager, 11-5
tutorial, 11-2
Motif GUI, 1-12
Move (trunk) feature, 8-25
Move Object
user reference, 12-19
MRCM Maint connection class
described, 8-32
Multicast DLCI Group ID
frame relay field, 8-139
N
NAME, 17-31
Name Server
net config field, 2-18
NAME/TYPE/SPEED, 17-11
Naming a Netstation, 2-14
Naming conventions for network maps, 10-17
Navigating Network Map Window
down, 11-10, 11-11, 12-36
up, 12-36
Negative alarm filters, 10-60
Neighbor Nodes
NRT field, 8-74
Netstation
adding, host server, 2-15
Administration, 2-17
Administration, Host Server, 2-14
assigning addresses, 2-14
connection to host machine, xxxviii
HP ENVIZEX station, 2-13
Link Level Addressing, 2-15
name, 2-14
Network configuration window, 2-17
Network Level Addressing, 2-15
removing, 2-17
Network
configuration, 9-8
Node field, 8-41
Network Access Password
NMS Connections field, 8-35
Network Address
setting, 12-28
user reference, 12-4, 12-10
Network Addressing
wildcarding, 10-58
Network availability reports, 1-30, 17-7
StarKeeper II NMS Graphics System Guide, R10.0, Issue 1
Index
Network Builder, 1-9
Analysis, 1-11
configuration, 1-10
features, 1-9
forms interface, 1-9
starting for connectivity analysis, 9-22
window architecture, 1-12
Network configuration window
Netstations, 2-17, 2-18
Network equipment
grouping, 10-13
identifying for map hierarchy, 10-7
placing on paper map, 10-10
planning detailed maps, 10-16
planning scratch pad information, 10-16
planning shelf maps, 10-18
sample network concentrators/SAMs, 10-9
sample network CPM connections, 10-10
sample network nodes and systems, 10-7
sample network trunks, 10-8
sketching map hierarchy, 10-19
Network Level Addressing
Netstation, 2-15
Network Map Window, 12-30, 12-33
characteristics, 1-20
checking top map, 11-9
clearing alarms, 11-14, 12-35
diagnostics, 12-36
display info, 12-34
error messages, C-11
introduction, 1-20
Labels Off, 12-37
Labels On, 12-37
list alarms, 12-35
Map Legend, 12-36
navigating, 11-11, 12-36
user reference, 12-33
Network maps
aggregate location symbols, 10-13
labels, 10-12
naming conventions, 10-17
symbols, 10-12
Network Monitor
features, 1-15
introduction, xxxviii
processes, C-2
Shelf Level Map, 11-12
starting, 10-24, 11-6
supported products, 1-17
window architecture, 1-17
Network Monitor Control Window error messages, C-8
Network Parms From
net config field, 2-18
Network Status Window, 12-30
alarm severity notices, 1-19, 12-32
checking user notices, 11-8, 11-15
example of checking process, 11-15
introduction, 1-19
user notices, 12-32
user reference, 12-30
Network Status Windows error messages, C-11
Network symbols
scratch pad information, 10-16
Network Telephone Number
NMS Connections field, 8-35
Network topology
example, 9-79
New (configuration File menu), 8-8
New design
create, 9-23
New Design command window
data fields, 9-24
screen, 9-25
with Choose Node lists, screen, 9-25
New map
user reference, 12-16
New operation, 8-15
Configure menu, 8-7, 8-14
New Password
change Node field, 8-45
Night fold-down, 11-21, 11-22
NM Server Dialstring
Node field, 8-40
NMS Connections configuration, 1-10, 8-31
Node
adding, 8-39, 10-40, 10-48
address type, 9-9
and connectivity, 9-76
background information, 8-37
change (Connectivity Analysis), 9-18
commands, 12-43
configuration, 1-10
delete (Connectivity Analysis), 9-18
detailed maps, 10-16
diagnostic commands, 1-16
diversity, 9-4, 9-15, 9-30
Node address
duplicate, 9-9, 9-36
unique, 9-8
user reference, 12-45
Node Address and Topology Input report, 9-44
screen, 9-44, 9-79
Node Address input data pane, 9-17
data fields, 9-17
screen, 9-17
Node Backplane Utilization Report, 1-29
Node Configuration Base Window, 8-6
NODE NAME, 17-11, 17-19, 17-22, 17-31
Node Reroute Tables, 1-11, 9-62
NON-CIR K BYTES, 17-31
Notice windows error messages, C-2
Notices, 8-14
alarm severity, 12-32
checking, 11-8, 11-15
StarKeeper II NMS Graphics System Guide, R10.0, Issue 1
Index-9
Index
user, 12-32
checking, 11-8, 11-15
defining, 10-56, 12-9
NRT
background information, 8-72
Generation Report, 8-74
parameters, 8-73
NRT for Node
to generate an NRT, 8-74
O
Object Type
user reference, 12-45
Objects
deleting, 12-19
On-demand reports, 1-24
On-line help, 10-31
Operator tips, 8-24
Options
menu description, 1-14
Originating Group Security, 8-67
Service Address field, 8-69
OTHER, 17-19
out-of-band Loopback Code
frame relay field, 8-119, 8-128
Override node tuning data
control (Session Maintenance simulation), 9-68
OVRFLW, 17-31
P
PACKETS, 17-31
Pad Support
Service Address field, 8-69
Pane height
user reference, 12-8
Parameters
machine, 2-7
setting top map, 10-38
PARITY ERROR, 17-31
pass-through
StarKeeper II NMS feature, 8-2
Path
blocked, 9-7
completed, 9-7
crankback, 9-7
route-advanced, 9-7
Path Analysis, 1-12, 9-6
constraints, 9-31
detailed report, 9-31, 9-58
detailed report with node-diverse routing screen, 9-86
node failure conditions, 9-6
Index-10
reports, 9-57
results, interpreting, 9-38
run, 9-30, 9-38
summary report, 9-57
trunk group failure conditions, 9-6
Pattern matching, 8-10, 8-28
PEAK CIR ALLOCATED, 17-31
PEAK CONN, 17-19
PEAK K BYTES, 17-31
Pending data, 9-8
Performance connection class
described, 8-32
Performance Data
administering on the Core System, 13-1
Performance problems
troubleshooting, 14-12
Performance Reporter features, 1-23
Performing, 9-85
Pick From Legend
user reference, 12-25
Planning map hierarchy
identifying network equipment, 10-7
on paper, 10-7
overview, 10-7
principles, 10-3
scratch pad information, 10-16
sketch map hierarchy, 10-19
Planning map hierarchy tutorial
Phase I, overview, 10-7
Point of Presence ID
Trunk field, 8-57
Polling Verification Timer
frame relay field, 8-125, 8-132
Port
user reference, 12-45
Port capacity utilization reports, 1-30
access modules, 17-7
PORT/CHAN ALLOC, 17-19
Positive alarm filters, 10-60
Pre-selected Carrier
SNI field, 8-79
Primary route
no assignment, 9-5
Principles for planning map hierarchy, 10-3
Principles of highest severity alarm, 10-6
Print
user reference, 12-38
Printing the List Alarms Window, 12-38
Processes
Network Monitor, C-2
Profile ID
Service Address field, 8-69
Properties
user reference, 12-27
Properties menu button
Cut-through Application, 6-3
Proposed (task status definition), 8-13
StarKeeper II NMS Graphics System Guide, R10.0, Issue 1
Index
Protocol
TCP/IP for Netstations, 2-15
push command, 10-63
PVC Destination Address
frame relay field, 8-139
PVC Management Poll Direction
frame relay field, 8-125, 8-132
PVC Management Type
frame relay field, 8-125, 8-132
R
Rate Unit
frame relay field, 8-125, 8-132
RCVR ABORTS, 17-31
RCVR OVRNS, 17-31
Reading error messages, C-1
Recommended actions and error messages, C-4
Regional maps, 10-14
displaying, 11-9
editing, 10-39
REJ FRAMES, 17-31
REJCTS, 17-31
Removing a Netstation, 2-17
Removing users, 10-1
Report example
Bandwidth Utilization Link, 17-9, 17-10
Bandwidth Utilization Shelf, 17-11
connection utilization node, 17-18
connection utilization receiving group, 17-14
connection utilization trunk group, 17-16
connection utilization X.25, 17-17
Frame Relay, 17-20
Module Performance Frame Relay, 17-28
Network Availability, 17-25
Report version, 9-15
Report viewing window, 9-15
Reports
bandwidth utilization, 1-28, 17-5
bandwidth utilization link, 17-9
bandwidth utilization shelf, 17-11
categories, 1-28
Configuration, 8-84
connection utilization, 1-29, 17-6
connection utilization node, 17-18
connection utilization receiving group, 17-14
connection utilization trunk group, 17-16
connection utilization X.25, 17-17
daily exception - detail, 14-5
daily exception - summary, 14-2
Frame Relay, 17-20
ICI Address Prefix, 8-100
ICI Group Address, 8-106
managing scheduled filed, 16-4
module performance, 1-30
modules, 17-7
network availability, 1-30, 17-7, 17-25
on-demand, 14-7
port capacity utilization, 1-30
access modules, 17-7
SNI, 8-82
Reroute bandwidth reduction (Session Maintenance simulation), 9-69
Reset Form (configuration File menu), 8-9
Reset of parameters, 7-3
RETRANS INTVLS, 17-31
Retry Interval, 7-3
RNR, 17-31
Route-advanced path, 9-7
Routine performance assurance, 1-23, 14-1
Routing, 9-4, 9-6, 9-9
Routing Evaluation, 1-12, 9-5
constraints, 9-36
differences from Topology Evaluation, 9-6
reports, 9-51
run, 9-36
Routing Evaluation tool
factors not considered, 9-5
Routing input
edit (Connectivity Analysis), 9-21
Routing input data pane, 9-20
Routing Input report, 9-45
screen, 9-45, 9-80
Routing patterns
error-free, 9-5
Run command (Session Maintenance simulation), 9-65
Run Path Analysis command window, 9-32
Run Routing Evaluation command window, 9-37
Run simulation button (Session Maintenance simulation),
9-69
Run Topology Evaluation command window
screen, 9-29
Running diagnostics
List Alarms Window, 11-18
S
Sample network
list of concentrators/SAMs, 10-9
list of CPM connections, 10-10
list of nodes and systems, 10-7
list of trunks, 10-8
Save
user reference, 12-38
Save design (Connectivity Analysis), 9-34
Save Design notice
screen, 9-34
Save Map
user reference, 12-15
Save to File button, 9-16
Saving List Alarms Window, 12-38
Saving maps, 10-38, 10-48, 10-50, 12-15
StarKeeper II NMS Graphics System Guide, R10.0, Issue 1
Index-11
Index
Scratch pad information, 10-16, 12-34
adding, 10-46
display info, 10-16
Scratch Pad Text
user reference, 12-28
Scrolling list
Configuration Activity Log, 8-4
Secondary route
no assignment, 9-5
SECURITY, 17-19
Selection criteria for alarms, 12-3
network address, 12-4
severities, 12-5
Sequence for monitoring a network, 11-3
Service Address
background information, 8-65
configuration, 8-65
restrictions, 8-68
Service Type
frame relay field, 8-134
Session Maintenance
base window after Load, screen, 9-67
Session Maintenance simulation
base window, options, 9-65
base window, screen, 9-62
data source, 9-66
detailed report, 9-74
Engineering Data report, 9-76
File menu, 9-63
output reports, 9-69
procedure, 9-64
Run command parameters, 9-68
Run Simulation button, 9-64
start, 9-65
summary report, 9-70
user interface controls, 9-62
View menu, 9-64
Session Maintenance simulation tool, 9-8
overall functions, 9-2
quitting the, 9-64
using the, 9-62
Session Maintenance trunks, 8-51
Set Alarm List Preferences
user reference, 12-7
Set Map Pointer
user reference, 12-29
Set Network Address
user reference, 12-28
Set Title
user reference, 12-30
Set Top Map
user reference, 12-13
Setting preferences
alarm list, 12-7
Setting up connections to StarKeeper II NMS, 10-23
Setup for automatic login
Cut-through Application, 6-5
SEVR ERRD FRM SECS, 17-32
Index-12
SEVR ERRD SECS, 17-31
SHELF, 17-12
Shelf Level Map
Network Monitor, 11-12
Shelf Map Generation process error messages, C-25
Shelf maps, 1-15
generating, 10-52, 12-12
planning, 10-18
SHELF SPEED, 17-12
Si Bit Value
frame relay field, 8-119, 8-128
Simulation data
load, 9-65
SIR, 17-22, 17-32
SKII Connections Administration Window, 5-3
skload
StarKeeper command, 8-2, 8-32
skload command, 10-23
SMDS, 1-11
SNI, 1-11
background information, 8-77
configuration, 8-77
reports, 8-82
Software Version
frame relay field, 8-119, 8-121
Trunk field, 8-57
Sort
user reference, 12-40
Sort alarms
user reference, 12-8
Specifying alarm filters, 10-60
SPEED, 17-22
Speedcall Addresses, 8-67
Standard data
defaults control, 8-25
StarKeeper II NMS commands
cfg_sync, 10-23
skload, 10-23
StarKeeper II NMS symbol
adding, 10-31
Starting Network Monitor, 10-24, 11-6
Starting Task Manager, 11-5
Starting the Cut-through Application, 6-1
Starting the workstation, 2-5
Starting the Workstation Administration Application, 5-1
Status
NMS Connections field, 8-35
status flag
connection status, 5-4
Status Info. in Polling Data
frame relay field, 8-134
status messages
Network Builder, 8-13
STATUS QUEUE OVRFLW, 17-32
Stopping the workstation, 2-5
Submit Update (configuration File menu), 8-9
Subscriber Network Interface, 1-11
Summary report, 9-69
StarKeeper II NMS Graphics System Guide, R10.0, Issue 1
Index
Supported products, 1-12, 1-17, 1-26
Switched Multimegabit Data Services, 1-11
Symbols
Editor Legend, 12-26
SYNC LOST, 17-32
synchronize command, 10-23
Synchronizing alarms, 10-62
Synchronizing connections data, 2-12, 5-6
Synchronizing database(s), 10-23
System communications
core and graphics, 2-5
System error codes
HP-UX, C-28
System event log, C-2
T
Task Aging, 7-3, 8-4
Task Manager
Bulletin Board error messages, C-2
starting, 11-5
TCP/IP protocol, 2-15
Testing maps
checklist, 10-55
Threshold
ICI Group Address, 8-105
Threshold Profile ID
Trunk field, 8-57
Threshold values, 13-5
Thresholding, 1-24, 13-1, 13-2, 13-3
Time
frame relay field, 8-119, 8-128
Time Zone
Node field, 8-40
TimeSlot Allocation
frame relay field, 8-125, 8-132
Top
user reference, 12-36
Top map, 10-14
adding aggregate location symbols, 10-27
adding background, 10-26
checking, 11-9
creating, 10-26
saving, 10-38
setting, 12-13
setting parameter for map subsets, 11-22
setting parameters, 10-38
Topology
network, 9-4
Topology Evaluation, 1-12, 9-4
Destination Routing report, 9-47
differences from Routing Evaluation, 9-6
Extended Routing Recommendations report, 9-49
reports, 9-47
run, 9-29
Source Routing report, 9-50
Trunk Group Use report, 9-49
Topology input data pane, 9-18
data fields, 9-19
TOTAL BYTES, 17-22, 17-32
TOTAL FAILURES, 17-19
TOTAL FRAMES, 17-22, 17-32
TOTAL K BYTES, 17-32
TOTAL PACKETS, 17-32
TOTAL TRANS UNDRUN, 17-32
Trace calls, 9-7, 12-2, 12-6
Traffic engineering
long term, 15-1
TRAFFIC INTVLS, 17-32
Traffic Type
SNI field, 8-79
Trunk field, 8-57
Trickle-up
definition, 10-4
Trouble - Awaiting Retry (task status definition), 8-13
Trouble Recovery
SNI, 8-86
trunk, 8-58
Troubleshooting (Connectivity Analysis), 9-31
Troubleshooting performance problems, 14-12
Troubleshooting Performance Reporter, 13-12
Trunk
adding, 10-33, 10-43
background information, 8-51
configuration, 1-10, 8-51
Endpoints, 10-34
NRT field, 8-74
problem, 11-15
security patterns, 8-51
Trunk Active Test Interval
Trunk field, 8-57
Trunk aggregate symbol, 10-17
adding, 10-35
Trunk group
change (Connectivity Analysis), 9-19
delete (Connectivity Analysis), 9-19
in topology input, 9-19
Trunk Utilization Report, 1-28, 17-5
Tuning
frame relay field, 8-140
parameters, 7-1
Tutorial
monitoring the network, 11-2
TYPE, 17-22, 17-32
TYPE & REL./SPEED, 17-12
U
uname
connection status, 5-4
UNAVL SECS, 17-32
Unconnected node, 9-30
StarKeeper II NMS Graphics System Guide, R10.0, Issue 1
Index-13
Index
Unmonitored objects, 10-18
adding, 10-49
Up
user reference, 12-36
Update
submitting, 8-17
Updating configuration data, 13-8
Via a Cron File, 13-9
Updating maps, 10-63
Upload Server
frame relay field, 8-120
Trunk field, 8-57
USART ERR INTVLS, 17-32
USER BYTES, 17-22, 17-32
User notices, 12-32
BNS-2000 alarms, 10-58
checking, 11-8, 11-15
defining, 10-56, 12-9
user reference, 12-32
User reference
Add Background Text, 12-27
Add Nodes/Systems, 12-23
adding equipment, 12-22
Administer Maps, 12-11
alarm format, 12-7
alarm help, 12-41, 12-42
Alarm Severity Notices, 12-32
Background Text, 12-26
Channel, 12-46
clear alarms, 12-5, 12-35, 12-40
Commands Menu, 12-34, 12-39
Component Address, 12-45
Control Window, 12-2
defining notices, 12-9
Delete Object, 12-19
diagnostics, 12-36, 12-40
Diagnostics Window, 12-43
Display Detail, 12-39
Display Info, 12-34
Display Top Map, 12-32
Down, 12-36
Edit, 12-18
Edit Background Text, 12-27
Edit Maps Window, 12-11, 12-14
File, 12-15
File Menu, 12-38
Find Map, 12-39
freeze and unfreeze, 12-42
generating shelf maps, 12-12
Help Menu, 12-41
Labels, 12-10, 12-19
Labels Off, 12-37
Legend, 12-36
List Alarms, 12-35
List Alarms Window, 12-3, 12-37
List Concentrators/SAMs, 12-23
Load Map, 12-16
message IDs, 12-11
Index-14
module type, 12-11
Monitor Menu, 12-2
Move Object, 12-19
Network Address, 12-4, 12-10
Network Map Window, 12-33
Network Status Window, 12-30
new map, 12-16
Node Address, 12-45
Object Type, 12-45
pane height, 12-8
Pick From Legend, 12-25
Port, 12-45
Print, 12-38
Properties, 12-27
Save, 12-38
Save Map, 12-15
Scratch Pad Text, 12-28
Set Alarm List Preferences, 12-7
Set Map Pointer, 12-29
Set Network Address, 12-28
Set Title, 12-30
Set Top Map, 12-13
Sort, 12-40
sort alarms, 12-8
sound bell for, 12-8
Top, 12-36
Up, 12-36
user notices, 12-32
View Menu, 12-40
viewing Network Status, 12-3
Users
adding, 10-1
removing, 10-1
V
Verifying data before deleting
operator tip, 8-24
View
Detailed Report
screen, 9-74
Engineering Data report
screen, 9-76
menu description, 1-14
View button
(Session Maintenance simulation), 9-69
on configuration forms, 8-9
View Menu
button, 8-6
user reference, 12-40
View Network Status, 11-6, 11-22
Viewing Network Status
user reference, 12-3
StarKeeper II NMS Graphics System Guide, R10.0, Issue 1
Index
W
X
Waiting (task status definition), 8-13
Warning
displayed in task log, 8-13
Wildcarding in Network Addressing, 10-58
Window architecture, 1-17, 1-27, 10-1, 11-1, 12-1
Network Builder, 1-12
user reference, 12-1
Window Size
Node field, 8-46
Workstation
starting using, 2-5
stopping, 2-5
Workstation administration
base window, 5-2
introduction, 2-1
Workstation Administration Application
starting, 5-1
X.121 Addresses, 8-67
Y
Year 2000 Compliance, 1-1
StarKeeper II NMS Graphics System Guide, R10.0, Issue 1
Index-15
Index
Index-16
StarKeeper II NMS Graphics System Guide, R10.0, Issue 1