1
139
If the sample sizes are not constant you are prompted to select the variable that contains
the number of defects per sample and the variable that contains the sample sizes.
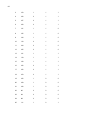
In constructing this chart the proportion of defects per sample is calculated, plotted, and listed to the left of the
plot. Also listed to the left of the plot is an indicator variable (REJECT) that indicates whether the plotted value
is (0) or is not (1) within three standard errors of the proportion of defects for the set of samples as a whole.
The center vertical mark on the scale at the top of the plot indicates the proportion of defects for the set of
samples as a whole. The distance between the vertical marks represents one standard error (based on the
median sample size) of the proportions being plotted.
The values for the proportion of defects for the samples as a whole and three standard errors above and
below this proportion are listed on the scale at the top of the plot
When the plot of the control chart is exited by clicking on CONTINUE a table listing the number of defects in
each sample, the control limits for each sample, each sample proportion, the size of each sample, and the
indicator variable REJECT is displayed.
This table is not displayed if you exit the plot of the control chart by clicking on CANCEL or by pressing Esc.
(Wheeler)
Control Chart For Defects
The D. Defects option on the CONTROL CHART menu generates a vertical plot control chart for defects as
a vertical plot .
When this option is executed you are first prompted to specify whether or not the sample sizes are constant:
If the sample sizes are not constant you are prompted to select the variable that contains
the number of defects per sample and the variable that contains the sample sizes. The
defects/unit are then calculated by dividing the number of defects by the sample size, and
this value is then plotted and listed to the left of the plot.
If the sample sizes are constant you are prompted to select the variable that contains the number
of defects per sample, and the defects themselves are then plotted and listed to the left of the plot.
Also listed to the left of the plot is an indicator variable (REJECT) that indicates whether the plotted value is
(0) or is not (1) within three sample standard errors of the mean of the defects(/unit) for the set of samples as
a whole.
The center vertical mark on the scale at the top of the plot indicates the mean of the defects(/unit) for the set
of samples as a whole. The distance between the vertical marks represents one standard error of the
defects(/unit) being plotted.
The values for the defects(/unit) for the samples as a whole and three standard errors above and below these
defects(/unit) are listed on the scale at the top of the plot.
When the plot of the control chart is exited by clicking on CONTINUE a table listing the number of defects, the
control limits, the defects/unit, and the size of each sample is displayed along with the indicator variable
REJECT.
This table is not displayed if you exit the plot of the control chart by clicking on CANCEL or by pressing Esc.
This table is also not displayed if the sample sizes are constant since otherwise it contains no information that
is not in the plot of the control chart itself. (Wheeler)
139