1
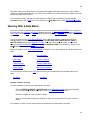
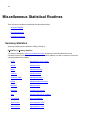
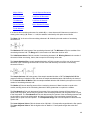
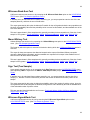
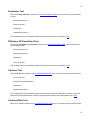
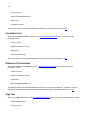
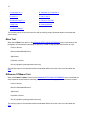
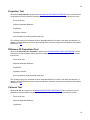
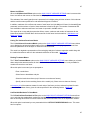
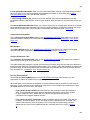
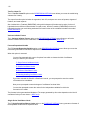
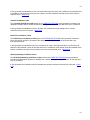
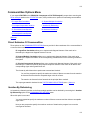
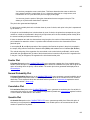
143
Graphics Options
High resolution graphics are available in ASP through the GRAPHICS OPTIONS menu. You can access this
menu by clicking on:
GRAPHS -> Graphics Options.
(This menu is not available in the Student Version of ASP or if the ASP Graphics Add On has not been
installed.) The options on this menu use the ChartFX ® DLL to generate the graphics output, and this output
is displayed in the ChartFX Editor.
The GRAPHICS OPTIONS menu has thirteen options:
A. Scatter Plot
B. Sequence Plot
C. Pie Chart
D. Bar Graph
E. Area Plot
F. Function Plot
G. Frequency Plot
H. Quantile Plot
I. Control Chart
J. Correlation Plot
K. Normal Prob. Plot
L. Crosstab Plot
M. Regression Plot
Plots And Graphs
There are at least thirteen kinds of high resolution plots and graphs that are available through the Graphics
Option on the GRAPHS menu:
Sequence Plots
Bar Graphs
Area Plots
Scatter Plots
Pie Charts
Crosstab Plots
Frequency Plots
Control Charts
Quantile Plots
Probability Plots
Regression Plots
Function Plots
Correlation Plots
Sequence Plots, Bar Graphs, And Area Plots
The B. Sequence Plot, D. Bar Graph, and E. Area Plot options on the GRAPHICS OPTIONS menu
generate horizontal sequence plots, bar graphs, and area plots.
When you execute one of these options:
You are prompted to select the variables to be plotted.
The plot of the variables you selected is generated and displayed in the ChartFX editor.
143