1
GIS MULTIMEDIA TEACHING TOOL ABOUT THE MORMON
BATTALION
_______________
A Thesis
Presented to the
Faculty of
San Diego State University
_______________
In Partial Fulfillment
of the Requirements for the Degree
Master of Science
in
Computer Science
_______________
by
Ashwini Venkanagouda Govindagoudar
Fall 2011
iii
Copyright © 2011
by
Ashwini Venkanagouda Govindagoudar
All Rights Reserved
iv
DEDICATION
I dedicate this thesis to my family members and friends who have given me endless
support, and love.
v
ABSTRACT OF THE THESIS
GIS Multimedia Teaching Tool About the Mormon Battalion
by
Ashwini Venkanagouda Govindagoudar
Master of Science in Computer Science
San Diego State University, 2011
The thesis focuses on creating a GIS tool for the SDSU (San Diego State University)
Department of History showcasing the Mormon Battalion March. The Mormon Battalion was
the only religious unit in the American military history. This Battalion served during the
Mexican-American war from 1846 to 1847. Their march of some 2,000 miles from Council
Bluffs Iowa, to San Diego, California is probably one of the longest military marches in
history. The goal of this thesis is to gather details on the Mormon Battalion March and
develop an effective learning tool for students by providing an interactive environment. The
interactive webpage or downloaded tool show the historical route that the Battalion took and
capture key events that occurred along the march. The users have the ability to click on
particular events and see more details on the respective web pages.
Modern technology influences every aspect of lives. Modern computer technology
leads to high productivity, beneficial education and long term advantages. Thus by using
modern computer technology to present any subject in an interactive way becomes an
effective learning tool in any class room with the unlimited access. This educational tool will
be easy to download so it can be used by any history department, elementary school, middle
school, high school or college.
vi
TABLE OF CONTENTS
PAGE
ABSTRACT ...............................................................................................................................v
LIST OF TABLES ................................................................................................................... ix
LIST OF FIGURES ...................................................................................................................x
LIST OF ACRONYMS .......................................................................................................... xii
ACKNOWLEDGEMENTS ................................................................................................... xiii
CHAPTER
1
MORMON BATTALION .............................................................................................1
1.1 Introduction to Mormons ...................................................................................1
1.1.1 The Polygamy Issue ..................................................................................2
1.1.2 Mormons Contributions ............................................................................2
1.2 State of Deseret ..................................................................................................2
1.3 U.S. Mexican War..............................................................................................3
1.4 Causes of Conflict ..............................................................................................3
1.4.1 Manifest Destiny .......................................................................................4
1.4.2 Texas War of Independence and its Annexation by the United
States ..................................................................................................................4
1.5 Mexican View Point on the War ........................................................................5
1.6 Causes that Led to the Enlistment of the Mormons ...........................................5
1.7 Why the Name Battalion ....................................................................................6
1.8 What Would Each Company Consist ................................................................6
1.9 Monthly Pay .......................................................................................................6
2
MORMON BATTALION JOURNEY FROM IOWA TO SAN DIEGO .....................8
2.1 Journey Begins ...................................................................................................8
2.2 Change in Command........................................................................................10
2.3 Colonel Cooke Assumes Command ................................................................10
2.4 Cooke’s Wagon Road ......................................................................................11
2.5 Battle with the Bulls.........................................................................................12
vii
2.6 Reaching California .........................................................................................13
2.7 Contributions of Mormon Battalion in San Diego...........................................13
2.8 Food Mormons Carried on the March with Recipes ........................................14
2.8.1 Hard Tack................................................................................................14
2.8.2 Jerky ........................................................................................................15
2.8.3 Pemmican................................................................................................16
2.9 Memorials and Historical Monuments of the March .......................................16
2.9.1 Old Town: Pictures .................................................................................16
2.9.2 Anza-Borrego Historical Site ..................................................................19
3
INTRODUCTION TO GIS..........................................................................................20
3.1 Introduction ......................................................................................................20
3.1.1 Components of a Geographic Information System .................................20
3.1.2 How a GIS Works ...................................................................................21
3.2 Advantages of GIS ...........................................................................................23
3.3 Disadvantages of GIS ......................................................................................24
3.4 Overview ..........................................................................................................24
4
SHAPEFILE ................................................................................................................25
4.1 Shape File Definition .......................................................................................25
4.2 How Shape Files can be Created .....................................................................25
4.3 Shape File.........................................................................................................26
4.4 Index File .........................................................................................................26
4.5 DBASE File .....................................................................................................27
4.6 How to Create Shape File Using CSV File......................................................27
5
NET BEANS IDE AND MAP OBJECTS ...................................................................29
5.1 Elementary Facts ..............................................................................................29
5.2 Step by Step Project Creation ..........................................................................29
6
TECHNOLOGY ..........................................................................................................37
6.1 Java ..................................................................................................................37
6.2 MAP Objects Java Edition ...............................................................................37
7
DEMONSTRATION OF MAPTOOLS ......................................................................39
7.1 Zoom Pan Tool Bar ..........................................................................................39
7.2 Selection Tool Bar ...........................................................................................41
viii
7.3 Custom Tool Bar ..............................................................................................46
7.4 How to add a State of Deseret Layer on the Map ............................................51
8
MAP OBJECTS ...........................................................................................................54
8.1 Map Objects Support Features .........................................................................54
8.2 Map Objects Attribute Table ...........................................................................54
8.3 Creating Layer from Selection .........................................................................55
8.4 Layer Control ...................................................................................................57
8.4.1 Promote Selected Layer ..........................................................................57
8.4.2 Demote Selected Layer ...........................................................................58
8.5 Legend Editor...................................................................................................58
8.6 Remove Layer ..................................................................................................60
8.7 Help ..................................................................................................................60
9
FUTURE ENHANCEMENTS ....................................................................................69
REFERENCES ........................................................................................................................70
APPENDIX
A SOURCE CODE USED IN THE PROJECT...............................................................72
B USER MANUAL FOR GIS MULTIMEDIA TEACHING TOOL ABOUT
MORMON BATTALION ...........................................................................................84
ix
LIST OF TABLES
PAGE
Table 1.1. Monthly Pay..............................................................................................................7
Table 4.1. Description of Shape File Header ...........................................................................26
Table 4.2. Value/Shape Type Mapping ...................................................................................27
Table 7.1. Zoom Pan Tools ......................................................................................................39
Table 7.2. Selection Tools .......................................................................................................41
Table 7.3. Defines the Different Functions of the Tools in the Custom Tool Bar...................49
x
LIST OF FIGURES
PAGE
Figure 1.1. State of Deseret........................................................................................................3
Figure 2.1. Old Town San Diego. ............................................................................................17
Figure 2.2. Historical Site Old Town San Diego. ....................................................................17
Figure 2.3 San Diego Mission San Diego. ...............................................................................18
Figure 2.4. Mormon Temple at La Jolla, San Diego, CA. .......................................................18
Figure 3.1. GIS Map Making. ..................................................................................................22
Figure 3.2. Relational design. ..................................................................................................23
Figure 4.1. Shows the CSV file to Shape File Conversion. .....................................................28
Figure 5.1. Select java application from right pane. ................................................................30
Figure 5.2. Choose project name. ............................................................................................31
Figure 5.3. Creating a new library. ..........................................................................................32
Figure 5.4. Giving library name. ..............................................................................................33
Figure 5.5. Selecting class path................................................................................................34
Figure 5.6. Selecting JAR files. ...............................................................................................35
Figure 5.7. Added JAR files. ...................................................................................................36
Figure 7.1 Zoom Pan Tool Bar. ...............................................................................................39
Figure 7.2. Selection Tool Bar. ................................................................................................41
Figure 7.3. Illustrating the usage of Find Window. .................................................................42
Figure 7.4. Illustrating the usage of Query Builder Window. .................................................43
Figure 7.5. Select Feature, Tool with rectangle selected. ........................................................44
Figure 7.6. Area on the map is selected. ..................................................................................44
Figure 7.7. Illustrating the usage of Clear All Selection tool. .................................................45
Figure 7.8. Illustrating the usage of Buffer tool, Buffer Window. ..........................................46
Figure 7.9. Illustrating after clicking ok button on the buffer window....................................47
Figure 7.10. Attribute Table with selected area highlighted. ...................................................48
Figure 7.11. Custom Tool Bar. ................................................................................................48
Figure 7.12. Lightning bolt used to open a jdialog window with Image. ................................49
xi
Figure 7.13. Shows the distance of line. ..................................................................................50
Figure 7.14. Shows the route from Iowa to San Diego on the map. ........................................51
Figure 7.15. UI shows newly added Mexico layer. .................................................................52
Figure 7.16. Shows the State of Deseret on the map. ..............................................................53
Figure 8.1. Theme menu. .........................................................................................................55
Figure 8.2. Attribute table for Mormon layer. .........................................................................56
Figure 8.3. Creating layer from selection. ...............................................................................57
Figure 8.4. Selecting third layer from top. ...............................................................................58
Figure 8.5. Third layer is promoted in place of the second layer (Mormon). .........................59
Figure 8.6. Third layer demotes to the fourth layer (states).....................................................60
Figure 8.7. Legend Editor Window with Symbols tab. ...........................................................61
Figure 8.8. Legend Editor Window with Labels tab. ...............................................................62
Figure 8.9. Name is the label feature, color is blue and rotation is 18 degrees. The
effect can be seen on the map. .....................................................................................63
Figure 8.10. Legend Editor Window with General tab. ...........................................................64
Figure 8.11. Showing the use of remove layer. .......................................................................65
Figure 8.12. Illustrating after using the remove layer tool on the Mormon layer in the
TOC..............................................................................................................................66
Figure 8.13 Illustrating the help menu. ....................................................................................67
Figure 8.14. Illustrating the help menu Table of Contents. .....................................................68
Figure B.1. Launching the tool. ...............................................................................................86
Figure B.2. Initial screen of the tool. .......................................................................................87
Figure B.3. Shows the Mormon and State of Deseret on the map. ..........................................88
Figure B.4. XY button. ............................................................................................................88
Figure B.5. Map screen after adding the Mexico Layer. .........................................................89
Figure B.6. After using zoom in button. ..................................................................................90
Figure B.7. Shows the Jdialog window with the image...........................................................91
Figure B.8. Describing Battalion journey from Iowa to San Diego. .......................................92
Figure B.9. Shows the websites associated with the link. .......................................................93
xii
LIST OF ACRONYMS
MOJO
Map Objects Java Objects
GIS
Geographical Information Science
ESRI
Environmental Systems Research Institute
IDE
Integrated Development environment
JDK
Java Development Kit
JAR
Java Archive
CSV
Comma Separated Value
JPEG
Joint Photographic Experts Group
HTML
Hypertext Markup Language
PDF
Portable Document Format
BMP
Bitmap Format
GIF
Graphics Interchange Format
SDSU
San Diego State University
xiii
ACKNOWLEDGEMENTS
I gratefully acknowledge my adviser, Dr. Carl Eckberg for the guidance, support and
continual motivation during the course of study and my thesis work.
I would also like to express my sincere thanks to Professor William A. Root and
Professor Carmelo Interlando for their kind support and their presence on my thesis
committee. Special thanks to Professor Stephen Colston from Department of History for
taking time to discuss, and critique the work.
I am thankful to my husband Sanjay kenchareddy, my son Harsha Kenchareddy, my
parents, sisters, brother and friends for their constant love and support.
1
CHAPTER 1
MORMON BATTALION
This chapter will give an introduction to Mormons, the American- Mexican war and
the causes that led to the enlistment of the Battalion and their contribution to the US Mexican
war.
1.1 INTRODUCTION TO MORMONS
Mormons are a sub cultural and ethno religious group relating to Mormonism. In the
late 1820’s Joseph Smith, Jr. founded a religion called Mormonism in Palmyra, New York,
who claimed that he received a visit from the angel Moroni, the son of the prophet Mormon.
According to Smith, Moroni gave him golden plates inscribed with symbols which Smith
translated into the Book of Mormon. Most Mormons are members of the Church of Jesus
Christ of Latter-day Saints (LDS). The Mormon religion was founded during the period of
the great western expansion of the states [1].
The Later-Day Saints started their first colony in Missouri in the 1830’s. The views
and belief of Mormons (especially about polygamy) led to a conflict between the previously
established religions, there was a three month war between the Mormons and the residents of
Missouri, when it was over the state legislature seized all their property and persecuted them.
The penalty for staying was death. As a result the Mormons moved to Illinois. Residents
there initially welcomed them but later criticized their centralization of power. Shortly
thereafter Joseph Smith was killed by a mob in 1844 [1].
After the Smith’s death, the Mormons split into two groups, one of which rejected
polygamy and returned to Missouri. The other large group followed Brigham Young.
Brigham Young, who was the successor of Joseph Smith wanted to relocate the colony
farther out west, perhaps even into Mexico[1].
he other great Mormon migration was that of Brigham Young, who went west with
Illinois Mormons seeking a new home. This led the Mormons to Salt Lake City, Utah on July
24, 1847 where they settled successfully. These two long migrations were at a roughly the
2
same time, and the Brigham Young group became the cultural and religious center of the
Mormon movement, and remains so this day [1].
1.1.1 The Polygamy Issue
Polygamy was practiced by the Mormons in the 19th century. For over forty years, the
church and the United States were at odds over the issue. Finally in 1890 the church
terminated the public practice of the polygamy. Utah was then admitted to the union in 1896.
The Mormon Church remains opposed to polygamy to this day and immediately ban any
member who is discovered to be practicing polygamy [2].
1.1.2 Mormons Contributions
Mormons have strong work ethic, independence, communal attitude, and belief in a
strong family. Mormons work on documenting the ancestral records. They also record family
tree information and send it back to the genealogy vaults in Salt Lake City, presumably to
help save the souls of those departed [3].
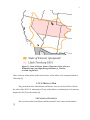
1.2 STATE OF DESERET
Deseret derived from the Book of Mormon meaning “honeybee". The state of Deseret
was a provisional state of the United States, proposed in 1849 by Latter-day Saint settlers in
Salt Lake City, Utah. The boundaries of the State of Deseret included the Oregon on the
north, the Green River on the east, and Mexico on the south, and the Sierra Nevada on the
west, including the portions of the Southern California seacoast. The provisional state existed
for slightly over two years and was never recognized by the United States government [4].
The State of Deseret failure may have two reasons as discussed below. The Figure 1.1
describes the State of Deseret on the map [4].
The railroad expansion to western states, which opened the territory to many nonMormon settlers, particularly in the western areas of the territory.
The gold rush of the 1849.
Salt Lake City, Utah publishes a newspaper called Deseret News. It is Utah’s oldest
continuously published daily newspaper. The Deseret News was first published on 15 June
1850. It was named Deseret News because it was the voice of the then State of Deseret.
3
Figure 1.1. State of Deseret. Source: WIKIPEDIA, State of Deseret.
Wikipedia, http://en.wikipedia.org/wiki/State_of_ Deseret,
accessed August 2011.
There is also an online edition of the Deseret News, which allows civil comments limited to
200 words [5].
1.3 U.S. MEXICAN WAR
The government of the United States and Mexico were at war from 1846 to 1848 in
the wake of the 1845 U.S. annexation of Texas, which Mexico considered part of its territory
despite the 1836 Texas Revolution [6].
1.4 CAUSES OF CONFLICT
The war between the United States and Mexico had 2 basic causes declared below.
[7].
4
1.4.1 Manifest Destiny
The thirst of the United States to expand to the Pacific Ocean caused a conflict with
both of its neighbors, from the British in Canada and Oregon, to the Mexicans in the
southwest [7].
The assumption that the U.S. basically had a God-given right to occupy and "civilize"
the whole continent gained favor as more and more Americans settled the western lands. The
fact that most of those areas already had people living upon them was usually ignored, with
the attitude that democratic English-speaking America, with its high ideals and Protestant
Christian ethics, would do a better job of running things than the Spanish-speaking Catholic
Mexicans or Native Americans. Manifest Destiny did not necessarily call for violent
expansion. In both 1835 and 1845, the United States offered to purchase California from
Mexico, for $5 million and $25 million, respectively. The Mexican government refused the
opportunity to sell half of its country to Mexico's most dangerous neighbor [7].
1.4.2 Texas War of Independence and its Annexation
by the United States
In the 1820's and 1830's, Mexico, newly independent from Spain, needed settlers in
the under populated northern parts of the country. An invitation was issued for people who
would take an oath of allegiance to Mexico and convert to Catholicism, the state religion.
Thousands of Americans took up the offer and moved, often with slaves, to the Mexican
province of Texas. Soon however, many of the new "Texans" were unhappy with the way the
government in Mexico City tried to run the province. In 1835, Texas revolted, and after
several bloody battles, the Mexican President, Santa Anna, was forced to sign the Treaty of
Velasco in 1836. This treaty gave Texas its independence, but many Mexicans refused to
accept the legality of this document, as Santa Anna was a prisoner of the Texans at the time.
The Republic of Texas and Mexico continued to engage in border fights and many people in
the United States openly sympathized with the U.S.-born Texans in this conflict. As a result
of the savage frontier fighting, the American public developed a very negative stereotype
against the Mexican people and government. Partly due to the continued hostilities with
Mexico, Texas decided to join with the United States, and on July 4, 1845, the annexation
gained approval from the U.S. Congress [7].
5
1.5 MEXICAN VIEW POINT ON THE WAR
Mexico was gravely offended by the annexation of Texas to the United States, which
was unacceptable for both the legal and security reasons from Mexico’s point of view. Also
the United States wanted to purchase the territories of New Mexico and California. The
Mexican government had two choices: they could give in and reestablish friendly relations to
the United States or the Mexican government would go to war to defend its integrity.
Therefore, from Mexican point of view it can be seen that Mexico never declared a war
against the United States but rather defended its territorial integrity. Thus MexicanAmerican war would be remembered by Mexicans as the US Invasion [6].
1.6 CAUSES THAT LED TO THE ENLISTMENT OF THE
MORMONS
During the period of the Mexican American war, the Mormon leader Brigham Young
had petitioned the government for help in locating a place for his people to stay for the
winter. In exchange, the Mormons could deliver mail, improve conditions of the
passageways to the west, and other services needed so that they could sustain themselves [8].
The response was a bit of surprise. The government had worked out a deal with the
Indians across the Missouri to allow the Mormons to stay on their land for up to two years
but the U.S. government needed a volunteer Battalion of 500 soldiers to help fight the
Mexican war [8].
The need for men to assist the U.S Army in the Mexican war was urgent.
Stephen Watts Kearney, at Fort Leavenworth received an order to enlist Mormon
Volunteers by President Polk. President Polk’s orders to Kearny read as follows
It is known that large bodies of Mormon emigrants are en-route to California, for the
purpose of settling in that country. United States may have their co-operation in taking
possession of California. If they enter they will be paid as other volunteers [8].
Around July 16th, Captain James Allen was issued an order by Kearney to go to the
Mormon camps and raise four to five companies of volunteers, where each company
consisting of a number of people between 73 to 109. After having received no protection
from persecution and mob action in Missouri and Illinois, Mormons were reluctant to enlist.
6
They were worried and concerned about protection for their families located on the western
frontier [8].
It was Brigham Young who realized the value of wages would be of great benefit to
their families and to the church and that their service will demonstrate loyalty to the U.S
Government. When only a handful of men came forward, Brigham spoke with the Captain to
ensure that the men would not have to fight in the war but could perform other duties. With a
great deal of encouragement, he was finally able to gather enough volunteers to fill the first
four of five companies needed [8]. Still seeing the reluctance, Brigham gave an ultimatum of
three choices [8]
Join the Battalion.
Return to Nauvoo and bring remaining members waiting for assistance.
Blaze a trail to the west. In all the cases, they would not be allowed to remain with
their families.
The fifth of the five flanks of 100 started to form. At 500 soldiers, 12 teenage boys,
and 20 women (laundresses enlisted to perform laundry duties, and meal duties as needed)
the Battalion was ready [8].
1.7 WHY THE NAME BATTALION
A battalion is a military unit of around 300-1300 soldiers usually consisting of 4 to 6
companies, which is normally commanded by either a lieutenant colonel or colonel.
A battalion is the smaller military unit capable of independent operations of limited
durations and scope (i.e. not attached to higher command) [9].
1.8 WHAT WOULD EACH COMPANY CONSIST
Each company would have a 73 to 109 people. Each volunteer was given pay and
allowances during the 12 months of their journey from Council Bluffs, Iowa to California.
On their discharge they were allowed to retain guns as their private property. Four women
laundresses accompanied each company [10].
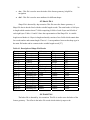
1.9 MONTHLY PAY
The monthly pay schedule was as follows [10]. Table 1.1 shows the monthly pay for
the soldiers.
7
Table 1.1. Monthly Pay
Number
1
2
3
4
5
6
7
8
Name
Captain
1st Lieutenant
2nd Lieutenant
1st Sergeant
2nd Sergeant
Corporal
Musician
Privates
Salary
$ 50 plus 20 cents per day rations
$ 30 plus 20 cents per day rations
$ 25 plus 20 cents per day rations
$ 16
$13
$9
$8
$7
Enrollment of the Mormon Battalion was completed on July 16th 1846 at Council
Bluff Iowa Territory and same day the captain Allen took the Battalion under his command.
8
CHAPTER 2
MORMON BATTALION JOURNEY FROM IOWA
TO SAN DIEGO
This chapter describes the Mormon Battalion Journey from Council Bluff Iowa to San
Diego, along with the problems faced by the Battalion members until the final destination.
2.1 JOURNEY BEGINS
The Mormon Battalion under the command of Capt. James Allen departs for Fort
Leavenworth, Kansas on July 20, 1846 covering a distance of 10 miles in its first day's
march. On July 23rd the Battalion was saddened by the death of the Samuel Boley, a private
in Company B. The 150 mile journey from Council Bluffs to Fort Leavenworth, Kansas was
achieved on August 1st [10].
Things the Mormon Battalion soldiers were given at Fort Leavenworth, Kansas [11].
Flint lock muskets
More camp equipment
Harpers Ferry Smoothbore Musket
1 Infantry cartridge box
1 Cartridge box plate
1 bayonet scabbard
1 bayonet scabbard belt
1 bayonet scabbard belt plate
1 waist belt
1 waist belt plate
1 musket gun sling
1 brush and pike set
1 musket screw driver
1 musket wiper
1 extra flint cap
9
each company was also allotted 5 sabers for the officers
10 musket ball screws
10 musket spring vices
4 Harper ferry rifles
White leather belt was 2 and forth inches wide carried over a left shoulder
Similar belt with the bayonet and scabbard was issued to carry over the right
shoulder
A white waist belt of the same width was given
Knapsack for clothing and other necessities, knapsack was similar to a backpack,
with a strap over each shoulder and a long strap to carry bedding.
One and half quart canteen and a small cotton sack called a haversack
Haversack was used to carry dinner and a day or two day rations. A tent, camp kettle,
frying pan, coffee pot and cooking utensils were issued to a group of six men, called mess
mates, who cooked and ate and slept in the same tent. Most of the money received for their
uniform as allowance was sent back to their families.Muskets weighed about fifteen pounds.
At Fort Leavenworth the Battalion members experienced its first military discipline [12].
Each Mormon carried 3 books with them.
Bible
Book of Mormon
Personal Diary
With no real military tactical training and just the basic issue of arms and equipment,
the Battalion was embarking on the journey that would end on the shores of Pacific Ocean.
On Aug 13, 1846 the first 3 companies started for Santa Fe, New Mexico, as Captain Allen
became ill, expecting to over take them after recovering his health. Jefferson Hunt would be
in charge until Colonel Allen recovered. The men liked Allen as he was kind to all. The
Battalion traveled southwest, crossed the Kansas River and the old Oregon Trail, and then
intersected with the Santa Fe Trail, which followed to Santa Fe, New Mexico [12].
Lieutenant Colonel James Allen never regained his health. He died at Fort Leavenworth on
Aug, 23, 1846 [12].
10
2.2 CHANGE IN COMMAND
Overriding Allen's prior agreement with Brigham Young that the Battalion's own
officers would assume command in the event of his death, the army appoints Lt. A.J. Smith
as the acting commander of Mormon Battalion [10].
A.J. Smith didn’t treat the sick and wounded properly. He did not earn the men’s
respect as Allen had. He ordered all the sick men out of the wagons; if they were unable to
walk he would tie them to the wagons and drag them unless they took medicine given by Dr.
Sanderson. The sick didn’t like to take the medicine given by the Dr. Sanderson because the
Doctor didn’t care about the sick people whether he killed or cured. Dr. Sanderson would
give them the dose of Calomel or quinine to take before breakfast which is harmful if given
in excessive quantities to humans [10].
The battalion reached the Arkansas River on September 11, 1846. They continued
their march for four days along the river and crossed the river on September 15 at the point
where Cimarron cut off intersects the main road to Bent’s Fort. The first sick detachment was
sent to Pueblo (now in Colorado) to winter led by Captain Nelson Higgins of company D.
They marched 25 miles across a hot desert, suffering intensely from the heat and lack of
water. The march was aggravated by the appearance of mirages. The men were compelled to
drink from a putrid water hole, full of insects of all sizes and shapes, in which the buffalo had
wallowed. The water was put in the vessel and then sucked it through a silk handkerchief.
Many of the men were sick from the hard marches and drinking filthy water [10].
The first division of the battalion reached Santa Fe, New Mexico on October 9, 1846.
In the honor of the Mormon Battalion, General Doniphan ordered that a hundred gun salutes
be fired from the roofs of the adobe houses. The second division arrived on October 12 [10].
2.3 COLONEL COOKE ASSUMES COMMAND
Colonel Philip St. George Cooke assumed the command of the Battalion. After
inspecting the supplies and equipment, he gave the following order concerning another
detachment to Pueblo. On the 18 October 2nd detachment left Santa Fe with the sick to
Pueblo (now in Colorado) [10].
At Santa Fe Colonel Cooke had to make a journey of 1,100 miles to the pacific. The
Battalion was worn out from traveling on foot, their clothes were very scant, there was no
11
money to pay them, or clothing to issue: the mules were utterly broken down; those procured
were inferior and deteriorating every hour from lack of food [10].
Rations were calculated at one and one half pounds per man per day for one hundred
days. The rations consisted of flour, sugar, coffee, salt, salt pork, and soap. They had barely
enough wagons to carry the rations. They were forced to leave some of their badly needed
stuff [10].
2.4 COOKE’S WAGON ROAD
Cooke was assigned the perilous task of building a wagon road, through mountains
and barren deserts, to the pacific. His teams were run down and his men foot sore, poorly
dressed and utterly fatigued. Still he was determined to take his wagons through.
Cooke took five women, but only four women made the entire journey to the pacific
and two children made the complete journey. The journey of Mormon Battalion would not
have been possible without the guides William Le Roux and Stephen C. Foster [10].
On October 20 the Battalion’s rations were reduced by three-fourths pound flour, also
three-fourths rations sugar and coffee was issued. No one was allowed to go further than a
quarter mile from their company without permission, no muskets to be fired in camp. The
teams were not allowed to stop to water unless ordered by the commanding officer [10].
On November 6 the Battalion arrived at the place where General Kearney had left his
wagons. From this point the Battalion was to build a wagon road through terrain where
wagons had never traveled before. Besides the hunger and having to help out the worn-out
animals pull the loaded wagons, the Battalion was laden with the task of constructing the
wagon road over a wild, desert and unexplored country, where wagons had never been
before. Cooke was a very able and determined man. He set out to make a wagon road and he
intended to finish it [10].
The third sick detachment consisting of 55 men was sent to Santa Fe via the Rio
Grande river on November 10 with Lieutenant W.W. Willis in Command. By this time the
Battalion had only a few live stock and very little flour. The Rio Grande detachment reached
Santa Fe on November 25 and reported to Colonel Price [10].
Back at the main part of the Battalion, Colonel Cooke lightened his load by leaving
an ox wagon loaded with a considerable number of tents, camp kettles, mess pans and tent
12
poles. These wagons were to be sent to Santa Fe by two people. From this point on the men
were required to use their muskets for tent poles thus making the tents lower and wider and
accommodating nine men instead of six [10].
On November 16 the battalion marched, in a cold westward wind, around the base of
a mountain to a narrow canyon, where they came across a marshy water hole. The men
named it as Cooke’s spring, the name it still bears today. Several days after leaving the line
of the Rio Grande River, Battalion scouts are unable to determine the correct way forward.
After lighting a signal fire at the top of a high mound, the men attract Apache Indians and
Mexican traders who help them find the right westward trail.
On November 28 Cooke led the Battalion through an easy pass west of a little
mountain, looking for the Guadalupe Pass. Once they found the Guadalupe Pass it was very
difficult for the wagon to pass. Cooke then directed the large pioneer party to take all the
tools they had to build the wagon road down through the canyons. The Mormon Battalion
entered present day Arizona in the southeast corner of the state through Guadalupe Canyon
which followed the route of Mexican border. The Battalion camped at the San Bernardino
ranch on December 2 and 3 [10].
On December 5 the Battalion marched parallel to the border for about six miles (still
on the Mexican side) then camped near the present town of Agua Prieta. The Mormon
Battalion entered the U.S. again about five miles west of the present town of Douglas [10].
2.5 BATTLE WITH THE BULLS
On December 11 the members of the Mormon Battalion have a surprise run-in with
wild bulls at a crossing of the San Pedro River. A handful of battalion members were injured
as the bulls charge the men, mules and wagons. The number of bulls exactly killed is not
known, but it is probably sixty to eighty. This is the only war the Battalion fought [10].
On December 25 the Christmas day the men of the Mormon Battalion have a
Christmas dinner of cold beans, pancakes and pumpkin sauce after marching for about 18
miles [10].
On January 11 after crossing the Colorado River in the morning, the Battalion
attempts to camp near a dry well. Lt. George Oman digs a new well that collapses, and then
13
digs a third well that provides enough water for the men to camp. The camp is dubbed
Cooke's Well [10].
2.6 REACHING CALIFORNIA
As the Battalion left the desert and entered the coast Range on January 19th, they
came to Box canyon (GPS location: N33.0152, W116.4429), which was too narrow for their
wagons. Here the Battalion cut a road into rocky side of a canyon which was otherwise
impassable to wagons. Battalion members chiseled the sides of cliff with crowbars, axes and
spades to allow the wagons to pass through. Then they camped to rest and recuperate at
Warner’s Ranch warm springs from their long ordeal crossing the Southwest [13].
On January 27 just before sunset, the Mormon Battalion marches into view of the
Pacific Ocean for the first time. Battalion members consisting of 335 men, 4 women, 2
children, 5 government wagons and 3 private wagons arrive at San Diego Mission two days
later, completing their march on Jan. 29, 1847. San Diego becomes the headquarters for the
Mormon Battalion [14].
On January 30 Lieutenant – Colonel congratulates the Battalion on their arrival on the
shore of Pacific ocean and the conclusion of the march of over two thousand miles. The
march has been through a wilderness where nothing but savages and wild beasts are found, or
deserts, there is no living creature. Mormon Battalion have marched half naked and half fed,
and living upon wild animals made a road of great value to the country. It was very hard for
the Battalion to travel. The roads were very bad, and sometimes the wagons got struck. It was
hard to find water to drink; sometimes there were no trees where the men could rest in the
shade. Many people got sick on the way. Still most of the soldiers in the Battalion kept
marching. Sometimes they had to dig down into the sand to find water. They didn’t have
enough food. Often there was no wood to make fires, so the men had to burn weeds [10].
2.7 CONTRIBUTIONS OF MORMON BATTALION IN SAN
DIEGO
The Mormon Battalion built the first brick building in California. The building was a
courthouse later used as school and a Church. They improved the San Diego water supply by
digging wells and lining them with bricks. They built a blacksmith shop, a bakery and white
washed most of the buildings in the community. They repaired carts and performed many
14
other services for the people. Lt. Robert Cliff was the third mayor of San Diego, and served
in that capacity until the end of his enlistment.
2.8 FOOD MORMONS CARRIED ON THE MARCH WITH
RECIPES
HardTack
Jerky
Pemmican
Some flour
Water
2.8.1 Hard Tack
Hardtack is a cracker or biscuit made out of flour, water and sometimes salt. It is
inexpensive and will last for years. Before the American civil war, soldiers called it biscuit or
hard bread, sailors referred to it as sea biscuit or pilot’s bread, but during the American civil
war, it was known as Hardtack. In olden days it was believed most illness was caused with
digestion. As to avoid illness a daily consumption of a biscuit was considered good for one’s
health. The bakers made biscuits as hard as possible, as biscuits would soften as time went
on. Because it is so hard and dry will survive rough handling and endure extremes of
temperature [15].
Hard tack was not ever intended to be delicious. The main purpose was to keep it
long term. For it to keep long term, it had to be dry as a bone, and contain nothing like Fats,
oils and milk-based ingredients. If it is not completely void of moisture it will spoil. To
facilitate drying, the cracker was pierced with a toothpick on a half-inch grid. Because it
needs to dry thoroughly, we can’t bake it at high temperature. Instead, it needs to bake very
slowly at a lower temperature for a long time (at least a couple of hours).It will stay fresh as
long as it is kept dry. Actually, it’s not supposed to stay fresh. It’s supposed to be dry [15].
Hardtack made up large portions of a soldier’s daily ration. It was the most
convenient food for the soldiers as it was not heavy and they could move faster. It was
square or sometimes rectangular in shape with small holes baked into it. So hard that
soldiers called them "tooth dullers" and "sheet iron crackers”. Sometimes they were
infested with small bugs the soldiers called weevils, so they referred to the hardtack as
15
"worm castles" because of the many holes bored through the crackers by these pests. The
wooden crates were stacked outside of tents and warehouses until it was time to issue them.
Soldiers were usually allowed six to eight crackers for a three-day ration. There were a
number of ways to eat them- plain or prepared with other ration items. Soldiers would
crumble them into coffee or soften them in water [15].
Recipe
Ingredients
1. 5 cups flour
2. 1 cup water
3. 1 tbsp salt
Steps in making the hardtack
Mix flour, water and salt thoroughly.
Knead dough and roll out till it is 1/2 inch thick.
Cut dough into 3x3 squares, and poke a 3x3 series of holes in the center,
evenly spaced.
Next put the squares on an ungreased pan and bake in preheated oven, for half
an hour at 425 degrees. Then turn the hardtack squares over and bake for
another half hour until the hardtack is bit brown on both sides.
When you take the hardtack out of the oven it will be somewhat brittle, but as
it cools it will become very hard hopefully as “hard as a brick”! Be sure to
keep them dry. If they get damp, they will get moldy quickly and cannot be
eaten.
2.8.2 Jerky
Is a meat that has been cut into strips, trimmed of fat, maintained in a seasoned sweet
rub or liquid, and dried or smoked with low heat or is occasionally just salted and sun dried.
The result is a sweet snack which can be eaten immediately or which can be stored
for months. The word jerky comes from the Quechua term charqui which means to burn
(meat) [16].
Recipe:
Ingredients:
1. Meat
Procedure:
16
1. Meat from domestic animal must be dried thoroughly to reduce
bacterial growth.
2. Thinly slice the meat
3. Dry the meat at low temperature to avoid cooking it or over drying
it.
2.8.3 Pemmican
Meat is best preserved by drying and fat by rendering. If there is fat in the meat, or
vice versa, either could spoil. However, once each is prepared they can be mixed together
and the resulting product will have good keeping quality. For travel it is tightly packed
Pemmican is a food invented by the native peoples of North America which is a concentrated
mixture of fat and protein used as nutritious food. Pemmican is derived from the word pimi,
fat, and grease. Pemmican is easily transportable and long lasting. It is a mixture of dried
shredded or pounded meat usually of (Bison or Elk or Deer)
Pemmican is made by first separating the fat and meat from each other so that they
can be processed individually in sealed containers (similar to stuffing sausage in casing) so
that it will not rancidity [17].
Recipe:
1. Dry the meat
2. Grind the meat
3. Render the fat
4. Combine meat and fat in a ratio of about 2 parts meat to one part fat.
5. Pack in airtight containers Store in a cool, dry, dark place.
2.9 MEMORIALS AND HISTORICAL MONUMENTS OF THE
MARCH
This section describes some of the pictures of Old Town San Diego and also gives
information about Anza Borrego Historical site.
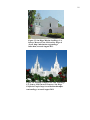
2.9.1 Old Town: Pictures
The historical site of Old Town San Diego has a hands on exhibits and resources for
learning about those who served in the Battalion.
Figures 2.1, 2.2, 2.3, 2.4 show some of Old Town San Diego pictures [18-21].
17
Figure 2.1. Old Town San Diego. Source:
SDJEWISHWORLD, San Diego’s Historic
Places: Mormon Battalion Museum.
http://sdjewishworld. wordpress.com/
2010/05/12/san-diegos-historic-placesmormon-battalion-museum/, accessed August
2011.
Figure 2.2. Historical Site Old Town San Diego.
Source: LDS, San Diego Mormon Battalion
Historic Site. http://lds.org/placestovisit/eng/
historical-sites/san-diego-mormon-battalionhistoric-site, accessed August 2011.
18
Figure 2.3 San Diego Mission San Diego, CA.
Source: MISSIONTOUR, Mission San Diego de
Alcalá. http://missiontour.org/sandiego/
index.htm, accessed August 2011.
Figure 2.4. Mormon Temple at La Jolla, San Diego,
CA. Source: LDS CHURCH TEMPLES, San Diego
California Temple. http://www.ldschurchtemples.
com/sandiego, accessed August 2011.
19
The Mormon Temple at La Jolla, California shows the continuity of the Mormons in
San Diego.
30 minute interactive documentary about Battalion Journey from Iowa to San Diego
can be watched at the Mormon Battalion center at the Old Town San Diego. A true story
about Brigham Young a famous Mormon leader and his battle to transport his people across
the Rocky mountains to settle in Salt Lake city can be watched in the movie Brigham
Young(released on 1940) [22].
2.9.2 Anza-Borrego Historical Site
East of Julian, at the feet to the Laguna Mountains, the Mormons came across a pass
too narrow for their wagons. They had to carve a road adequate to pass their wagons using
hand tools and ingenuity. It is the Box Canyon Monument and pass and is a state of
California historic site. This same pass was later augmented for the Butterfield Stage route.
There are actually two historic monuments about a half mile apart, and a trail between them,
so you walk part of the march.
20
CHAPTER 3
INTRODUCTION TO GIS
This chapter gives an introduction to GIS and how a GIS works along with
advantages and disadvantages of GIS
3.1 INTRODUCTION
A geographic information system (GIS) incorporates geographical features with
tabular data in order to capture, store, manipulate, manage, analyze and display all types of
geographically referenced information [23, 24].
GIS allows us to view, understand, question, interpret, and visualize data in many
ways that reveal relationships, patterns and trends in the form of maps, globes, reports, and
charts [23, 24].
A GIS helps you answer questions and solve problems by looking at your data in a
way that is quickly understood and easily shared [23, 24]. GIS technology can be integrated
into any enterprise information system framework [23, 24].
3.1.1 Components of a Geographic Information
System
Geographic Information System (GIS) is made up five key Components [25].
Hardware: Computer on which the GIS application runs. Since the data files are very
large, so the computer which runs GIS applications must have a fast processing speed
and a large drive capable of saving many files. A GIS application also requires high
resolution monitors, as GIS outputs visual results [24, 25].
Software: GIS Software provides the functions and tools needed to store, analyze,
and display geographic information. To support geographic query, analysis and
visualization it includes database management system. A Graphical User Interface
(GUI) is also included for the easy access of the tool’s [24, 25].
Data: Data is the most important component of a GIS. A GIS will integrate spatial
data with other data resources and can even use a database management system to
organize and maintain their data. Geographic data and related tabular data can be
collected in-house or produced by digitizing images from aerial photographs or
21
published maps. Data can also be purchased from commercial vendor and as well as
federal government at no cost [24, 25].
People: Users of GIS range from technical specialists to students in elementary
schools [24, 25].
Method: A successful GIS operates according to a well designed plan and business
rules [24, 25].
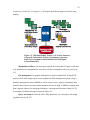
3.1.2 How a GIS Works
Information about world is stored by GIS as a collection of thematic layers that can
be linked together by geography. This is a very powerful and diverse concept which
implemented correctly can solve many real world problems such as modeling global
atmospheric circulation, to predicting rural land use, and monitoring changes in rainforest
ecosystems [24, 25].
GIS tasks: GIS’s perform seven tasks [24, 25].
Input of data
Map making
Manipulation of data
File management
Query and analysis
Visualization of results
Input of Data: GIS accepts data in a digital format. The process of converting data
from paper maps or aerial photographs in to computer files is called digitizing. Today, GIS
technology can automate this process fully for large projects using scanning technology;
smaller jobs may require some manual digitizing which requires the use of a digitizing table.
There are many types of geographic data already exit in GIS-compatible formats. These data
can be loaded directly into a GIS [24, 25].
Map Making: Maps are extremely important to GIS. There are some traditional
manual as well as automated cartography techniques for making maps with GIS. But making
maps with GIS is flexible. It begins with database creation and then we digitize the paper
map into a GIS compatible format. The database will be continuous and scale free since it is
GIS based cartographic. We can then create map products highlighting any location
22
irrespective of scale [24, 25]. Figure 3.1 [25] depicts the different stages involved in map
making.
Figure 3.1. GIS Map Making. Source: A. E. THROCKMORTON,
Geographic Information Systems. Westminster University,
http://www.westminster.edu/staff/athrock/GIS/GIS.pdf,
accessed June 2011.
Manipulation of Data: The data types required for a particular GIS project will need
to be transformed or manipulated in some way to make it compatible with your system [24,
25].
File management: Geographic information is stored as simple files for small GIS
projects, while other might require a more sophisticated file management system. Using a
database management system (DBMS) it will be easier to store, organize and manage data
when the data volumes are large and the numbers of users are high. A DBMS is nothing more
than computer software for managing a database—an integrated collection of data [24, 25].
An example of relational design is shown in Figure 3.2.
Query and Analysis: After the GIS is fully functional; you can begin to ask simple
questions such as [24, 25].
23
Figure 3.2. Relational design. Source: A. E. THROCKMORTON,
Geographic Information Systems. Westminster University,
http://www.westminster.edu/staff/athrock/GIS/GIS.pdf,
accessed June 2011.
Distance between two places?
What are the state boundaries?
What is the area of California?
Where to build a new School?
Visualization: Geographic operations output is best visualized as a graph or a map.
GIS provides provision to attach reports to maps and final display can include 3-D images
[24, 25].
3.2 ADVANTAGES OF GIS
The Modern GIS allows us to group multiple sets of geographic information and
automate within one piece of software [26].
GIS can support larger amounts of data.
GIS covers the large study area.
24
GIS is faster and more efficient
GIS applications save time and money
GIS can cope with unlimited and frequent edits and changes
GIS is robust and resistant to damage
3.3 DISADVANTAGES OF GIS
GIS requires enormous amount of attribute data inputs which can be slow to process
[26].
As earth is round the geographic error is increased as you get into a larger scale.
3.4 OVERVIEW
Visualization is the best way to understand and remember things. This application
allows the users to view the journey of one of the longest infantry mach in the United States
history also showing their journey form Iowa to San Diego.
MapObjects is the lightweight GIS software that can be used to create and customize
GIS applications. This report discusses the different functionalities of MapObjects and how
this is used to make the project. Here the emphasis is given to Mormon Battalion (longest
infantry march during the American-Mexican war in 1846-1847). Chapter 4 describes about
the shapefiles and the various ways to create them and store them. Chapter 5 describes
Netbeans IDE and Map Objects integration. Chapter 6 describes about the technology used.
Chapter 7 describes standard tools and custom toolbars. Chapter 8 describes map objects and
chapter 9 describes future enhancements.
Code used in the project can found in Appendix A. Appendix B lists the step by step
procedure to use this application.
25
CHAPTER 4
SHAPEFILE
This chapter describes the shape files and how to create them.
4.1 SHAPE FILE DEFINITION
A shape file is a digital vector (non topological) storage format used for storing
geometric location and their associated attribute information. The shapefiles handle single
features that overlap or that is noncontiguous. They typically require less disk space and are
easier to read and write [27].
Shapefiles have advantage over other data sources such as faster drawing speed and
edit ability; since a shapefile is non topological it does not maintain spatial relationship
information such as connectivity, adjacency, and area definitions [27].
4.2 HOW SHAPE FILES CAN BE CREATED
Ways to create a Shape File [27].
Export: Using software like ARC/INFO, PC ARC/INFO, Spatial Database Engine
(SDE), ARC View GIS Shapefiles can be created by simply exporting any data
source to a shapefile[27].
Digitize: With the help of ArcView GIS feature creation tools, ShapeFiles can be
created by digitizing shapes [27].
Programming: Using Avenue (ArcView GIS), MapObjects, Arc macro
Language(AML) or Simple Macro Language(SML) software, we can create a
shapefile within our programs [27].
Usage of Tool: Write directly to the shapefile specifications by creating a program
[27].
The shapefiles comprise of three mandatory and several optional files. Three
mandatory files are as follows [27].
.shp – This file is used to store the feature geometry and when added displays the
geometry.
26
.shx – This file is used to store the index of the feature geometry, helpful for
navigation.
.dbf – This file is used to store attributes for different shapes.
4.3 SHAPE FILE
Shape File is denoted by .shp extension. This file stores the feature geometry. A
Shape File has its header fixed with the variable length records. The main header is 100 bytes
in length which contains about 17 fields comprising 9 fields of each 4 bytes and 8 fields of
each eight bytes. Tables 4.1 and 4.2 show the representation of the Shape File. A variable
length record header is 8 bytes in length and mainly consists of two fields which contain data
for record number and content length. There is 1:1 correspondence between the shape type in
the main file header and its contents in the variable length record [27].
Table 4.1. Description of Shape File Header
Position
Byte 0
Byte 4
Byte 8
Byte 12
Byte 16
Byte 20
Byte 24
Byte 28
Byte 32
Byte 36
Byte 44
Byte 52
Byte 60
Byte 68*
Byte 76*
Byte 84*
Byte 92*
Field
File
Unused
Unused
Unused
Unused
Unused
File Length
Version
Shape Type
Bounding Box
Bounding Box
Bounding Box
Bounding Box
Bounding Box
Bounding Box
Bounding Box
Bounding Box
Value
Code 9994
0
0
0
0
0
File Length
1000
Shape Type
Xmin
Ymin
Xmax
Ymax
Zmin
Zmax
Mmin
Mmax
Type
Integer
Integer
Integer
Integer
Integer
Integer
Integer
Integer
Integer
Double
Double
Double
Double
Double
Double
Double
Double
Order
Big
Big
Big
Big
Big
Big
Big
Little
Little
Little
Little
Little
Little
Little
Little
Little
Little
4.4 INDEX FILE
The Index file is denoted by .shx extension. This file is used to store the Index of the
feature geometry. The offset in the index file record which relatively maps to the
27
Table 4.2. Value/Shape Type Mapping
Value
0
1
3
5
8
11
13
15
18
21
23
25
28
31
Shape Type
Null Shape
Point
PolyLine
Polygon
MultiPoint
PointZ
PolyLineZ
PolygonZ
MultiPointZ
PointM
PolyLineM
PolygonM
MultiPointM
MultiPatch
corresponding record in main file. The Index file is identical to shape file header. The file
length stored in the header is the total length of the file which is in 16 bit words [27].
4.5 DBASE FILE
The dbase file is denoted with the .dbf extension. The dBase table gives the details of
the features record in a dBase table defines attributes. Record number is used to map
geometry records with attribute records. Thus, the order of records in the dBase file should
be same as the order of records in main file. The file can be opened and read using Microsoft
Office Excel [27].
Two tables can be joined using the attribute key. The main requirements for a dBase
table are:
There should be one record per shape feature in the table.
The order of the records is defined by the order of the shape features in the main file.
The prefix of the file name should be same as the prefix of shape and Index File. Also
the suffix should be.
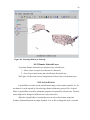
4.6 HOW TO CREATE SHAPE FILE USING CSV FILE
Steps in creating Shape File using CSV file.
1. Download the tool from the following website http://www.wanderingidea.com/
2. Click on the link CSV to Shapefile Converter
28
3. Once the tool is installed load the CSV file in the tool and press convert button as
shown in the Figure 4.1.
Figure 4.1. Shows the CSV file to Shape File Conversion.
29
CHAPTER 5
NET BEANS IDE AND MAP OBJECTS
5.1 ELEMENTARY FACTS
NetBeans IDE (Integrated Development Environment) is an integrated development
environment used to create all sorts of java applications ranging from desktop applications to
Java Web applications. This is a free open source IDE available online on the NetBeans
website [24]. NetBeans core IDE has following modules [28].
1. NetBeans Profiler: This makes your code optimized. What it does is that it
automatically gets rid of various errors to which program is prone to like memory
leaks etc [24]
2. GUI design tool: This design tool enables a user to add GUI components by
providing drag and drop features [24]
3.
NetBeans JavaScript Editor: You wrote the code and now you want to highlight
syntax and class instances. You also want to check browser compatibility checking,
all basic editor features, all CSS editing features, etc. Well the JavaScript editor is the
solution [24]
The following procedure will explain the procedure to add Map Objects libraries to
NetBeans. A user will need following pre-requisites installed before continuing [24].
1. Install Java(SE) Development kit 2 [29].
2. Install NetBeans IDE 6.7.1 [28]
3. Map Objects Java Edition Installation CD can be obtained from Dr. Carl Eckberg.
4. Map Object libraries are integrated with NetBeans.
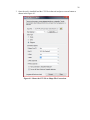
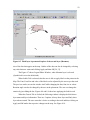
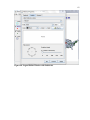
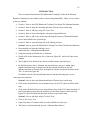
5.2 STEP BY STEP PROJECT CREATION
1. Make a java Application: Refer to Figure 5.1
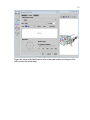
Figure 5.2 shows how to name your project.
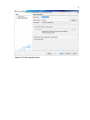
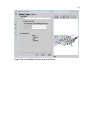
2. Create a new library: Refer to Figure5.3
Select Tools-----Libraries
Select New Library
We can give the library our own name, as shown in the Figure 5.4.
30
Figure 5.1. Select java application from right pane.
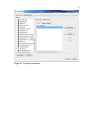
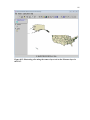
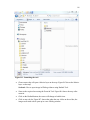
3. Select Classpath and Add JAR files:
Select Classpath Tab as shown in Figure 5.5
Click on Add JAR/Folder button
Traverse to folder C:ESRI/MOJ20/lib to select the Jar files
After selecting JAR files hit ADD JAR/Folder and you are done.
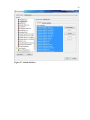
You can select all JAR files at once as Shown in Figure 5.6.
Once added, JAR files can be seen in the Library Classpath as shown in Figure 5.7.
31
Figure 5.2. Choose project name.
32
Figure 5.3. Creating a new library.
33
Figure 5.4. Giving library name.
34
Figure 5.5. Selecting class path.
35
Figure 5.6. Selecting JAR files.
36
Figure 5.7. Added JAR files.
37
CHAPTER 6
TECHNOLOGY
6.1 JAVA
Map Objects Java edition, the name justifies the use of java. Java has significant
advantages over other languages and environments that make it suitable for this application
[24].
Some of advantages of Java are as follows:
Easy to learn: Java is very easy to learn as the syntax is very similar to C/C++.
Moreover Java has been designed to be easy to use and is therefore easy to write,
compile, debug, and learn compared to other programming languages [24].
Object-oriented: I was able to make modular programs and reusable code.
Reusability and extensibility were in my mind while I was deciding on the language
to use in this project. Java enables you to do just that; the individual classes can be
extended and reused to add more features [24].
Platform-independent: One of the requirements was that the tool should be
platform independent. A significant advantage of Java is its ability to be portable. The
ability to run the same program on many different systems is very useful as users can
operate from different systems [24].
Robustness: Reliability is something that no language can promise. A user can come
across error’s while writing and compiling code. Java compiler is really smart when it
comes to error checking; also java does an early error checking which warns the user
about the possible error’s and warnings [24].
Security: Java provides a secured environment for a user [24].
6.2 MAP OBJECTS JAVA EDITION
Often referred as MOJO particularly at San Diego State University. Map Objects Java
Edition is a powerful collection of client and server side components that developers can use
to build custom, cross-platform geographic information system (GIS) applications. This was
chosen because of its features which enable applications to be developed and deployed in an
efficient way. MOJO comes with a suite of high-level visual Java Beans components which
can be integrated with multiple IDE’s. For the development of the thesis Map Objects was
integrated with NetBeans IDE; details on how to integrate NetBeans IDE with Map Objects
can be found in chapter five [24].
38
Key features as cited from the Map Objects Java Edition brochure which can be
found at [30] are following:
Linking of Various Distributed Data Sources: MOJO allows users to pool local
data with data available on internet to create customized data. This customized data
can be simply integrated with the existing application. Some of the data formats
supported are shapefiles, ArcSDE layers, ArcIMS image and feature services, Image
formats such as BMP, TIFF, PNG, JPG, GIF etc [24].
GIS Proficiencies: Applications made using MOJO have some abilities added to
their functionality such as Labeling map features, Thematic mapping, Panning and
zooming through multiple map layers, specifying projections, Querying spatial and
attribute data, performing geometric operations, Measuring distances, displaying real
time geographic data, and creating layouts [24].
Easy to Build a User Interface. GIS Multimedia teaching tool about the Mormon
Battalion in Map Objects has a customized toolbar which was created by bringing in
use swing components with MOJO. A user can easily build applications that include
functional toolbars, dynamic symbol control, query dialogs, overview and insert
maps, and intelligent legends that make your custom applications easy to use and
even easier to develop [24].
39
CHAPTER 7
DEMONSTRATION OF MAPTOOLS
Map Objects Java Edition provides map tools which can be used to perform various
functions on the map. This chapter discusses these tools in detail [31].
7.1 ZOOM PAN TOOL BAR
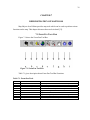
Figure 7.1 shows the Zoom Pan Tool Bar.
Figure 7.1 Zoom Pan Tool Bar.
Table 7.1 gives description about Zoom Pan Tool Bar Functions.
Table 7.1. Zoom Pan Tools
Number
A
B
C
D
E
F
G
H
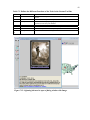
I
Tool
Previous Extent
Next Extent
Zoom to Active Layer
Zoom to Full Extent
Zoom In
Zoom Out
Pan
Pan One Direction
Identify
Function
Zooms to previous extent stored in extent history
Zooms to next extent stored in extent history
Zooms the map to all selected features in selected layer
Zooms the extent to all layers within map
Helps in Zooming in
Helps to undo the ZoomIn tool
Helps in moving to any direction without having to zoom
Pans to any one direction North , South, East or West
Identifies any area in active layer
40
Previous Extent: The Previous Extent tool allows users to quickly display the map
back to its previous state.
Next Extent: The Next Extent tool allows users to quickly display the map back to its
next state.
Zoom to Active Layer: By using Zoom to Active Layer tool, user can zoom to the
current selected layer in the TOC (Table of Contents).
Zoom to Full Extent: The Zoom to Full Extent tool allows you to simply return to its
original display of the map. This tool is an extremely important in GIS applications.
Zoom In: Zoom In Tool allows user to zoom in to the map. The Zoom In tool works
in two ways as described below.
1. Select the Zoom In button on the tool bar and then by just clicking on the map
will increase the size of the map.
2. Select the Zoom In button to click and drag on the map to create a selected
zoom area will also get the task done. To make the cursor normal, simply
click on the arrow icon in the toolbar.
Zoom Out: Zoom Out Tool is much more than a simple magnifier. The Zoom Out
tool works in two ways as described below.
1. Select the Zoom Out button on the tool bar and then by just clicking on the
map will reduce the size of the map.
2. Select on the Zoom In button to click and drag on the map to create a selected
zoom area will also get the task done. If you zoom out many times, you can
create a map much smaller than original map and maybe not ever return to the
map to its original size. In such case Zoom to full extent tool can be used.
Pan: The Pan Tool allows you to interactively move the map without changing the
map scale. The intent is to use this feature after zooming in when you are not quite in
the right place but have the scale about right. Steps to use this tool:
1. Click on the Pan Tool to select it, the cursor will change to hand like icon.
2. Click and hold the left mouse button anywhere on the map and than drag the
mouse.
3. To stop panning (dragging) lift your finger from the mouse button.
Pan One Direction: The Pan Direction Tool allows the user to interactively move the
map, without changing the map scale, in different directions (north, south, east, and
west). Clicking on it gives you a menu of four actual tools like Pan East (->). If you
click on this icon, you will pan to the east without ever bringing the mouse near the
map.
Identity: Identify tool is the icon which has small case I letter in the middle of a dark
colored circle. Identify tool is used to get the information of the location where the
user clicks by first selecting Identify tool from the toolbar. For Example: If the user
41
selects Identify button and clicks on one of the states on the map, a new form pops up
with corresponding state’s record. Steps to use this tool:
1. Select Identify Tool. Click the location on the map whose information is
required.
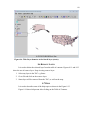
7.2 SELECTION TOOL BAR
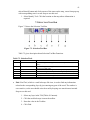
Figure 7.2 shows the Selection Tool Bar.
Figure 7.2. Selection Tool Bar.
Table 7.2 gives description about Selection Tool Bar Functions.
Table 7.2. Selection Tools
Number
A
Tool
Search
B
Find
C
D
E
F
G
Query Builder
Select Features
Clear All Selections
Buffer
Attributes
Function
Opens a dialog for locating features based on a pre defined “stored
query”
Opens a dialog for locating features whose attributes contain an
end-user provided string
Is to aid the user in defining a database SQL style query
Tool for selecting features by rubber banding a shape in the map
Clears all the selections
Displays a zone around a map feature.
Tool to display attributes of currently selected features
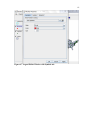
Find: Find Tool, which is a small telescope like icon, is used to find any information
related to the corresponding layer by just entering any part of the word. The textbox is
case sensitive, so the user should write the word by keeping case sensitiveness in mind.
Steps to use this tool:
1. Select any layer in the TOC(Table of Contents).
2. Click the small telescope icon on the toolbar.
3. Enter the value in the TextBox.
4. Click Find.
42
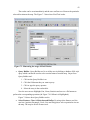
The results can be seen immediately and the user can Pan to or Zoom to the particular
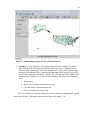
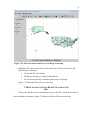
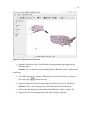
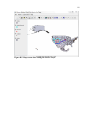
selected location on the map. The Figure 7.3 shows how Find Tool works.
Figure 7.3. Illustrating the usage of Find Window.
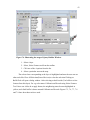
Query Builder: Query Builder tool is to aid the user in defining a database SQL style
query which can then be used to select certain features from the map. Steps to use
Query Builder tool:
1. Click on the Query Builder icon.
2. Click the field name that you want to query.
3. Click or type the query operator.
4. Select the entry in the results table.
Now the user can use Highlight, Pan, Zoom, Statistics and save to a file buttons to
perform the corresponding operations (In Figure 7.4 California is Highlighted).
Figure 7.4 shows how Query Builder works.
Select Features, Clear All Selection and Buffer: By using select features tool, the
user has 4 options (Rectangle, Circle, Line and Polygon) to select a particular area on
the map. The steps to Select Features tool:
43
Figure 7.4. Illustrating the usage of Query Builder Window.
1. Select a layer.
2. Select, Select Features tool from the toolbar.
3. Click one of the 4 options from the list.
4. Select a particular area on the map.
The selected area corresponding to the layer is highlighted and now the user can use
other tools like Clear All Selection(Eraser like icon) to clear the selection Clicking on
BufferTool will open a dialog window. After selecting a check beside (Use buffer to select
features from this layer). For e.g select states California and Nevada using Select Features
Tool. Once user clicks ok or apply button, the neighboring states become highlighted in
yellow, and a little buffer is drawn around California and Nevada. Figures 7.5, 7.6, 7.7, 7.8
and 7.9 show how these tools are used.
44
Figure 7.5. Select Feature, Tool with rectangle selected.
Figure 7.6. Area on the map is selected.
45
Figure 7.7. Illustrating the usage of Clear All Selection tool.
Attributes: A table (with rows and columns) like icon is the Attribute icon which
when clicked on the map shows the attributes of the active layer. Attribute table is
associated with a theme/layer, stored as a database file (*.dbf), which contains large
amounts of data about the layer. Attribute table has many fields, such as name of the
state, its name, and latest population, so forth. The *.dbf files has all the fields related
to the attributes of the layer, it is also known as database file. Steps to use Attributes
tool:
1. Select a layer.
2. Select, Select Features tool from the toolbar.
3. Click one of the 4 options from the list.
4. Select a particular area on the map.
Click on Attributes tool and the information of the selected area (highlighted) appears
in the form of a table. This can be shown with the help of the Figure 7.10.
46
Figure 7.8. Illustrating the usage of Buffer tool, Buffer Window.
7.3 CUSTOM TOOL BAR
This Tool Bar is created to assist the user needs and make working experience user
friendly. The Custom tool bar allows user to perform some vital functions without navigating
any further. The Figure 7.11 shows the custom tool bar.
Table 7.3 gives description about Custom Tool Bar Functions.
Hotlink: Hotlink tool is represented by lightning bolt icon. If you click on the
lightning bolt icon and then click on any dot on the map, the images associated with
the respective dot pops up and with the some description and a link to respective
website. JDialog window was used to show the image. This can be seen in Figure
7.12.
JDialog window was used to show the image. The image contains Mormon Battalion
name and picture, date, details and webpage describing Mormon battalion journey. The link
to the web pages are stored in .csv file which can be edited by the user and the links can be
changed anytime as per the need. Steps to add Text to the Picture.
47
Figure 7.9. Illustrating after clicking ok button on the buffer window.
1. Go to website http://picfont.com/
2. Upload your picture from your local folder
3. Press on upload button
4. Type in the required text and color press generate button.
5. Text on the picture is generated drag it to the desired position and save the
picture to the destination folder.
Print: Print Tool is a printer like icon on the toolbar that allows the user to print the
map.
Add Layer: Geographic data is represented on a map as a layer. A layer might
represent a particular type of feature such as states, capitals, mines, highways, etc. A
layer defines how to display the geographic data it references and where that data is
located in your database. A layer references the data stored in geodatabases, shape
files, and so on, rather than actually storing the geographic data. To Add a Layer to
the map.
1. Click the “Add Layer” Icon on the tool bar or go to File menu -> Add Layer.
2. In Shape file name field, navigate to the folder that contains the layer. For:
example: C:\-> Mormon->Data->Mexico->states.shp.
48
Figure 7.10. Attribute Table with selected area highlighted.
Figure 7.11. Custom Tool Bar.
49
Table 7.3. Defines the Different Functions of the Tools in the Custom Tool Bar
Number
A
Tool
HotLink
B
C
Print
Add layer
D
E
F
Arrow
Measurement Tool
Line Tool
XY Layer
Function
When clicked on opens new window with four images associated
with it.
Allows the user to print the map
Defines how to display the geographic data it references and where
the data is located in your database.
This tool brings the cursor back to mouse pointer
Tool used to measure a distance on the map
Tool used to plot the Battalion journey from start to end.
Used to add the customized layer
G
Figure 7.12. Lightning bolt used to open a jdialog window with Image.
50
3. Click the layer and click open.
4. In Select a layer window, click Ok. The new layer appears on your map.
Arrow: The arrow icon is used to change the cursor back to pointer. For Example: If
the user selects Zoom In tool and after zooming user wants to make the cursor normal
so that the Zoom In functionality turns off, then the user should click on arrow tool.
Measurement Tool: Select this tool click the starting point on the map and drag the
cursor to the end point. A blue line will appear on the map with its distance in the
bottom. This is shown in the Figure 7.13.
Figure 7.13. Shows the distance of line.
Line Tool: When clicked on this tool will show the route taken by Mormons in their
journey from Council Bluffs Iowa to San Diego, California. Steps in making the
Mormon layer appear on the map.
1. First click on the checkbox next to Mormon layer in the TOC will make the
Red dots (Mormon layer) appear on the map.
2. Click on the Line Tool in the toolbar . Blue line will appear connecting the red
dots showing the route of Mormons journey. The Figure 7.14 Shows route
from Iowa to San Diego
51
Figure 7.14. Shows the route from Iowa to San Diego on the map.
XY Layer: XY Layer feature tool is used to add a layer. This tool is used to add
Mexico Layer on the map.
1. Click on the XY Layer Button
2. The browser will open C:\Mormon\Data\Mexico
3. You can select states.shp to add the Mexico layer on the map.
Figure 7.15 shows the Mexico Layer on the map.
7.4 HOW TO ADD A STATE OF DESERET LAYER ON THE
MAP
Click on the checkbox next to stateofdeseret layer in the TOC will show the State of
Deseret boundary on the map. Figure 7.16 Shows the State of Deseret on the map.
52
Figure 7.15. UI shows newly added Mexico layer.
53
Figure 7.16. Shows the State of Deseret on the map.
54
CHAPTER 8
MAP OBJECTS
MapObjects is the framework developed by ESRI and the user can make custom and
cross-platform applications by using this framework. There are 2 flavors of MapObjects, Java
Edition and Windows Edition. The user can create lots of applications using MapObjects
framework. Programmers have to develop other application of their own, because Map
Objects does not provide all the features. For example MapObjects doesn’t provide any
means to display the database file (*.dbf) and it is generally opened by Excel-Sheet or by
Jtable which is user programmed [26].
MapObjects provides an API to software developers in the form of the java JAR files.
One thing that is worth here mentioning is that MapObjects allow programmers to develop
their own custom client or their own standalone GIS based software applications [26].
8.1 MAP OBJECTS SUPPORT FEATURES
Geodatabases: Read-only access to default geodatabases is supported by Map
Objects. MapObjects doesn’t support complex functionality with geodatabases such
as relationship, classes, etc [26].
GIS capabilities: GIS applications that are ready to use are useful in various ways
such as displaying geographic data, zooming (Zoom in, Zoom out) map layers,
performing geometric operations and measuring distances [26].
Data compatibility: Mapobjects applications read from ArcIMS Image or Feature
services. A feature service allows us to stream geographic data to client applications.
Mapobjects reads from shapefiles (.shp files) and supports imageformats such as
BMP, TIF, GIF and JPG [26].
Combine distributed data sources: MapObjects applications can also combine with
any existing applications. So the existing applications can be used by appending Map
Objects to it [26].
8.2 MAP OBJECTS ATTRIBUTE TABLE
Associated with any theme/layer there is usually an attribute table. Attribute table is
stored as a database file which contains modest to large amount of data about the theme.
These database files are *.dbf such as states.dbf, capital.dbf and can be easily opened through
55
the excel files. These *.dbf files are part of files of shapefile of ESRI. The dbf files are called
attribute file format. Attribute for each file is stored in the dBase format. First shape in the
file is related with the first record in the dbf file. Attribute table gives the data associated with
the active layer. To open an attribute table, select a layer then go to Theme->Open Attribute
Table [26, 31]. The Figure 8.1 displays how to go to Open Attribute Table from Theme
menu, when Mormon layer is selected.
Figure 8.1. Theme menu.
After opening the attribute table, the data is represented as follows in Figure 8.2.
In the similar way, the information of all the layers can be obtained by opening
attribute table.
8.3 CREATING LAYER FROM SELECTION
A layer can be created that has only the selected attributes from the portion of the
Map selected in accordance with the active layer [26, 31].
56
Figure 8.2. Attribute table for Mormon layer.
Here are the steps to create a layer from Selection:
Select a layer.
Select, Select Features tool from the toolbar.
Click one of the 4 options from the list.
Select a particular area on the map.
Go to Theme menu and select Create Layer from Selection.
The Figure 8.3 shows how a customized layer is created:
After clicking on Create Layer from Selection a new window for creating a new
shapefile appears.
Replace the text in the textbox as shown in the Figure 8.3 and hit ENTER and then
click OK.
57
Figure 8.3. Creating layer from selection.
8.4 LAYER CONTROL
Layer control refers to the fact that user can select any layer and perform 2 functions,
Promote Selected Layer and Demote Selected Layer [26, 31].
In the Figure 8.4, layer ‘capitals’ is selected.
8.4.1 Promote Selected Layer
To perform Promote Selected Layer operation on a selected layer:
1. Select a layer (except a layer that can’t be promoted).
2. Go to LayerControl menu and select Promote Selected Layer.
The Figure 8.5 shows the result of using Promote Selected Layer on capitals layer.
58
Figure 8.4. Selecting third layer from top.
8.4.2 Demote Selected Layer
To perform Demote Selected Layer operation on a selected layer:
1. Select a layer (except a layer that can’t be demoted).
2. Go to LayerControl menu and select Demote Selected Layer.
The Figure 8.6 shows the result of using Demote Selected Layer on Mormon layer.
8.5 LEGEND EDITOR
Legend Editor is used to set the classification ranges, colors, marker symbols, etc. for
the themes. It can be opened by first selecting a theme and then by going to File->Legend
Editor. Legend Editor is used for getting the properties of a particular selected layer. The dots
on the Map can be changed to different sizes, styles and colors.
When the Legend Editor is opened then user can select draw feature using One
Symbol, Graduated Symbols or unique Symbols. User is able to change the Style, color and
59
Figure 8.5. Third layer is promoted in place of the second layer (Mormon).
size of the dots that appear on the map. Outline of the dots can also be changed by selecting
any color that user wants and clicking Apply and then OK [26, 31].
The Figure 8.7 shows Legend Editor Window, when Mormon layer is selected
(Symbol tab is set as the default tab).
When Labels Tab is selected, then the user is able to apply labels on the points on the
Map. The Font, Font Size and color of the labels can be adjusted by the user as per the need.
The preview can be seen on the window itself while changing the font, font size or colors.
Rotation angle can also be changed by the user in the placement. The user can change the
rotation by just sliding the bar. Figures 8.8 and 8.9 show how applying the Labels work.
When the General Tab is clicked, the following window is displayed which shows
layer name and layer information. There are 2 options, Always show layer and Only show
layer when zoomed. The user can make a choice according to the need and then clicking on
Apply and OK makes the respective changes on the map. See Figure 8.10.
60
Figure 8.6. Third layer demotes to the fourth layer (states).
8.6 REMOVE LAYER
It is used to delete the selected layer from the table of contents. Figures 8.11 and 8.12
show the use of remove layer. Steps in using remove layer.
1. Select any layer in the TOC e.g States.
2. Go to file and click on the remove layer
3. States layer will be removed from the TOC, as well on the map.
8.7 HELP
It is used to describe some of the help topics as shown in the Figure 8.13.
Figure 8.14 shows help menu after clicking on the Table of Contents.
61
Figure 8.7. Legend Editor Window with Symbols tab.
62
Figure 8.8. Legend Editor Window with Labels tab.
63
Figure 8.9. Name is the label feature, color is blue and rotation is 18 degrees. The
effect can be seen on the map.
64
Figure 8.10. Legend Editor Window with General tab.
65
Figure 8.11. Showing the use of remove layer.
66
Figure 8.12. Illustrating after using the remove layer tool on the Mormon layer in
the TOC.
67
Figure 8.13 Illustrating the help menu.
68
Figure 8.14. Illustrating the help menu Table of Contents.
69
CHAPTER 9
FUTURE ENHANCEMENTS
1. The web pages can be changed in accordance to end user need.
2. Any other infantry march in the history of the world can be shown on the map.
3. Extend the software to support different languages, especially Spanish.
4. Brigham Young march to Salt Lake City, Utah can be shown on the map.
70
REFERENCES
[1]
WIKIPEDIA, Mormons. Wikipedia, http://en.wikipedia.org/wiki/Mormons, accessed
May 2011, n.d.
[2]
WIKIPEDIA, Mormonism_and_polygamy. Wikipedia,
http://en.wikipedia.org/wiki/Mormonismandpolygamy, accessed August 2011, n.d.
[3]
DELSJOURNEY, Mormons and polygamy. DelsJourney,
http://www.delsjourney.com/close-ups/us/travels_sw/mormons_and_polygamy .htm,
accessed August 2011, n.d.
[4]
WIKIPEDIA, State of Deseret. Wikipedia, http://en.wikipedia.org/wiki/State_of_
Deseret, accessed August 2011, n.d.
[5]
WIKIPEDIA, Deseret News. Wikipedia, http://en.wikipedia.org/wiki/Deseret_News,
accessed September 2011, n.d.
[6]
PBS, US Mexican War. PBS, http://www.pbs.org/kera/usmexiacnwar/war, accessed
May 2011, n.d.
[7]
THE HISTORY GUY, The US-Mexican War from 1846-1848. The History Guy,
http://www.historyguy.com/american_history/Mexican-American_War.html,
accessed May 2011, n.d.
[8]
T. DANIEL, A Concise History of the Mormon Battalion in the Mexican War 18461847, The Rio Grande Press Inc., Glorieta, New Mexico, 2010.
[9]
WIKIPEDIA, Battalion. Wikipedia, http://en.wikipedia.org/wiki/Battalion, accessed
May 2011, n.d.
[10]
N. B. RICKETTS, The Mormon Battalion : U.S. Army of the West 1846-1847, Utah
State University Press, Logan, Utah, 1996.
[11]
OL BUFFALO, Mormon Battalion. Ol Buffalo, http://www.three-peaks.net/
battalion.htm, accessed May 2011, n.d.
[12]
S. L. FLEEK, History may be Searched in Vain: A Military History of the Mormon
Battalion, The Arthur H. Clark Company, Spokane, Washington, 2008.
[13]
WIKIPEDIA, Mormon Battalion. Wikipedia, http://en.wikipedia.org/wiki/Mormon_
Battalion, accessed August 2011, n.d.
[14]
CALIFORNIA PIONEER HERITAGE FOUNDATION, Cooke’s wagon road. California
Pioneer Heritage Foundation, http://californiapioneer.org/for-history-buffs/mormonbattalion /Cooke’s-wagon-road, accessed August 2011, n.d.
[15]
WIKIPEDIA, HardTack. Wikipedia, http://en.wikipedia.org/wiki/Hardtack, accessed
May 2011, n.d.
[16]
WIKIPEDIA, Jerkey. Wikipedia, http://en.wikipedia.org/wiki/Jerkey, accessed May
2011, n.d.
71
[17]
WIKIPEDIA, Pemmican. Wikipedia, http://en.wikipedia.org/wiki/Pemmican, accessed
May 2011, n.d.
[18]
SDJEWISHWORLD, San Diego’s historic places: Mormon Battalion Museum.
http://sdjewishworld.wordpress.com/2010/05/12/san-diegos-historic-places-mormonbattalion-museum/, accessed August 2011, n.d.
[19]
LDS, San Diego Mormon Battalion Historic Site. LDS, http://lds.org/placestovisit/
eng/historical-sites/san-diego-mormon-battalion-historic-site, accessed August 2011,
n.d.
[20]
MISSIONTOUR, Mission San Diego de Alcalá. Mission Tour, http://missiontour.org/
sandiego/index.htm, accessed August 2011, n.d.
[21]
LDS CHURCH TEMPLES, San Diego California Temple. LDS,
http://www.ldschurchtemples.com/sandiego, accessed August 2011, n.d.
[22]
WIKIPEDIA, Brigham Young. Wikipedia, http://en.wikipedia.org/wiki/Brigham_
Young_(film), accessed August 2011, n.d.
[23]
ESRI, Homepage. Gis, http://www.gis.com/, accessed June 2011, n.d.
[24]
A. LATTA, Polyline and polygon plotting in map objects, Master’s thesis, San Diego
State University, San Diego, CA, 2010.
[25]
A. E. THROCKMORTON, Geographic Information Systems. Westminster University,
http://www.westminster.edu/staff/athrock/GIS/GIS.pdf, accessed June 2011, n.d.
[26]
S. CHINTHA, Location based software support for California water resourses
education, Master’s thesis, San Diego State University, San Diego, CA, 2010.
[27]
ESRI, ESRI Shapefile technical description. ESRI,
http://www.esri.com/library/whitepapers/pdfs/shapefile.pdf, accessed June 2011, n.d.
[28]
NETBEANS, NetBeans IDE download. Netbeans, http://www.netbeans.org/downloads,
accessed May 2011, n.d.
[29]
ORACLE, Java JDK downloads. Java, http://java.sun.com/javase/downloads/index.jsp,
accessed September 2008, n.d.
[30]
ESRI, MapObjects Java Edition Manual, Esri Press, Redlands, California, 2003.
[31]
C. ECKBERG, Course notes for CS 537 Components of GIS Architecture. Unpublished
course notes, 2009.
WORKS CONSULTED
N. HARLOW, California Conquered: War and Peace on the Pacific 1846-1850,
University of California Press, Berkeley, CA, 1982.
72
APPENDIX A
SOURCE CODE USED IN THE PROJECT
73
Code to draw polyline that shows the Mormon Battalion Journey from Iowa to San
Diego
Code to add State Of Deseret on the map
Code for adding XY layer
************************************************************************
CLASSNAME
DrawLine
DESCRIPTION
To draw a polyline between Iowa to San Diego
AUTHOR
Ashwini Govindagoudar
************************************************************************
class DrawLine extends Tool
{
java.awt.Cursor boltCursor = null;
BasePointsArray bpa = new BasePointsArray();//that stores 1
or more points within a pair of
//coordinate arrays,1 array for x coordinate and the other
for y coordinate
java.text.DecimalFormat df = new
java.text.DecimalFormat("0.00");
MyThread childTh = null;// declaring thread
Map map = Mormon.map;
SimpleMarkerSymbol sms = new SimpleMarkerSymbol();
SimpleLineSymbol sls = new SimpleLineSymbol();
PointCollection pc = new BasePointsArray();
double distance;
AcetateLayer acetLayer1 = new AcetateLayer() {
public void paintComponent(java.awt.Graphics g) {
java.awt.Graphics2D g2d = (java.awt.Graphics2D) g;
//
g2d.setTransform(map.getWorldToPixelTransform().toAffine());
g2d.transform(map.getWorldToPixelTransform().toAffine());
g2d.setClip(map.getExtent());
for (int i = 0; i < pc.size(); i++)
{
sms.draw(pc.getPoint(i), g2d, "");
}
if (pc.size() >= 2)
{
System.out.println("pc size====="+pc.size());
74
FeatureGeometry geom = new BasePolyline(new
BasePath(pc));
sls.draw(geom, g2d, "");
}
//map.repaint();
map.redraw();//redraws the map
//Mormon.set_drawln();
}
public void paint(Graphics g) {
try
{
super.paint(g);
}
catch (Exception E)
{
}
}
};
DrawLine()
{
Map map = Mormon.map;
//com.esri.mo2.cs.geom.Point point =
map.transformPixelToWorld(me.getX(),me.getY());
Toolkit tk = Toolkit.getDefaultToolkit();
System.out.println ("Created drawline Object");
System.out.println ("Inside the constructor");
try
{
File file = new
File("c:\\esri\\MOJ20\\examples\\mor3.csv");//opens file from
location
if (file == null)
{
System.out.println ("no file name entered");
Mormon.map.redraw();//redraws the map
return;
}
System.out.println ("file name entered");
FileReader fred = new FileReader(file);//used for
reading character files.
BufferedReader in = new BufferedReader(fred);//read text
from a character input stream
String s; // = in.readLine();
double x,y;
75
String sArr;//captures image from csv file nexttoken
from stingtokenizer
int n = 0;
int i=0, j=0;
while ((s = in.readLine()) != null) //read one line at
at time untill the last line
{
StringTokenizer st = new
StringTokenizer(s,",");//assumes s has fields sepearated by
some
//character and we specify that character to be a
comma
x = Double.parseDouble(st.nextToken());//first field
in csv file x coordiante
// double class
provides methods from double to string and reverse
y = Double.parseDouble(st.nextToken());// second field
in csv file y coordinate
j=0;
sArr = st.nextToken();// image from csv file
System.out.println("======sArr=====" + sArr);
Global.g_image[i]
= sArr;//
Global.num_images[i] = 1;
Global.g_name[i]
= st.nextToken();//next element
in csv
Global.g_date[i]
= st.nextToken();
Global.g_details[i]
= st.nextToken();
Global.g_website[i]
= st.nextToken();
bpa.insertPoint(n++,new
com.esri.mo2.cs.geom.Point(x,y));//mojo insertpoint() chooses
an index and a
//point value, and adds that point to basepointsarray
System.out.println("+++++:Address:++++ "+x
+y+":"+Global.g_name[i]);
while (st.hasMoreTokens()) // more than one images are
printed
{
Global.g_moreimages[i][j++] = st.nextToken();
System.out.println (Global.g_moreimages[i][j-1]);
Global.num_images[i]++;
}
i++;
}
} //try
catch (IOException e)
76
{
System.out.println ("Exception occurred"+e);
}
sms.setType(SimpleMarkerSymbol.STAR_MARKER);
sms.setWidth(4);
sms.setSymbolColor(Color.blue);
sls.setLineColor(Color.BLUE);
sls.setStroke(new BasicStroke(3));
map.add(acetLayer1);
for (int k=0;k<bpa.size();k++)
{
Point p = new Point(bpa.getPoint(k));
pc.addPoint(p);
//Mormon.map.add(acetLayer1);
acetLayer1.repaint();
}
}
public void mouseClicked(MouseEvent me)
{
String x1,y1;
double x2, y2;
double x3, y3;
int match_found = 0;
java.awt.GridBagConstraints gridBagConstraints;
com.esri.mo2.cs.geom.Point worldPoint = null;
worldPoint =
map.transformPixelToWorld(me.getX(),me.getY());
x1= df.format(worldPoint.getX());
x2= Math.round(worldPoint.getX()*100.0)/100.0;
y1 = df.format(worldPoint.getY());
y2= Math.round(worldPoint.getY()*100.0)/100.0;
for (int i=0;i<bpa.size();i++)
{
com.esri.mo2.cs.geom.Point p = new
com.esri.mo2.cs.geom.Point(bpa.getPoint(i));
x3 = Math.round(p.getX()*100.0)/100.0;
y3 = Math.round(p.getY()*100.0)/100.0;
System.out.println("x2: " + x2+ " y2: "+y2+" x3: "+x3+"
y3: "+y3);
if (( x2+1 >= x3)&&(x2-1 <=x3))
{
if (( y2+1 >= y3)&&(y2-1 <=y3))
{
77
match_found = 1;
//stop the child thread if it is already running
if (childTh != null)
{
if (childTh.isAlive() == true)
{
System.out.println ("Child is alive");
childTh.interrupt();
childTh = null;
}
}
childTh = new MyThread(i,x3,y3);
childTh.setPriority(Thread.MIN_PRIORITY); // this
is a lowest priority thread
childTh.setDaemon(true); // causes kid to die when
parent dies
childTh.start();
}
}
if (match_found == 1)//break the loop if match was found
break;
}
}
public void mouseReleased(MouseEvent me) {
}
private void addDistance(Point p) {
if (pc.size() > 0)
{
setDistance(distance + pc.getEndPoint().distance(p));
}
}
private void setDistance(double d) {
distance = d;
}
public void clear() {
pc.removePoints(0, pc.size());
map.redraw();//redraws the map
}
}//End of DrawLine Class
************************************************************************
CLASSNAME
AddXYtheme2
DESCRIPTION
To add a State of Deseret map
AUTHOR
Ashwini Govindagoudar
78
************************************************************************
class AddXYtheme2 extends JDialog
{
Map map = Mormon.map;
JFileChooser jfc = new JFileChooser();//provides a simple
mechanism for the user to choose a file
BasePointsArray bpa = new BasePointsArray();//that stores 1
or more points within a pair of
//coordinate arrays,1 array for x coordinate and the other
for y coordinate
java.text.DecimalFormat df = new
java.text.DecimalFormat("0.00");
Layer layer7 = new Layer();
Legend legend2;
AddXYtheme2() throws IOException
{
setBounds(50,50,750,600);
File file = new
File("c:\\Mormon\\Data\\stateofdeseret\\stateofdeseret.shp");
layer7.setDataset("0;"+file);
map.add(layer7);
java.util.List list = Mormon.toc.getAllLegends();
System.out.println("list ===="+list);//gives the list of
layers in the toc
com.esri.mo2.map.dpy.Layer lay2 =
((Legend)list.get(0)).getLayer();
System.out.println("lay2 ===="+lay2);
try
{
legend2 = Mormon.toc.findLegend(lay2);
System.out.println("legend2 ======="+legend2);
}
catch (Exception e)
{
}
legend2.toggleSelected();
FeatureLayer flayer2 = (FeatureLayer)lay2;
BaseSimpleRenderer bsr2 =
(BaseSimpleRenderer)flayer2.getRenderer();
com.esri.mo2.map.draw.Symbol sym = bsr2.getSymbol();
System.out.println("sym ===="+sym);
com.esri.mo2.map.draw.SimplePolygonSymbol sps =
(com.esri.mo2.map.draw.SimplePolygonSymbol)sym;
79
sps.setPaint(com.esri.mo2.map.draw.AoFillStyle.getPaint(com.es
ri.mo2.map.draw.AoFillStyle.DOWNWARD_DIAGONAL_FILL,java.awt.Co
lor.red));
sps.setStroke(com.esri.mo2.map.draw.AoLineStyle.getStroke(com.
esri.mo2.map.draw.AoLineStyle.DASH_DOT_DOT_LINE,4.5f));
sps.setLineColor(Color.CYAN);
sps.setStroke(new BasicStroke(3));
sps.setFillTransparency(1.0);
sps.setAntialiasing(true);
bsr2.setSymbol(sps);
map.redraw();
} //end of AddXYTheme2 constructor
public void setMap(com.esri.mo2.ui.bean.Map map1)
{
map = map1;
}
} //end AddXYTheme2 Class
************************************************************************
CLASSNAME
AddXYtheme
DESCRIPTION
Add Mexico layer on the map
AUTHOR
Ashwini Govindagoudar
************************************************************************
class AddXYtheme extends JDialog
{
Map map = Mormon.map;
JFileChooser jfc = new JFileChooser();//provides a simple
mechanism for the user to choose a file
BasePointsArray bpa = new BasePointsArray();//that stores 1
or more points within a pair of
//coordinate arrays,1 array for x coordinate and the other
for y coordinate
// this is useful for Dataset implementations that need to
quickly populate a points collection
// with th coordinates of a shape,having a fixed number of
points
java.text.DecimalFormat df = new
java.text.DecimalFormat("0.00");
Layer layer5 = new Layer();
80
AddXYtheme() throws IOException
{
setBounds(50,50,750,600);
File dirInit = new
File("C:\\Mormon\\Data\\Mexico\\");//opens file from location
jfc.setCurrentDirectory(dirInit);//initial folder
jfc.showOpenDialog(this);//opens jdialog
File file = jfc.getSelectedFile();
System.out.println("file =====" +file);
layer5.setDataset("0;"+file);
map.add(layer5);
} //end of AddXYTheme constructor
public void setMap(com.esri.mo2.ui.bean.Map map1)
{
map = map1;
}
} //end AddXYTheme Class
class XYfeatureLayer extends BaseFeatureLayer
{
BaseFields fields;//constructs a field collection with given
number of fields
PointCollection pc = new BasePointsArray();
private java.util.Vector featureVector; //objects of this
class are returned by classifiers
//that have been applied to an object
public XYfeatureLayer(BasePointsArray bpa,Map map,String
address[])
{
createFeaturesAndFields(bpa,map,address);
System.out.println("*************PC size:"+pc.size());
BaseFeatureClass bfc = getFeatureClass("Mormon",bpa);
setFeatureClass(bfc);
BaseSimpleRenderer srd = new BaseSimpleRenderer();
SimpleMarkerSymbol sms = new SimpleMarkerSymbol();
SimpleLineSymbol sls = new SimpleLineSymbol();
com.esri.mo2.map.draw.SimpleFillSymbol sfs
= new
com.esri.mo2.map.draw.SimpleFillSymbol();
sms.setType(SimpleMarkerSymbol.CIRCLE_MARKER);
81
sms.setSymbolColor(new Color(255,0,0));
sms.setWidth(8);
//srd.setSymbol(sms);
srd.setSymbol(sms);
setRenderer(srd);
XYLayerCapabilities lc = new XYLayerCapabilities();
setCapabilities(lc);
}
private void createFeaturesAndFields(BasePointsArray bpa,Map
map,String address[])
{
featureVector = new java.util.Vector();
fields = new BaseFields();
createDbfFields();
for (int i=0;i<bpa.size();i++)
{
System.out.println ("createFeatures and Fields : " + i);
BaseFeature feature = new BaseFeature(); //feature is a
row
feature.setFields(fields);
com.esri.mo2.cs.geom.Point p = new
com.esri.mo2.cs.geom.Point(bpa.getPoint(i));
pc.addPoint(p);
feature.setValue(0,p);
//feature.setValue(1,new Integer(0));
feature.setValue(1,Global.g_name[i]);
feature.setValue(2,Global.g_date[i]);
feature.setValue(3,Global.g_details[i]);
feature.setValue(4,Global.g_website[i]);
feature.setDataID(new BaseDataID("Mormon",i));
System.out.println ("Feature : " +feature);
featureVector.addElement(feature);
}
}
private void createDbfFields()
{
fields.addField(new
BaseField("#SHAPE#",Field.ESRI_SHAPE,0,0));
//fields.addField(new
BaseField("ID",java.sql.Types.INTEGER,9,0));
82
fields.addField(new BaseField("
Name
",java.sql.Types.VARCHAR,40,0));
fields.addField(new BaseField("
Date
",java.sql.Types.VARCHAR,60,0));
fields.addField(new BaseField("
Details
",java.sql.Types.VARCHAR,100,0));
fields.addField(new
BaseField("website",java.sql.Types.VARCHAR,24,0));
System.out.println ("Created db fields : " + fields);
}
public BaseFeatureClass getFeatureClass(String
name,BasePointsArray bpa)
{
com.esri.mo2.map.mem.MemoryFeatureClass featClass = null;
try
{
featClass = new
com.esri.mo2.map.mem.MemoryFeatureClass(MapDataset.POINT,field
s);
}
catch (IllegalArgumentException iae)
{
}
featClass.setName(name);
for (int i=0;i<bpa.size();i++)
{
featClass.addFeature((Feature)
featureVector.elementAt(i));
System.out.println("featClass" +
featureVector.elementAt(i));
}
return featClass;
}
private final class XYLayerCapabilities extends
com.esri.mo2.map.dpy.LayerCapabilities
{
XYLayerCapabilities()
{
for (int i=0;i<this.size(); i++)
{
setAvailable(this.getCapabilityName(i),true);
setEnablingAllowed(this.getCapabilityName(i),true);
getCapability(i).setEnabled(true);
}
}
83
}
}//XYFeature class
84
APPENDIX B
USER MANUAL FOR GIS MULTIMEDIA
TEACHING TOOL ABOUT MORMON
BATTALION
85
INTRODUCTION
The user manual demonstrates GIS Multimedia Teaching Tool about the Mormon
Battalion. Snapshots are provided in order to ensure comprehensibility. There are six sections
in the user manual:
Section 1: How to start GIS Multimedia Teaching Tool About The Mormon Battalion
Section 2: How to show the Mormon and State of Deseret layer on the map
Section 3: How to add layer using XY Layer Tool.
Section 4: How to browse through the web pages using hotlink tool.
Section 5: How to add a route on the map showing the journey of Mormon Battalion
from Council Bluff Iowa to San Diego.
Section 6: How to open the link given in the JDialog window.
Section 1: How to start GIS Multimedia Teaching Tool About The Mormon Battalion
Download the tool from the link:http://wwwrohan.sdsu.edu/~eckberg/MormonBattalion-
Unzip the package and install into C:\Mormon\
Double click on the Mormon.jar file, as shown in Figure B.1, which will open a new
window.
The Graphical User Interface has menus, toolbar buttons, map and layers.
By default capitals, States , Mormon and stateof deseret layers are added. Only
capitals and states layer are displayed with the selected checkbox in the TOC .
Mormon and State of Deseret layer are displayed with the unselected checkbox in the
TOC, as shown in Figure B.2.
If installed correctly, this should launch the tool and the following home screen
comes up as shown below.
Section 2: How to show the Mormon and State of Deseret layer on the map
Click on the unchecked box next to Mormon layer, in the TOC shows red dots on the
map.
Click on the unchecked box next to stateofdeseret layer in the TOC shows the State of
Deseret boundary proposed by the members of Later Day Settlers in Salt Lake City.
Figure B.3 shows the Momorn and State of Deseret layer on the map.
Section 3: How to add layer using XY Layer Tool:
Click on XY Layer Tool
Figure B.4 shows XY button which is used to add Mexico state layer
The browser will automatically open in c:\Mormon\Data\Mexico
86
Figure B.1. Launching the tool.
Choose states.shp will open a Mexico layer on the map. Figure B.5 shows the Mexico
layer on the map.
Section 4: How to open image in JDialog widnow using Hotlink Tool:
Zoom to the required area using the Zoom In Tool. Figure B.6 shows the map after
zoom in.
Click on the Hotlink button, the cursor will change to hotlink icon.
Click on any red dot. Figure B.7 shows that when the user clicks on the red dot, the
images associated with it open up in a new JDialog window.
87
Figure B.2. Initial screen of the tool.
Similarly all the dots can be clicked and the corresponding images appear in the
JDialog window.
Section 5: How to add the route describing Mormon Battalion journey from Iowa to
San Diego
To add line showing the journey of Battalion from Iowa to San Diego, you have to
first click on the
button as shown.
Figure B.8 shows the blue line connecting the red dots from Iowa to San Diego
Section 6: How to open webpage to get more information about Mormons:
Click on the link displayed at the bottom of the JDdialog window in Figure B.7
Figure B.9 shows the webpage that results from clicking on the link.
88
Figure B.3. Shows the Mormon and State of Deseret on the map.
Figure B.4. XY button.
89
Figure B.5. Map screen after adding the Mexico Layer.
90
Figure B.6. After using zoom in button.
91
Figure B.7. Shows the Jdialog window with the image.
92
Figure B.8. Describing Battalion journey from Iowa to San Diego.
93
Figure B.9. Shows the websites associated with the link.