1
and basic statistical analysis allowing student researchers to collect data and “play with the
data” in a single environment. The tool supports visualization of a single data set, several data
sets side-by-side or overlaid, cursor paths, spatial variability of cursor selection end points,
and cursor kinematics. Lastly, its internal object-oriented architecture makes extensions to the
tool relatively simple.
MTE is based upon a distributed architecture in which a researcher controls experiments from
one workstation while the subjects interact with the software on different workstations. This is
particularly useful for students conducting experiments and collecting data remotely.
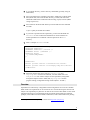
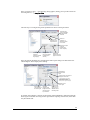
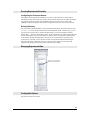
The overall platform capabilities are summarized in the UML (Unified Modeling Language)
use case model to the left.
The papers listed in the references section at the end of the manual demonstrate the use of
MTE.
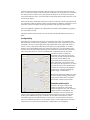
Configurability
Experiments are configured in two steps. The researcher first creates an experiment setup
which specifies session invariant parameters, including target extent, target shape type (oval,
rectangular, moving, or soft keypad), home region placement (center, upper left corner of
screen, or none), target position distribution (reciprocal, pre-programmable, or random),
auditory and visual feedback preferences, number of repetitions, type of movement (pointand-click versus drag-and-drop) and the type of information to be recorded for each aiming
task (cursor path and errors). The saved and sharable configuration files are used in the
second step, which is running the
experiment. The researcher can recall a
previously recorded configuration from a
list of stored setups. Before each
experimental session, input device type,
screen dimension, probe characteristics,
gain settings for the input device, as well as
any other relevant ad hoc information are
recorded. For each subject, demographic
information is collected, including age,
gender, height, and handedness.
MTE can be extended by adding new static
as well as dynamic (moving) shape types,
target position distributions, movement
time models, and data export formats.
Evaluation and Analysis
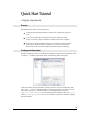
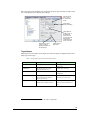
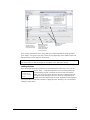
To assist in the rapid evaluation and
interactive exploration of movement
models and input devices, basic statistical
analysis is built into the platform. The
recorded data can be easily exported to many statistical packages for more sophisticated
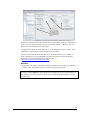
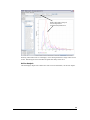
analysis. MTE supports correlation analysis and linear regression, as well as configurable
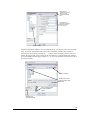
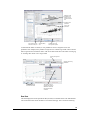
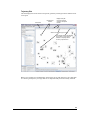
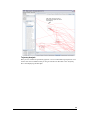
scatter plots and distribution graphs. In addition, the raw data and the trajectory of the
individual acquisition movements during a session can be viewed so that the movement
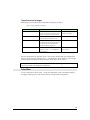
patterns for different input devices can be studied. Lastly, a table comparing the correlation
coefficients of various movement time models, including Fitts’ law is displayed.
8