1
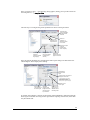
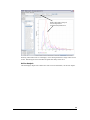
The linear regression coefficients and the correlation coefficients can be computed either on
the raw observations or averaged MT values across ranges of ID attenuating the effect of
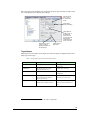
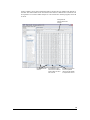
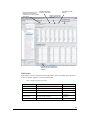
outliers. A sortable table containing collected trial data can be drawn on to identify outliers.
Exporting to Other Tools
The tool records the experiment configuration and the data for each movement trial in a
persistent and sharable XML document. While the statistical mechanisms built into MTE are
certainly useful, they are limited but easily augmented by specialized statistics packages. The
data can be copied to the clipboard or saved as CSV files for import into Microsoft Excel and
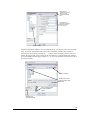
statistical analysis packages, such as R. Although the plotting capabilities of MTE are useful
for interactive exploration, they are not configurable enough for publication. Both R and
Microsoft Excel offer better support in that area.
Feedback
This manual is a continuous work in progress. Your feedback and additions are welcome. If
you would like to edit the manual, please let us know and we will send you the Word file for
modification. You can contact us at [email protected].
9