1
1.1.4
THE WATCH WINDOW
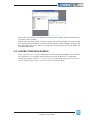
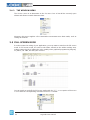
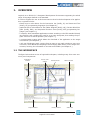
The Watch window is one of the many debugging tools supplied by LogicLab. Among the
other debugging tools, it is worth mentioning the Oscilloscope (see Paragraph 9.2), triggers, and the live debug mode (see Paragraph 9.4).
1.1.5
THE LIBRARY WINDOW
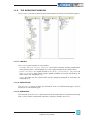
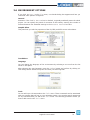
The Library window contains a set of different panels, which fall into the categories explained in the following paragraphs.
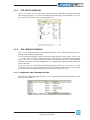
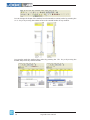
You can choose the display mode by clicking the right button of your mouse. In the View
list mode, each element is represented by its name and icon. Instead, a table appears
in the View details mode, each row of which is associated with one of the embedded
elements. The latter mode also displays the Type (Operator/Function) and the description
of each element.
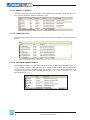
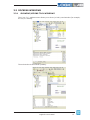
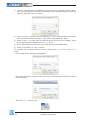
If you right-click one of the elements of this panel, and you click Object properties from
the dialog box, then a window appears with further details on the element you selected
(input and output supported types, name of input and output pins, etc.).
1.1.5.1 OPERATORS AND STANDARD BLOCKS
7KLVSDQHOOLVWVEDVLFODQJXDJHHOHPHQWVVXFKDVRSHUDWRUVDQGIXQFWLRQVGH¿QHGE\WKH
IEC 61131-3 standard.
LogicLab user manual
3